Current ratio of jamuna oil industry
•Transferir como DOCX, PDF•
1 gostou•1,069 visualizações


Recomendados
Mais conteúdo relacionado
Mais procurados
Mais procurados (20)
Semelhante a Current ratio of jamuna oil industry
Semelhante a Current ratio of jamuna oil industry (20)
Mais de Ãkash Raƞga
Mais de Ãkash Raƞga (11)
Último
Último (20)
Current ratio of jamuna oil industry
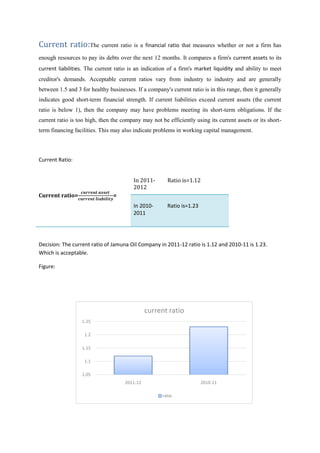
- 1. Current ratio:The current ratio is a financial ratio that measures whether or not a firm has enough resources to pay its debts over the next 12 months. It compares a firm's current assets to its current liabilities. The current ratio is an indication of a firm's market liquidity and ability to meet creditor's demands. Acceptable current ratios vary from industry to industry and are generally between 1.5 and 3 for healthy businesses. If a company's current ratio is in this range, then it generally indicates good short-term financial strength. If current liabilities exceed current assets (the current ratio is below 1), then the company may have problems meeting its short-term obligations. If the current ratio is too high, then the company may not be efficiently using its current assets or its short- term financing facilities. This may also indicate problems in working capital management. Current Ratio: Current ratio= = In 2011- 2012 Ratio is=1.12 In 2010- 2011 Ratio is=1.23 Decision: The current ratio of Jamuna Oil Company in 2011-12 ratio is 1.12 and 2010-11 is 1.23. Which is acceptable. Figure: 1.05 1.1 1.15 1.2 1.25 2011-12 2010-11 current ratio ratio
- 2. Quick ratio:In finance, the Acid-test or quick ratio or liquid ratio measures the ability of a company to use its near cash or quick assets to extinguish or retire its current liabilities immediately. Quick assets include those current assets that presumably can be quickly converted to cash at close to their book values. A company with a Quick Ratio of less than 1 cannot currently pay back its current liabilities. Note that Inventory is excluded from the sum of assets in the Quick Ratio, but included in the Current Ratio. Ratios are tests of viability for business entities but do not give a complete picture of the business' health. If a business has large amounts in Accounts Receivable which are due for payment after a long period (say 120 days), and essential business expenses and Accounts Payable due for immediate payment, the Quick Ratio may look healthy when the business is actually about to run out of cash. In contrast, if the business has negotiated fast payment or cash from customers, and long terms from suppliers, it may have a very low Quick Ratio and yet be very healthy. Quick Ratio: Quick ratio= In 2011- 2012 Ratio is=0.593 In 2010- 2011 Ratio is=0.6457 Decision: The quick ratio if Jamuna Oil Company in 2011-12 is 0.593 and 2010-11 is 0.6457. Usually a quick ratio of1 or getter is recommended, so it is unacceptable. Figure: 0.56 0.58 0.6 0.62 0.64 0.66 Quick Ratio Quick Ratio 2011-12 2010-11
- 3. Inventory Turnover: In accounting, the Inventory turnover is a measure of the number of times inventory is sold or used in a time period such as a year. The equation for inventory turnover equals the Cost of goods sold divided by the average inventory. Inventory turnover is also known as inventory turns, stockturn, stock turns, turns, and stock turnover. Inventory turnover is the ratio of cost of goods sold by a business to its average inventory during a given accounting period. It is an activity ratio measuring the number of times per period, a business sells and replaces its entire batch of inventory again. Inventory Turnover: Inventory Turnover= In 2011- 2012 Ratio is=0.2092 In 2010- 2011 Ratio is=0.1777 Decision: The inventory turnover of Jamuna oil company ratio in 2011-12 is 0.2092 and 2010-11 is 0.1777. Figure: 0.16 0.165 0.17 0.175 0.18 0.185 0.19 0.195 0.2 0.205 0.21 0.215 Inventory Turn Over Inventory turnover 2011-12 2010-2011
- 4. Average Collection Period: The average collection period is the average number of days between 1) the date that a credit sale is made, and 2) the date that the money is received from the customer. The average collection period is also referred to as the days’ sales in accounts receivable. The average collection period can be calculated as follows: 365 days in a year divided by the accounts receivable turnover ratio. Assuming that a company has an accounts receivable turnover ratio of 10 times per year, the average collection period is 36.5 days (365 divided by 10). Average Collection Period: Average collection period= In 2011- 2012 Ratio is=126.98 In 2010- 2011 Ratio is=141.02 Decision: The Average collection period of jamunaOil Company 2011-12 is 126.98 and 2010-11 is 141.02.It extends 60 days credit terms to customers and average collection of period 126.98days in 2011-12 and 141.02 days in 2010-11 which is unacceptable. 115 120 125 130 135 140 145 ACP Average Collection Period 2011-12 2010-11
- 5. Average Payment Period:The average payment period (APP) is defined as the number of days a company takes to pay off credit purchases. It is calculated as accounts payable / (total annual purchases / 360). As the average payment period increases, cash should increase as well, but working capital remains the same. Most companies try to decrease the average payment period to keep their larger suppliers happy and possibly take advantage of trade discounts. Since the average payment period does not affect working capital, APP typically has little or no effect on the valuation of a company or on a merger or acquisition. Recent economic trends have lead to the average APP increasing because of the typical trickle-down effect of payments. Average Payment Period: Average Payment period= In 2011- 2012 Ratio is=3929.55 In 2010- 2011 Ratio is=2821.93 Decision: The average payment period of JamunaOil Company in 2011-12 is 3929.55 and in 2010-11 is 2821.93. Figure: 0 500 1000 1500 2000 2500 3000 3500 4000 4500 APP Average Payment 2011-2012 2010-11
- 6. Total asset turnover:Asset turnover is a financial ratio that measures the efficiency of a company's use of its assets in generating sales revenue or sales income to the company. Companies with low profit margins tend to have high asset turnover, while those with high profit margins have low asset turnover. Companies in the retail industry tend to have a very high turnover ratio due mainly to cutthroat and competitive pricing. Total asset turnover: Total asset turnover: = In 2011- 2012 Ratio is=0.4563 In 2010- 2011 Ratio is=0.4176 Decision: The total asset turnover ratio of JamunaOil Company is 2011-12 is 0.4563 and in 2010-11 is 0.4176. Figure: 0.39 0.4 0.41 0.42 0.43 0.44 0.45 0.46 Category 1 Total asset turnover 2011-12 2010-2011
- 7. Debt Ratio:Debt Ratio is a financial ratio that indicates the percentage of a company's assets that are provided via debt. It is the ratio of total debt (the sum of current liabilities and long-term liabilities) and total assets (the sum of current assets, fixed assets, and other assets such as 'goodwill'). Debt Ratio: Debt Ratio= In 2011- 2012 Ratio is=3.07 In 2010- 2011 Ratio is=36.29 Decision: Debt ratio of Jamuna oil Company in 2011-12 is 3.07 and 2010-11 is 36.29. Figure: 0 5 10 15 20 25 30 35 40 Category 1 Debt ratio 2011-12 2010-11
- 8. Gross profit margin: A financial metric used to assess a firm's financial health by revealing the proportion of money left over from revenues after accounting for the cost of goods sold. Gross profit margin serves as the source for paying additional expenses and future savings. Gross profit margin: Gross profit margin = In 2011- 2012 Ratio is=0.7554 In 2010- 2011 Ratio is=0.5195 Decision: The gross profit margin of JamunaOil Company in 2011-12 is 0.7554 and in 2010-11 is 0.5195. Figure: 0 0.1 0.2 0.3 0.4 0.5 0.6 0.7 0.8 Category 1 Gross Profit Margin 2011-12 2010-2011
- 9. Operating profit margin:Operating income is often called earnings before income and taxes or EBIT. EBIT is the income that is left, on the income statement, after all operating costs and overhead, such as selling costs and administration expenses, along with cost of goods sold, are subtracted out. Operating profit margin: Operating profit margin = In 2011- 2012 Ratio is=0.6835 In 2010- 2011 Ratio is=0.5452 Decision: The Operating Profit margin in 2011-12 is 0.6835 and in 2010-11 is 0.5452. Figure: 0 0.1 0.2 0.3 0.4 0.5 0.6 0.7 0.8 Category 1 operating profit margin 2011-12 2010-11
- 10. Net profit margin:Net profit margin is the percentage of revenue remaining after all operating expenses, interest, taxes and preferred stock dividends (but not common stock dividends) have been deducted from a company's total revenue. Net profit margin: Net profit margin = In 2011- 2012 Ratio is=0.0112 In 2010- 2011 Ratio is=0.0268 Decision: The Net profit margin in 2011-12 is 0.0112 and 2010-11 is 0.0268. Figure: 0 0.005 0.01 0.015 0.02 0.025 0.03 Category 1 net profit margin 2011-12 2010-2011
- 11. Earnings per share (EPS):The portion of a company's profit allocated to each outstanding share of common stock. Earnings per share serves as an indicator of a company's profitability. Earnings per share (EPS): Earnings per share (EPS) = In 2011- 2012 Ratio is=29.62 In 2010- 2011 Ratio is=14.45 Decision: The EPS of Jamuna Oil Company in 2011-12 is 29.62 and in 2010-11 is 14.45. Figure: 0 5 10 15 20 25 30 35 Category 1 EPS 2011-12 2010-11
- 12. Return on total assets: A ratio that measures a company's earnings before interest and taxes (EBIT) against its total net assets. The ratio is considered an indicator of how effectively a company is using its assets to generate earnings before contractual obligations must be paid. Return on total assets = In 2011- 2012 Ratio is=0.0051 In 2010- 2011 Ratio is=0.0112 Decision: The Return on total assets of Jamuna Oil Company in 2011-12 is 0.0051 and in 2010-11 is 0.0112. Figure: 0 0.002 0.004 0.006 0.008 0.01 0.012 Category 1 Return on total assets 2011-12 2010-11