![834 Z. Sˇpitalskyy, T. Bleha
material deformation. The interlamellar phase is disor-
dered even in highly oriented polymers: chains are not in
crystallographic registry and contain many conformatio-
nals defects. It is a common belief that the kink defect, a
three-bond sequence g+
tg–
in poly(methylene) segments
with two coupled gauche bonds of opposite orientations, is
best suited to be accommodated into the interlamellar
phase.
Conformational statistics of fairly extended tie chains
in the highly oriented semicrystalline polymers should
differ from that used in treatments of dilute solution or
melt properties of polymers. For example, the stretching
of tie chains involving numerous conformational defects
may well be controlled by internal energetics rather than
by conventional entropy processes operating in rubber-
like elasticity. In the usual statistical treatment of coil
elasticity, the configuration free energy A averaged over
all available conformations is evaluated and the statistical
retractive force f is calculated. In contrast, in stretching of
bridging chains the main attention is focused on the
energy-elastic deformation; the static energy of the back-
bone deformation of individual conformers stretched by
an external axial force F is evaluated.
Energetics of axial mechanical loading of highly
extended chains was first examined by Kausch for models
of poly(methylene) (PM) and polyamide.[1, 2]
Kausch cal-
culated in an approximate way the free energy of the PM
segments containing the kink defects as a function of their
length R.[1]
By stretching of the segments the energy elastic
forces arose and smooth transitions to more extended con-
formations occurred until all conformational defects were
eliminated. This approach was later refined by using the
molecular mechanics (force-field) calculations to estimate
the deformation potential in the single-defect chains.[3–7]
Calculations have shown that the transition of a defect into
a more extended conformation proceeds by an abrupt
change of the deformation potential.[3–6]
A flip-flop inter-
conversion of the torsional angles within a defect brings
about the change from the shorter (kink) into the longer
(all-trans) state. For chains containing the single-kink or
jog defects the stored elastic energy was calculated.[3–5]
It
was emphasised that all valence parameters in the molecu-
lar backbone, i.e., torsional angles bi, bond angles hi and
bond lengths ri contribute to the overall chain strain e.
Hookean behaviour was found on stretching of defect
chains and the longitudinal Young’s modulus E was evalu-
ated.[3–5]
Experimentally the gauche–trans conformational
transitions are well documented, mainly from the mea-
surements of IR spectra during the tensile drawing of syn-
thetic polymers.[8, 9]
In biopolymers the related transitions
between compact and unfolded domains were recently
observed by the stretching of macromolecules using new
highly sensitive single-molecule techniques.[10, 11]
In the present paper the deformation energetics of
highly extended PM bridges containing several confor-
mational defects is examined as a continuation of pre-
vious single-defect studies.[3–6]
The deformation potential
U(R) and the force–length function F(R) at uniaxial
stretching of defect chains are determined by the molecu-
lar mechanics calculations. It was found that F(R) curves
feature sudden jumps in force, which in the case of multi-
defect chains result in a sawtooth-like profile of the F(R)
curve. The conditions are analysed under which the saw-
tooth-like pattern of the F(R) curve can be observed in
mechanochemistry of single-molecule polymer bridges.
Method
The potential energy of stretched molecules was calcu-
lated by the Allinger MM+ molecular-mechanics
method.[12]
In the method the total static potential energy
of a molecule U is expressed as the sum of several contri-
butions
U = Ur + Uh + Ub + UvdW (1)
where the terms Ur and Uh represent the bond length and
bond angle deformation, respectively, Ub is the inherent
ethane-like torsional potential respecting the cosine type
periodicity of torsion angle b. The term UvdW is a summa-
tion of all non-bonded pair interactions in the molecule.
The individual energy terms in MM+ methods are
expressed by simple analytical functions involving
numerous adjustable parameters. The parameters, specific
for a given class of compounds, were determined by fit-
ting an extensive set of experimental data and optimised
to give the best performance of the method.[12]
For long-
chain alkanes the MM+ method provides a reliable pre-
diction of structural and thermodynamic data at ambient
temperature.[12, 13]
The PM tie molecules were modelled by eicosane with
20 carbon atoms in the backbone. Some calculations were
performed also for shorter and longer alkanes, between
C10 and C40. The highly, but not fully, extended struc-
tures comprise just a small fraction from a large number
of conformers available for the C20 chain. Some repre-
sentative structures of this category containing several
defects and examined in the present study are listed in
Table 1.
The distance of terminal carbon atoms C1–C20 in
eicosane was regarded as the length of a molecule, R. A
molecule was stretched by a gradual increase in R. Hence,
the (implicit) deformation force F is collinear with the
vector of the end-to-end distance R. The energy of a
molecule almost rigidly constrained at a given R is opti-
mised by the Polak–Ribiere (conjugate gradient) algo-
rithm. For a given defect molecule restrained to the
length R optimisation yields the equilibrium static energy
U and the geometry parameters such as torsional angles
bi, bond angles hi and bond lengths ri.](data:image/gif;base64,R0lGODlhAQABAIAAAAAAAP///yH5BAEAAAAALAAAAAABAAEAAAIBRAA7)
Recomendados
Mais conteúdo relacionado
Mais procurados
Mais procurados (7)
Destaque
Destaque (13)
Semelhante a MTS2001-10-833
Semelhante a MTS2001-10-833 (20)
MTS2001-10-833
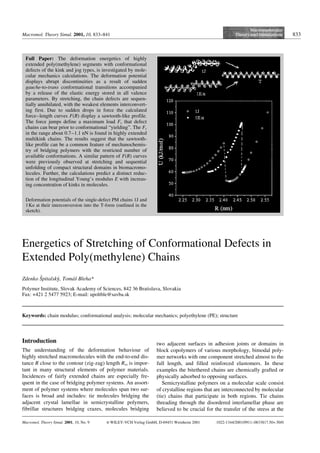
- 1. Macromol. Theory Simul. 2001, 10, 833–841 833 Energetics of Stretching of Conformational Defects in Extended Poly(methylene) Chains Zdenko Sˇpitalskyy, Tomµsˇ Bleha* Polymer Institute, Slovak Academy of Sciences, 842 36 Bratislava, Slovakia Fax: +421 2 5477 5923; E-mail: upoltble@savba.sk Keywords: chain modulus; conformational analysis; molecular mechanics; polyethylene (PE); structure Introduction The understanding of the deformation behaviour of highly stretched macromolecules with the end-to-end dis- tance R close to the contour (zig-zag) length Rzz is impor- tant in many structural elements of polymer materials. Incidences of fairly extended chains are especially fre- quent in the case of bridging polymer systems. An assort- ment of polymer systems where molecules span two sur- faces is broad and includes: tie molecules bridging the adjacent crystal lamellae in semicrystalline polymers, fibrillar structures bridging crazes, molecules bridging two adjacent surfaces in adhesion joints or domains in block copolymers of various morphology, bimodal poly- mer networks with one component stretched almost to the full length, and filled reinforced elastomers. In these examples the bitethered chains are chemically grafted or physically adsorbed to opposing surfaces. Semicrystalline polymers on a molecular scale consist of crystalline regions that are interconnected by molecular (tie) chains that participate in both regions. Tie chains threading through the disordered interlamellar phase are believed to be crucial for the transfer of the stress at the Full Paper: The deformation energetics of highly extended poly(methylene) segments with conformational defects of the kink and jog types, is investigated by mole- cular mechanics calculations. The deformation potential displays abrupt discontinuities as a result of sudden gauche-to-trans conformational transitions accompanied by a release of the elastic energy stored in all valence parameters. By stretching, the chain defects are sequen- tially annihilated, with the weakest elements interconvert- ing first. Due to sudden drops in force the calculated force–length curves F(R) display a sawtooth-like profile. The force jumps define a maximum load Fc that defect chains can bear prior to conformational “yielding”. The Fc in the range about 0.7–1.1 nN is found in highly extended multikink chains. The results suggest that the sawtooth- like profile can be a common feature of mechanochemis- try of bridging polymers with the restricted number of available conformations. A similar pattern of F(R) curves were previously observed at stretching and sequential unfolding of compact structural domains in biomacromo- lecules. Further, the calculations predict a distinct reduc- tion of the longitudinal Young’s modulus E with increas- ing concentration of kinks in molecules. Macromol. Theory Simul. 2001, 10, No. 9 i WILEY-VCH Verlag GmbH, D-69451 Weinheim 2001 1022-1344/2001/0911–0833$17.50+.50/0 Deformation potentials of the single-defect PM chains 1J and 1Ka at their interconversion into the T-form (outlined in the sketch).
- 2. 834 Z. Sˇpitalskyy, T. Bleha material deformation. The interlamellar phase is disor- dered even in highly oriented polymers: chains are not in crystallographic registry and contain many conformatio- nals defects. It is a common belief that the kink defect, a three-bond sequence g+ tg– in poly(methylene) segments with two coupled gauche bonds of opposite orientations, is best suited to be accommodated into the interlamellar phase. Conformational statistics of fairly extended tie chains in the highly oriented semicrystalline polymers should differ from that used in treatments of dilute solution or melt properties of polymers. For example, the stretching of tie chains involving numerous conformational defects may well be controlled by internal energetics rather than by conventional entropy processes operating in rubber- like elasticity. In the usual statistical treatment of coil elasticity, the configuration free energy A averaged over all available conformations is evaluated and the statistical retractive force f is calculated. In contrast, in stretching of bridging chains the main attention is focused on the energy-elastic deformation; the static energy of the back- bone deformation of individual conformers stretched by an external axial force F is evaluated. Energetics of axial mechanical loading of highly extended chains was first examined by Kausch for models of poly(methylene) (PM) and polyamide.[1, 2] Kausch cal- culated in an approximate way the free energy of the PM segments containing the kink defects as a function of their length R.[1] By stretching of the segments the energy elastic forces arose and smooth transitions to more extended con- formations occurred until all conformational defects were eliminated. This approach was later refined by using the molecular mechanics (force-field) calculations to estimate the deformation potential in the single-defect chains.[3–7] Calculations have shown that the transition of a defect into a more extended conformation proceeds by an abrupt change of the deformation potential.[3–6] A flip-flop inter- conversion of the torsional angles within a defect brings about the change from the shorter (kink) into the longer (all-trans) state. For chains containing the single-kink or jog defects the stored elastic energy was calculated.[3–5] It was emphasised that all valence parameters in the molecu- lar backbone, i.e., torsional angles bi, bond angles hi and bond lengths ri contribute to the overall chain strain e. Hookean behaviour was found on stretching of defect chains and the longitudinal Young’s modulus E was evalu- ated.[3–5] Experimentally the gauche–trans conformational transitions are well documented, mainly from the mea- surements of IR spectra during the tensile drawing of syn- thetic polymers.[8, 9] In biopolymers the related transitions between compact and unfolded domains were recently observed by the stretching of macromolecules using new highly sensitive single-molecule techniques.[10, 11] In the present paper the deformation energetics of highly extended PM bridges containing several confor- mational defects is examined as a continuation of pre- vious single-defect studies.[3–6] The deformation potential U(R) and the force–length function F(R) at uniaxial stretching of defect chains are determined by the molecu- lar mechanics calculations. It was found that F(R) curves feature sudden jumps in force, which in the case of multi- defect chains result in a sawtooth-like profile of the F(R) curve. The conditions are analysed under which the saw- tooth-like pattern of the F(R) curve can be observed in mechanochemistry of single-molecule polymer bridges. Method The potential energy of stretched molecules was calcu- lated by the Allinger MM+ molecular-mechanics method.[12] In the method the total static potential energy of a molecule U is expressed as the sum of several contri- butions U = Ur + Uh + Ub + UvdW (1) where the terms Ur and Uh represent the bond length and bond angle deformation, respectively, Ub is the inherent ethane-like torsional potential respecting the cosine type periodicity of torsion angle b. The term UvdW is a summa- tion of all non-bonded pair interactions in the molecule. The individual energy terms in MM+ methods are expressed by simple analytical functions involving numerous adjustable parameters. The parameters, specific for a given class of compounds, were determined by fit- ting an extensive set of experimental data and optimised to give the best performance of the method.[12] For long- chain alkanes the MM+ method provides a reliable pre- diction of structural and thermodynamic data at ambient temperature.[12, 13] The PM tie molecules were modelled by eicosane with 20 carbon atoms in the backbone. Some calculations were performed also for shorter and longer alkanes, between C10 and C40. The highly, but not fully, extended struc- tures comprise just a small fraction from a large number of conformers available for the C20 chain. Some repre- sentative structures of this category containing several defects and examined in the present study are listed in Table 1. The distance of terminal carbon atoms C1–C20 in eicosane was regarded as the length of a molecule, R. A molecule was stretched by a gradual increase in R. Hence, the (implicit) deformation force F is collinear with the vector of the end-to-end distance R. The energy of a molecule almost rigidly constrained at a given R is opti- mised by the Polak–Ribiere (conjugate gradient) algo- rithm. For a given defect molecule restrained to the length R optimisation yields the equilibrium static energy U and the geometry parameters such as torsional angles bi, bond angles hi and bond lengths ri.
- 3. Energetics of Stretching of Conformational Defects in Extended Poly(methylene) Chains 835 Results and Discussion Some of the investigated highly extended PM chains con- taining the conformational defects are itemised in Table 1. The molecules involving n three-bond sequences g+ tg– are designated as nK. In some defects, two variants are considered, denoted as a or b and a or b and differing in the position of kinks within the molecule or in the reverse order (tail-to-tail instead of head-to-tail) arrangements of kinks in the chain backbone. The five-bond defects, in which two coupled gauche bonds of opposite orientation, are separated by three trans bonds are denoted as jogs (J). The 2EG chain involves an all-trans segment with two gauche terminal bonds. The all-trans zig-zag chain, denoted as T, serves as a reference. An insertion of the conformational defects into the T- form decreases the length and increases the potential energy of a molecule. Shortening of a molecule, expressed relative to the length of the T-form Rzz = 2.422 nm (contour length), is given in Table 1 either by the difference DR = Rzz – Rd (2) or by the ratio x = Rd/Rzz (3) where Rd is the length of a defect molecule. Due to corre- lated gauche pairs assumed in the defects, all chains investigated are highly extended, with the ratio x A 0.84. The shortening of a chain DR due to an introduction of defects is not strictly additive but depends on the position of defects within the chains and/or on their head/tail orientation. The data in Table 1 give approximately 0.087 nm for the mean incremental shortening of a mole- cule per kink defect. A much higher value DR = (2/ 3)1/2 rCC = 0.125 nm was deduced by an assumption of the rigid-bond angles and bond lengths in the kinked chains.[1] The potential energy of a defect Ud in Table 1 is expressed relative to the energy of the T-form (51.79 kJ N mol–1 ) and represents the static conformational energy at 258C without the vibration contributions. The conformational energy in multikink chains is closely additive, with an increment of about 8.1 kJ N mol–1 per kink. The increment is reduced to about 7.4 kJ N mol–1 by a presence of a longer sequence of trans bonds between a pair of coupled gauche bonds, such as in the jogs or in the EG defect. Thus, the jog-containing molecules are slightly more stable than the corresponding kink-contain- ing molecules (Table 1). The energy increment in jogs is about twice the gauche–trans conformational energy dif- ference DUg predicted in n-alkanes by the MM+ method.[12] Deformation Potential U(R) of the Defect Chains The potential energy function U(R) of molecules contain- ing a single kink or jog defects is shown in Figure 1. By axial stretching of a defect chain the static energy is mod- ified by the force–length (elastic) energy term that is always positive. At first, the energy of a defect molecule increases with R, or with strain e = (R–Rd)/Rd, then at some critical strain ec, an abrupt decrease of the energy is observed: the defect undergoes the transition into the T- form (Figure 1). At critical strain ec the length of stretched defect molecules becomes comparable to the length of the T-form. In other words, the shortening of a chain due to an introduction of a defect, DR, is compensated by straining of a defect molecule. The conservation of the Table 1. Structural, energy and mechanical parameters of defect chains. Defect Sequence DR 10À10 m x DUd kJ N molÀ1 Ulib kJ N molÀ1 F1 10À10 NaÞ E GPa E/ET T ttttttttttttttttt – 1.000 0.0b) – 3.16 175.4 1.00 1Ka tttttttg+ tg– ttttttt 0.782 0.968 8.11 41.65 2.18 121.1 0.69 1Kb ttg+ tg– tttttttttttt 0.937 0.961 8.13 36.51 1.76 98.0 0.56 2Ka ttg+ tg– tttttttg+ tg– tt 1.643 0.932 16.22 71.51 1.58 88.0 0.50 2Kb ttg+ tg– tttttttg– tg+ tt 1.741 0.928 16.22 72.35 1.40 77.8 0.44 3Ka ttg+ tg– ttg+ tg– ttg+ tg– tt 2.594 0.893 24.07 72.61 1.06 59.1 0.34 3Kb g+ tg– ttttg– tg+ ttttg+ tg– 2.576 0.894 24.04 74.98c) 1.12 62.3 0.36 4K g+ tg– ttg+ tg– tg+ tg– ttg+ tg– 3.692 0.848 32.80 56.39d) 0.69 38.1 0.22 2EG g+ tttttttttttttttg– 1.739 0.928 7.35 31.39 0.95 52.8 0.30 1J ttttttg+ tttg– tttttt 1.663 0.931 7.45 31.99 0.87 48.1 0.27 2J g+ tttg– tttttttg+ tttg– 2.584 0.893 14.83 45.89e) 0.89 49.7 0.28 a) The force needed to bring about a 1% elongation. b) Static potential energy U = 51.79 kJ N mol–1 . c) For transition 3Kb e 1Ka. d) 4K e 3Kb. e) 2J e 2EG.
- 4. 836 Z. Sˇpitalskyy, T. Bleha deformed kink or jog, destabilised by the accumulated elastic energy Uaccu, is no longer favourable. A transition occurs from a hypersurface of the deformed defect into a hypersurface of the T-form and the accumulated energy is released. Two torsional angles in the both defects in Figure 1 act in a concerted way: at first their values con- tinuously change by about 308 from the gauche equili- brium values, then in the vicinity of the transition point they discontinuously change into 1808. The resulting fully extended zig-zag with a relative static energy Ud = 0 and length Rzz undergoes further energy elastic deforma- tion through ri and hi variables. The energy Ulib liberated at an abrupt transition in Figure 1 is equal to the sum of the accumulated energy Uaccu and the difference of the static energies of defects DUd. The results shown in Figure 1 fully endorse the prev- ious findings[3–5] concerning the deformation of similar single-defect PM chains obtained by an alternative ver- sion of the molecular mechanics method.[14] As regards the other single-defect chains in Table 1, the U(R) poten- tial of the EG defect very closely resembles the 1J defect curve in Figure 1. However, location of a kink within the chain has some influence on the U(R) potentials: less energy is accumulated (and liberated) in a 1Kb defect than in a 1Ka defect (Table 1). The deformation potentials U(R) of molecules invol- ving the two defects again display the energy discontinu- ities (Figure 2). A difference is apparent, however, between the behaviour of the kink and jog defects. The double-kink structure is converted by stretching directly into the T-form. In this case, the four gauche torsional angles alter in a concerted way, at first continuously, and then, by an abrupt flip-flop transition into 1808. In con- trast, the double-jog molecule is converted at first into the 2EG defect, i.e., two gauche bonds are annihilated, and subsequently, the transition into the T-form takes place. The U(R) potential of the 2Kb molecule, exhibiting a tail-to-tail orientation of the defects in a molecule, is almost identical to that in Figure 2 for the 2Ka defect molecule. Stretching of a three-kink chain (Figure 3) shows a combined behaviour: the 3Ka defect is interconverted in the sequence 3K e1K e T, i.e., at first into the 1K defect (a two-kink annihilation) and subsequently trans- formed into the T-form (a one-kink annihilation). The data in Figure 3 confirm that the path followed by inter- conversions is independent of the “stretching history”. The stretching of an “intermediate” 1K defect in the above sequence follows the same U(R) potential curve as the stretching of the monokink 1Ka. The deformation potential for the 3Kb defect with a head-tail-head orienta- tion of the kink defects in a molecule is almost identical to that shown in Figure 3 for the 3Ka molecule. Figure 1. Deformation potentials of the single-defect PM chains 1J and 1Ka at their interconversion into the T-form (out- lined in the sketch). Figure 2. Deformation potentials of the double-kink chain 2Ka and double-jog 2J defect chains. The interconversion of the latter proceeds via the 2EG intermediate (outlined in the sketch).
- 5. Energetics of Stretching of Conformational Defects in Extended Poly(methylene) Chains 837 An increase of the potential energy U(R) in Figure 1–3 results from the displacement of atoms in the chain skele- ton from their equilibrium positions. It can be resolved into the energy terms due to changes in torsional angles bi, bond angles hi and bond lengths ri. All three types of variables also contribute to the overall chain strain e = eb + eh + er (4) In this sum a leading contribution usually draws from the “soft” torsional term, however, an involvement of the other two terms eh and er is essential. The change of the ”hard” parameters, ri and hi, with deformation is espe- cially notable within conformational defects or in their close vicinity.[15] As an illustration, typical changes in the valence geometry at the first (g+ ) bond in kink defects can be mentioned. By stretching of a molecule to a critical strain the length of this CC bond changes from 153.7 pm to 155.2 pm and the corresponding CCC bond angle from 113.88 to 116.48. After the transition near-equilibrium bond lengths and bond angles are regained, in contrast to the irreversible change of the defect torsional angles to 1808. Apart from defects, the large amount of elastic energy was found to also be stored in terminal bonds. The distribution of the stored energy along the PM molecules enables the location of the weak points most vulnerable to a bond breaking by tensile loading.[15] The related results were recently presented for a molecule involving a knot formed by adding an appropriate set of gauche defects to a PM chain.[16] It was found that the large amount of stored energy is located on the bonds at the entrance and exits points of the knot. The presence of the knot weakens the chain in which it is tied and the mole- cule breaks at a point just outside of the knot. An abrupt transitions in energy in Figure 1–3 should be positioned close to the point when shortening of a chain due to a defect presence, DR, is compensated by the elongation of a defect molecule. The jog defect transi- tions faithfully follow this rule. However, in some kink chains an “oversaturation” in the energy of the defect chain is observed; transitions are overdue and occur above the energy minimum to an ascending part of the U(R) curve. In general, the conformational preferences in a stretched defect molecule are determined by both the con- formational energy Ud (ignoring the entropy factors) and its length R (conformations with the larger R are favoured). Figure 1–3 show that in PM-like chains both factors operate in the same direction: the trans conforma- tions are longer and of lower energy than the gauche con- formations. However, the energy and length factors can counteract in some polymers. For example in polyoxy- methylene (POM) and related molecules with an acetal segment the gauche state is favoured by having energy above the trans state due to the anomeric effect.[17] Thus, stretching of the macromolecule favours the longer but less stable trans conformers. The analogous counterba- lancing factors operate at stretching of stable helical con- formations such as a-helix in proteins. Force–Length Relationships Only the right-hand side of approximately parabolic deformation potential U(R) is relevant for description of stretching of defect chains. The computed deformation potentials U(R) for defect chains from Table 1 were fitted by a polynomial function. The quadratic function U = Ud + 0.5kp (R – Rd)2 (5) was found a sufficient approximation in a good number of cases. Differentiation according to R of the fitted deformation potentials U(R) yields the force–length functions F(R), which again exhibit sudden jumps. As an example, the F(R) functions of the single and double defect chains are presented in Figure 4, which are deduced from the poten- tials U(R) shown in Figure 1 and 2. The positive forces are usually observed, corresponding to the ascending (right-hand) part of the U(R) curves, if a discontinuity in the differentiation of U(R) function at the transition point Figure 3. Deformation potentials of the defect PM chains with one, two and three kinks.
- 6. 838 Z. Sˇpitalskyy, T. Bleha is disregarded. A small negative force (illustrated by the 1J jog in Figure 4) is generated in cases when the transi- tions take place to the decreasing part of the U(R) curve. The individual portions of F(R) curves are nearly linear. Some deviations from linearity appear in the transition region, especially for jogs. The force at the transition point Fc, represents a maximum load which a chain can bear prior to “yielding” by a conformational interconver- sion. In Figure 4 the maximum loads are around 1.1 nN for the kinks and around 0.7 nN for jogs. The force–length functions of all multikink chains investigated are presented in Figure 5. Depending on the number of defects, the F(R) curves are comprised of sev- eral essentially linear segments separated by the sudden drops in force. Superimposing of individual F–R func- tions generates a distinct sawtooth-like pattern in the con- solidated F(R) curve. The amplitude of the pattern, i.e., the maximum force which the chain can bear before a flip-flop jump occurs, gradually increases from about 0.7 to about 1.1 nN. Hence, the chain defects are sequentially annihilated by stretching, with the weakest elements yielding first. Interestingly, the conformational energy differences between static energy of defects DUd do not transfer into the F(R) curves. Regardless whether the energy DUd is positive or negative, i.e., whether the defect energy minima are sequentially decreasing (like in PM) or increasing (like in POM) on stretching, the same F(R) curve would result. The linear segments of F(R) curves in Figure 4 and 5 become steeper after each elimination of the defect. A convenient measure of the stiffness of the defect chains is the force F1 needed to extend a defect chain by 1%. For the defects investigated the force F1 varies between 69 pN for the 4K chain and 316 pN for the energy elastic deformation of the zig-zag T-form (Table 1). Alterna- tively, the defect chain loading can be described by the stress–strain function r(R), a usual representation of the static mechanical properties of polymer materials. In cal- culations of the axial chain stress r = F/A the chain cross- section A = 0.18 nm2 was employed. This value of A cor- responds to the zig-zag PM chains packed in an orthor- hombic crystal. Again, stress–strain curves computed for the multikink chains exhibit multiple drops in force. The initial parts of these curves (up to the first transition) are shown in Figure 6. From their slopes at e = 0 the longitu- dinal Young’s moduli E of PM chains are determined. Almost perfect Hookean behaviour is observed in the whole range of strain. The maximum stress the multikink molecules can bear prior their first yielding by the transi- tion varies from about 4 to over 6 GPa. In the T-form maximum stress achieves a much higher value, given by the tensile strength of a chain (stress at break). Quite substantial critical strains, ec S 0.05, are observed in Figure 6 on stretching of the 3K and 4K chains. A major contribution to ec derives from the con- certed transitions of four gauche torsional angles into the trans state, which contribute to the eb term. Strain of about 0.05 is usually considered as a limit of reliability of Figure 4. The force–length functions for the defect chains with single and double kinks and jogs. Figure 5. The force–length functions F(R) for PM chains involving several kinks: (D) 4K, (+) 3K, (F) 2Ka, (9) 1Ka, (f) T. In the insert suggested horizontal jumps in the length appropri- ate to the R(F) function are denoted by a dashed line and the “envelope” force–length curve of unresolved jumps, either in force or in length, is denoted by a solid line.
- 7. Energetics of Stretching of Conformational Defects in Extended Poly(methylene) Chains 839 potentials in the force–field methods. The bond angle and bond length strains, er and eh, in Figure 6 do not exceed this limit. Actually, since such a ceiling on strain concerns each elementary interconversion step only, in multikink chains substantially higher overall molecular strains can safely be calculated. The initial defect chain moduli E determined as described are summarised in Table 1. A marked reduction of the longitudinal Young’s modulus E with the concen- tration of kinks and jogs in molecules is evident. The MM+ method predicts the modulus ET = 175.4 GPa for the reference T-form of eicosane. This value can be slightly enhanced by an increase of the model chain length. Theoretical studies on the ultimate Young's modu- lus of a PM chain using molecular mechanics, semi- empirical and ab initio methods resulted in a wide variety of values covering the approximate range 170– 400 GPa.[1, 5, 7, 14, 18] The above value of ET predicted by the MM+ method is too low in comparison to the quantum- chemical estimates of over 300 GPa.[18] Apparently, the previous observations[5, 7] that force–field methods tend to provide low values of the ET modulus are endorsed. Since we are interested mainly in the influence of the defects on the chain modulus, a relative measure, the ratio E/ET (Table 1) is utilised in further discussion instead of the absolute values. Introduction of a kink defect reduces the modulus to about 60% of ET depending on the position of a defect in a chain. In the two-kink and three-kink chains the chain modulus is reduced to about 47% and 35%, respectively. Evidently, molecules become less stiff with an increase of the number of kinks in the chains. How- ever, the reduction of the chain modulus E with an increase of concentration of kinks is much slower than originally estimated.[1] It is seen from the E/ET values that the jog defects represent mechanically softer elements than kink defects. Previous calculations by a different MM method pre- dicted the ratio E/ET around 0.5 in a single kink PM chain.[5] Aside from localised conformational defects, some molecular mechanical calculations were reported on the crystallographic defects.[7, 19] These defects may be involved in diffusion, translation and rotation of mole- cules inside the PM crystals. For some several six- or seven-bond defects the moduli in the range of 30–70 GPa were calculated.[19] In another set of eight defects, with the length of the defect regions up to 19 bonds, two groups of defects were distinguished: one group has mod- uli almost identical with the all-trans chain (around 177 GPa) whereas the other group has moduli by 25– 40% lower than the all-trans chain.[7] Single-Chain Mechanochemistry We should remind the reader that the force–length curves in Figure 4 and 5 represent only energy elastic loading of individual fairly extended conformers, and differ concep- tually from the statistical force f in a macromolecule. The statistical retractive force, f = dA/dR (6) where A is the Helmholtz configurational energy, is ob- tained by averaging over all the conformations of a chain. Incidentally, this statistical mechanical elastic force f can be further resolved into the entropy (usually dominant) and energy components, fS and fU, respectively.[20, 21] An observation of a sawtooth-like profile in F(R) func- tions calculated for the defect PM chains in Figure 5, sug- gests a potential universality of this pattern in mechano- chemistry of chain molecules in which conformational transitions in the chain backbone can be induced by an external force. One can presume that stretching of macro- molecules involving a severely limited number of indivi- dual conformers, such as various highly extended brid- ging chains, advances by a sequence of abrupt jumps accompanying the conformational transitions into the more extended forms. Such a mechanism of stretching should produce a sawtooth-like profile of increasing amplitude on approaching the all-trans form. In contrast, in less extended polymers, the conforma- tional space that a polymer can sample is significantly wider and a vast number of conformations undergo transi- tions at stretching almost simultaneously. Hence, it is dif- ficult here to resolve the numerous individual jumps and instead of a sawtooth-like profile, an “envelope” force– length curve with a broad plateau region would result. Although the envelope curve is an appropriate description of static loading of coiled chains, it is also drawn as an Figure 6. A portion of the stress–strain functions (up to the first transition) of the PM chains with several kink defects.
- 8. 840 Z. Sˇpitalskyy, T. Bleha illustration in Figure 5 for stretching of the multikink chains. The envelope curve features three regions: an initial linear region, an intermediate low-modulus plateau in the region of unresolved conformational transitions, and a region of the T-form deformation, starting at force about 1 nN. The recent remarkable progress in techniques of single- molecule manipulations such as AFM or optical tweezers allow mechanical experiments on individual macromole- cules to be performed[22] and thus examine the above sug- gested shapes of the F–R curves. In pioneering experi- ments[10, 11] with titin, the structural element in muscle, the eight immunoglobulin compact domains unfold on stretching and the length of the molecule increases signif- icantly. Notably, two types of force–length curves were observed on titin stretching: (a) a sawtooth pattern[10] due to sequential unfolding where the associated force jumps raise from the first through to the last peak, similarly to Figure 5 and (b) the F–R curve exhibits a plateau[11] (evo- cative of the envelope curve in Figure 5) without registra- tion of discrete conformational transition events. These differences in the shape of the observed F–R curves were ascribed to the stiffness of probes used and rationalised by a model of polymers consisting of several modules.[10] Depending on the ratio of the time scale of transitions between modules and that of the experiment the measure- ments can be performed in the nonequilibrium state and can feature the hysteresis effects. An option to observe a force–length profile resolved into individual jumps may be related to the difference between two conjugated single-chain ensembles, the R- fixed and f-fixed ensembles. The sawtooth-like profile of F(R) function in Figure 5 is obtained by using of R as the independent variable in MM+ calculations; the force F corresponding to the selected R is adjusted accordingly. An opposite selection of variables, fixation of the force F as an independent variable and adjustment of R to the pre- selected F, would results in the force–length function R(F). The interrelation of variables F and R closely resembles the pressure (P) – volume (V) relation, where R corresponds to V and F to P. Actually, in statistical mechanics of macromolecules[23] two different ensembles, strain ensemble with Helmholtz energy A and stress ensemble with Gibbs energy G = A–FR are discrimi- nated, as polymer counterparts of the constant pressure and constant volume ensembles, respectively. The MM+ techniques does not allow the calculation of the R(F) function since the energy U is optimised as a function of R but not F. However, the difference in the both types of the force–length curves, F(R) and R(F), can be elucidated by following an analogy with the exam- ination of the escape transition at compression of a poly- mer chain tethered to a surface.[24] In determination of the R(F) function, the elastic enthalpy H = U–FR serves as a counterpart of the energy U. Since dH/dR = dU/dR–F = 0 (7) both approaches should yield the equivalent form of the force–length relation, which, however, substantially dif- fer near the points of the conformational transitions. In the transition regions a jump in force at the F(R) curve should correspond to a jump in the length at the R(F) curve. The R(F) curve with jumps in lengths, indicated in an intuitive way in Figure 5, is very similar to the envel- ope F(R) curve with unresolved jumps in force. Evidently, the deformation of fairly extended chains with the conformational defects is described in a slightly different way by the F(R) and R(F) functions. Thus, the elasticity laws on the microscopic level depend on a choice of the length or the force as an independent vari- able. The distinction between the F(R) and R(F) func- tions resembles in some way the difference in modes of viscoelastic measurements, where time is an additional variable. Depending on the choice of the input and response variables in measuring stress and strain with time one can observe either creep or stress relaxation of a polymer material. Conclusions The elastic properties of highly extended bridge (tie) molecules, represented by poly(methylene) segments with the conformational defects of the kink and jog types, were examined by using molecular mechanics calcula- tions. The computations reveal that the backbone tor- sional angles, bond angles, and bond lengths store the elastic energy and contribute to the overall elongation of a molecule. On stretching of molecules the conforma- tional defects are eliminated through abrupt (instead of smooth) gauche-to-trans conformational transitions. In chains with multiple defects a co-operative flip-flop inter- conversion of several torsional angles takes place at the critical strain, and the elastic energy accumulated in a molecule is liberated. The chain defects are annihilated sequentially by stretching, with the weakest elements interconverting first. Consequently, due to sudden drops in force at transitions the calculated force–length curves F(R) display discontinuities. The maximum load Fc that defect chains can bear prior to conformational yielding increases with the chain elongation. In multidefect mole- cules the individual force jumps produce a distinct saw- tooth-like profile (instead of an ordinary smooth function) in the force–length curves. The F(R) curves with a saw- tooth pattern similar to the computed ones were measured earlier in some biomacromolecules in which compact structural domains unravel on stretching. The conditions were analysed at which a sawtooth-like profile of the F(R) function can be observed in mechanochemistry of single-molecule polymer bridges such as the interlamellar tie molecules in semicrystalline polymers. Additionally,
- 9. Energetics of Stretching of Conformational Defects in Extended Poly(methylene) Chains 841 the longitudinal Young’s moduli E of the defect chains were calculated. The calculations predict a strong reduc- tion of the chain modulus with increasing concentration of the kink defects in molecules. Acknowledgement: The research was supported in part by the Grant Agency for Science (VEGA), grant 2/7056/20. The authors gratefully acknowledge the advice of Dr. P. Cifra and Dr. P. Mach concerning the molecular-mechanics calculations. Received: May 7, 2001 Revised: August 14, 2001 [1] H. H. Kausch, “Polymer Fracture, Polymers, Properties and Applications”, Springer Verlag, Berlin 1989. [2] H. H. Kausch, in: “Failure of Plastics”, W. Brostow, R. D. Corneliussen, Eds., Hanser Publishers, Munich 1986, p. 84. [3] J. Gajdosˇ, T. Bleha, Mater. Chem. Phys. 1987, 17, 405. [4] T. Bleha, J. Gajdosˇ, Chem. Pap. 1989, 43, 325. [5] T. Bleha, J. Gajdosˇ, F. E. Karasz, Macromolecules 1990, 23, 4076. [6] R. Cook, J. Polym. Sci,. Polym. Phys. Ed. 1988, 26, 1349. [7] H. van der Werff, P. T. van Duynen, J. A. Pennings, Macromolecules 1990, 23, 2935. [8] R. P. Wool, Polym. Eng. Sci. 1980, 20, 805. [9] P. Lapersonne, D. I. Bower, I. M. Ward, Polymer 1992, 33, 1277. [10] M. Rief, J. M. Fernandez, H. E. Gaub, Phys. Rev. Lett. 1998, 81, 4764. [11] M. S. Z. Kellenmayer, S. B. Smith, H. L. Granzier, C. Bus- tamante, Science 1997, 276, 1112. [12] U. Burkert, N. L. Allinger, “Molecular mechanics”, ACS Monograph 177, American Chemical Society, Washington 1982. [13] W. J. Welsh, in: “Computational modeling of polymers”, J. Bicerano, Ed., Marcel Dekker, New York 1992, p. 1271. [14] R. P. Wool, R. S. Bretzlaff, B. Y. Li, C. H. Wang, R. H. Boyd, J. Polym. Sci., Polym. Phys. 1986, 24, 1039. [15] T. Bleha, J. Gajdosˇ, Colloid Polym. Sci. 1988, 266, 405. [16] A. M. Saitta, M. L. Klein, J. Chem. Phys. 1999, 111, 9434. [17] I. Tvaroska, T. Bleha, Chem. Papers 1985, 39, 805. [18] J. C. L. Hageman, R. J. Meier, M. Heinemann, R. A. de Groot, Macromolecules 1997, 30, 5953. [19] D. H. Reneker, J. Mazur, Polymer 1984, 25, 1549. [20] P. Cifra, T. Bleha, J. Chem. Soc. Faraday Trans. 1995, 91, 2465. [21] M. Wittkop, S. Kreitmeier, D. Göritz, J. Chem. Soc. Fara- day Trans. 1996, 92, 1375. [22] A. Janshoff, M. Neitzert, Y. Oberdorfer, H. Fuchs, Angew. Chem Int. Ed. 2000, 39, 3212. [23] P. J. Flory, “Statistical mechanics of chain molecules”, Interscience Publishers, New York 1969. [24] E. M Sevick, D. R. M. Williams, Macromolecules 1999, 32, 6841.