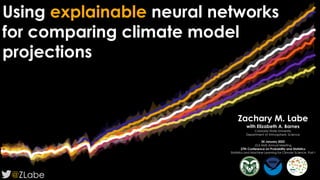
Using explainable neural networks for comparing climate model projections
•
0 gostou•53 visualizações

1. The document discusses using explainable neural networks to compare climate model projections and evaluate which climate models best match observations. 2. Temperature maps from observations are input into a neural network trained on climate model data to classify each observation year with a climate model. 3. Layer-wise relevance propagation is used to explain the neural network's classifications and identify differences between climate models, which can help evaluate models, especially in regions with known biases like the Arctic.

Recomendados
Recomendados
Mais conteúdo relacionado
Mais procurados
Mais procurados (18)
Semelhante a Using explainable neural networks for comparing climate model projections
Semelhante a Using explainable neural networks for comparing climate model projections (20)
Mais de Zachary Labe
Mais de Zachary Labe (20)
Último
Último (20)
Using explainable neural networks for comparing climate model projections
- 1. Using explainable neural networks for comparing climate model projections @ZLabe Zachary M. Labe with Elizabeth A. Barnes Colorado State University Department of Atmospheric Science 24 January 2022 J3.5 AMS Annual Meeting 27th Conference on Probability and Statistics Statistics and Machine Learning for Climate Science. Part I
- 2. THE REAL WORLD (Observations) Map of temperature
- 3. THE REAL WORLD (Observations) Anomaly is relative to 1951-1980
- 4. THE REAL WORLD (Observations) CLIMATE MODEL ENSEMBLES Range of ensembles = internal variability (noise) Mean of ensembles = forced response (climate change)
- 5. Range of ensembles = internal variability (noise) Mean of ensembles = forced response (climate change) But let’s remove climate change…
- 6. Range of ensembles = internal variability (noise) Mean of ensembles = forced response (climate change) After removing the forced response… anomalies/noise!
- 7. 2-m Temperature (°C) THERE ARE MANY CLIMATE MODEL LARGE ENSEMBLES… Annual mean 2-m temperature 7 global climate models 16 ensembles each ERA5-BE (observations)
- 8. STANDARD EVALUATION OF CLIMATE MODELS Pattern correlation RMSE EOFs Trends, anomalies, mean state Climate modes of variability
- 9. STANDARD EVALUATION OF CLIMATE MODELS Pattern correlation RMSE EOFs Trends, anomalies, mean state Climate modes of variability CORRELATION [R]
- 10. STANDARD EVALUATION OF CLIMATE MODELS Pattern correlation RMSE EOFs Trends, anomalies, mean state Climate modes of variability CORRELATION [R]
- 11. STANDARD EVALUATION OF CLIMATE MODELS Pattern correlation RMSE EOFs Trends, anomalies, mean state Climate modes of variability Negative Correlation Positive Correlation PATTERN CORRELATION – T2M
- 13. ----ANN---- 2 Hidden Layers 10 Nodes each Ridge Regularization Early Stopping TEMPERATURE We know some metadata… + What year is it? (Labe & Barnes, 2021) + Where did it come from?
- 14. TEMPERATURE We know some metadata… + What year is it? (Labe & Barnes, 2021) + Where did it come from? Train on data from the Multi-Model Large Ensemble Archive
- 15. TEMPERATURE We know some metadata… + What year is it? (Labe & Barnes, 2021) + Where did it come from? NEURAL NETWORK CLASSIFICATION TASK HIDDEN LAYERS INPUT LAYER INPUT LAYER OUTPUT LAYER HIDDEN LAYERS
- 19. LAYER-WISE RELEVANCE PROPAGATION (LRP) Volcano Great White Shark Timber Wolf Image Classification LRP https://heatmapping.org/ LRP heatmaps show regions of “relevance” that contribute to the neural network’s decision-making process for a sample belonging to a particular output category Neural Network WHY WHY WHY Backpropagation – LRP
- 20. LAYER-WISE RELEVANCE PROPAGATION (LRP) Volcano Great White Shark Timber Wolf Image Classification LRP https://heatmapping.org/ LRP heatmaps show regions of “relevance” that contribute to the neural network’s decision-making process for a sample belonging to a particular output category Neural Network WHY WHY WHY Backpropagation – LRP
- 21. LAYER-WISE RELEVANCE PROPAGATION (LRP) Volcano Great White Shark Timber Wolf Image Classification LRP https://heatmapping.org/ LRP heatmaps show regions of “relevance” that contribute to the neural network’s decision-making process for a sample belonging to a particular output category Neural Network WHY WHY WHY Backpropagation – LRP
- 22. LAYER-WISE RELEVANCE PROPAGATION (LRP) Image Classification LRP https://heatmapping.org/ NOT PERFECT Crock Pot Neural Network WHY Backpropagation – LRP
- 23. [Adapted from Adebayo et al., 2020] EXPLAINABLE AI IS NOT PERFECT THERE ARE MANY METHODS
- 24. [Adapted from Adebayo et al., 2020] THERE ARE MANY METHODS EXPLAINABLE AI IS NOT PERFECT
- 25. COMPARING CLIMATE MODELS LRP (Explainable AI) Raw data (Difference from multi-model mean) Colder Warmer High Low
- 26. COMPARING CLIMATE MODELS LRP (Explainable AI) Raw data (Difference from multi-model mean) Colder Warmer High Low
- 27. COMPARING CLIMATE MODELS LRP (Explainable AI) Raw data (Difference from multi-model mean) Colder Warmer High Low
- 28. COMPARING CLIMATE MODELS LRP (Explainable AI) Raw data (Difference from multi-model mean) Colder Warmer High Low
- 29. COMPARING CLIMATE MODELS LRP (Explainable AI) Raw data (Difference from multi-model mean) Colder Warmer High Low
- 30. COMPARING CLIMATE MODELS LRP (Explainable AI) Raw data (Difference from multi-model mean) Colder Warmer High Low
- 31. COMPARING CLIMATE MODELS LRP (Explainable AI) Raw data (Difference from multi-model mean) Colder Warmer High Low
- 32. COMPARING CLIMATE MODELS LRP (Explainable AI) Raw data (Difference from multi-model mean) Colder Warmer High Low EXPLAINABLE AI
- 33. What climate model does the neural network predict for each year of observations?
- 34. APPLYING METHODOLOGY TO THE ARCTIC
- 35. NEURAL NETWORK CLASSIFICATION TASK HIDDEN LAYERS INPUT LAYER OUTPUT LAYER TEMPERATURE MAP
- 36. COMPARING CLIMATE MODELS IN THE ARCTIC High Low RECENT ARCTIC AMPLIFICATION
- 37. High Low HISTORICAL PERIOD COMPARING CLIMATE MODELS IN THE ARCTIC
- 38. High Low DIFFERENCE IN LAYER-WISE RELEVANCE PROPAGATION COMPARING CLIMATE MODELS IN THE ARCTIC
- 39. Colder Warmer RELEVANCE DIFFERENCE [°C] EVALUATING OBSERVATIONS IN THE ARCTIC High Low
- 40. Colder Warmer RELEVANCE DIFFERENCE [°C] EVALUATING OBSERVATIONS IN THE ARCTIC REMOVE THE ANNUAL MEAN AT EACH GRID POINT High Low Colder Warmer
- 41. APPLY SOFTMAX OPERATOR IN THE OUTPUT LAYER RANK
- 42. APPLY SOFTMAX OPERATOR IN THE OUTPUT LAYER [ 0.71 ] [ 0.05 ] [ 0.01 ] [ 0.01 ] [ 0.03 ] [ 0.11 ] [ 0.08 ] RANK
- 43. APPLY SOFTMAX OPERATOR IN THE OUTPUT LAYER [ 0.71 ] [ 0.05 ] [ 0.01 ] [ 0.01 ] [ 0.03 ] [ 0.11 ] [ 0.08 ] RANK [ 1 ] [ 4 ] [ 7 ] [ 6 ] [ 5 ] [ 2 ] [ 3 ]
- 44. APPLY SOFTMAX OPERATOR IN THE OUTPUT LAYER [ 0.71 ] [ 0.05 ] [ 0.01 ] [ 0.01 ] [ 0.03 ] [ 0.11 ] [ 0.08 ] RANK [ 1 ] [ 4 ] [ 7 ] [ 6 ] [ 5 ] [ 2 ] [ 3 ] Confidence/Probability
- 45. RANKING CLIMATE MODEL PREDICTIONS FOR EACH YEAR IN OBSERVATIONS
- 46. RANKING CLIMATE MODEL PREDICTIONS FOR EACH YEAR IN OBSERVATIONS
- 47. KEY POINTS Zachary Labe zmlabe@rams.colostate.edu @ZLabe 1. Explainable neural networks can be used to identify unique differences in temperature simulated between global climate model large ensembles 2. As a method of climate model evaluation, we input maps from observations into the neural network in order to classify each year with a climate model 3. The neural network architecture can be used in regions with known large biases, such as over the Arctic, or for different methods of preprocessing climate data