SlideShare uma empresa Scribd logo
1 de 103
Baixar para ler offline
Characteristics and performance
of MVHR systems
A meta study of MVHR systems used in the
Innovate UK Building Performance Evaluation
Programme
Report authors:
Tim Sharpe
Gráinne McGill
The Mackintosh Environmental Architecture Research Unit (MEARU)
The Glasgow School of Art
Rajat Gupta
Matt Gregg
Oxford Institute for Sustainable Development (OISD)
Oxford Brookes University
Ian Mawditt
fourwalls Consultants
Characteristics and Performance of MVHR Systems: A Building Performance Evaluation Meta-Study i
Contents
Executive Summary..............................................................................1
Introduction ...................................................................................................................... 1
Characteristics.................................................................................................................. 1
Design.............................................................................................................................. 2
Performance..................................................................................................................... 2
Summary.......................................................................................................................... 3
1. Introduction.....................................................................................4
1.1. Study context .......................................................................................................... 4
1.1.1. Building performance evaluation ....................................................................... 4
1.2. Ventilation and MVHR ............................................................................................. 5
1.3. Study aims and objectives....................................................................................... 6
2. Methods and data sources.............................................................8
2.1. Dwelling selection and sample size ......................................................................... 8
2.2. Dwelling types and systems .................................................................................... 9
2.2.1. Dwelling types and data availability ................................................................... 9
2.2.2. Overview of key building characteristics............................................................ 9
2.3. Data collection methods ........................................................................................ 11
2.3.1. Assessing performance characteristics ........................................................... 11
2.3.2. In-use performance ......................................................................................... 12
2.3.3. Surveys and interviews ................................................................................... 13
2.4. Limitations of the study.......................................................................................... 13
3. Characteristics of MVHR systems...............................................15
3.1. Compliance: design stage ..................................................................................... 15
3.2. Commissioning...................................................................................................... 16
3.3. Air flow rates ......................................................................................................... 17
3.4. System balance..................................................................................................... 19
3.5. Influence of duct type ............................................................................................ 20
4. In-use performance.......................................................................22
4.1. Ventilation performance......................................................................................... 22
4.1.1. Comparative ventilation performance .............................................................. 22
4.1.2. Ventilation performance in dwellings with MVHR systems............................... 26
4.2. Comparative relative humidity levels ..................................................................... 28
4.2.1. Relative humidity in dwellings with MVHR ....................................................... 32
4.3. Comparative indoor temperatures ......................................................................... 34
4.3.1. Indoor temperatures in dwellings with MVHR .................................................. 37
Characteristics and Performance of MVHR Systems: A Building Performance Evaluation Meta-Study ii
4.4. Comparative vapour pressure levels ..................................................................... 39
4.4.1. Vapour pressure levels in MVHR dwellings ..................................................... 43
4.5. Energy use comparative analysis .......................................................................... 44
5. Feedback from design team and residents.................................47
5.1. Introduction ........................................................................................................... 47
5.2. Design and procurement ....................................................................................... 47
5.3. Construction and installation ................................................................................. 49
5.4. Handover and use................................................................................................. 52
5.5. Summary............................................................................................................... 59
6. Learning from representative case studies ................................61
6.1. Case Study 1: Typical ‘fit and forget’ example ....................................................... 61
6.1.1. Design............................................................................................................. 61
6.1.2. Construction and installation ........................................................................... 62
6.1.3. Handover and use........................................................................................... 64
6.1.4. Maintenance.................................................................................................... 64
6.1.5. Recommendations .......................................................................................... 65
6.2. Case Study 2: Consequences of system failure .................................................... 66
6.3. Case Study 3: Impact of inadequate maintenance................................................. 71
6.3.1. Design............................................................................................................. 71
6.3.2. Performance.................................................................................................... 72
6.3.3. Summary......................................................................................................... 79
7. Conclusions ..................................................................................80
7.1. Observations from the study elements .................................................................. 80
7.2. Implications for practice and policy........................................................................ 82
7.2.1. Design............................................................................................................. 82
7.2.2. Installation....................................................................................................... 82
7.2.3. Usability .......................................................................................................... 83
7.2.4. Maintenance.................................................................................................... 83
7.3. Future work ........................................................................................................... 83
8. Appendices ...................................................................................85
8.1. Appendix A: Common shortcomings of MVHR systems ........................................ 85
8.2. Appendix B: Carbon dioxide .................................................................................. 86
8.3. Appendix C: Relative Humidity .............................................................................. 92
8.4. Appendix D: Temperature ..................................................................................... 95
8.5. Appendix E: Vapour pressure................................................................................ 98
Characteristics and Performance of MVHR Systems: A Building Performance Evaluation Meta-Study 1
Executive Summary
Introduction
This meta-study was commissioned by Innovate UK as part of the Building
Performance Evaluation (BPE) Programme to provide an overview of the
performance and use of whole-house heat recovery ventilation (MVHR) systems in
domestic projects. With increasing requirements for energy reduction, the impact of
ventilation strategies has increased in importance, both in terms of energy reduction
and indoor air quality (IAQ).
The primary aims of this meta-study are to:
1. Review the characteristics of installed systems in relation to air flow, system
balance and compare to existing published guidelines, particularly those
contained in the relevant Building Regulations documents;
2. Investigate, via surveys and interviews, the reasons for selecting MVHR as a
ventilation strategy on a development and experience of MVHR systems in
practice;
3. Review available monitored data to investigate the performance of houses
with MVHR systems;
4. Determine the key features of MVHR systems with respect to the quality of
their design and installation and commissioning procedures.
Across the BPE domestic programme, a total of 85 study dwellings from 29 projects
with MVHR systems were investigated. Development sizes range from single homes
to major developments of 700+ dwellings, thus the total number of homes that the
study dwellings potentially represent is in excess of 3300. Characteristics data was
available for 51 dwellings, while consistent monitored CO2 data was available for 21
dwellings. The data used has been taken from three main sources:
1. Final versions of reports, submitted to Innovate UK, which include mandatory
elements, e.g. ventilation measurement data, installation and commissioning
reviews, contextual data in final reports, etc.;
2. Surveys and/or interviews with a selection of participating project teams
across fifteen projects;
3. The online data repository for the BPE (and other) programmes, known as
Embed (www.getembed.com). This Platform is owned and operated by the
Energy Saving Trust, whereas the BPE data within it is owned by Innovate
UK.
The dataset contains a number of limitations which are described in the report,
particularly with regard to the monitored data.
Characteristics
The review of the air flow designs showed that the majority of systems met the
minimum requirements of the building regulations. However, significant problems
were found with the commissioning, with only 16% of systems being found to have
been commissioned correctly with respect to air flow and balancing. Consequently,
the performance of the systems investigated in the BPE programme varies
significantly, with only 56% of installations meeting the design air flow value.
Similarly, 52% of systems were found to have a measured imbalance between
Characteristics and Performance of MVHR Systems: A Building Performance Evaluation Meta-Study 2
supply and extract airflow of >15%. Extracts in ‘boost’ setting from wet rooms, such
as kitchens and bathrooms were found to have a significant range, with only 44% of
kitchens meeting the minimum requirement of 13 litres per second.
A review of ductwork types revealed that the measured air flow in 88% of systems
utilising rigid ducting were equal to or greater than their design air flow values,
whereas between only 40 and 44% of systems utilising flexible ducting met their
respective design values.
Design
Due to the nature of the BPE programme, only projects with high sustainability
standards (Code for Sustainable Homes level 4, 5, Passivhaus) were funded. This
meant that the dwellings were designed to have good levels of airtightness. This is
why provision of acceptable indoor air quality was an important consideration for
installation of MVHR systems across the majority of the projects studied. In a few
cases, MVHR systems were selected to achieve Code compliance without much
understanding of required air-tightness of the building envelope or the maintenance
requirements of these systems.
Performance
Overall comparison of CO2 levels in houses with non-MVHR ventilation indicates that
average and peak CO2 levels are lower in MVHR houses, but this should be
contextualised with emerging evidence of poor performance (particularly in bedroom
spaces) of natural ventilation in airtight homes. However, peak CO2 levels were
consistently lower suggesting that, when working, mechanical systems may improve
ventilation rates.
However, a number of the MVHR houses demonstrated sub-optimal performance
and indicate that there are risks when systems do not work correctly or are not being
used. This would lead to houses being naturally ventilated, but relying entirely on
opening windows where there is no provision for background ventilation. In some
spaces where this is not possible (for example due to external factors such as noise
or security), or where there is less adaptive behaviour (for example bedrooms
overnight), very poor levels of ventilation are experienced.
The impact of MVHR on internal conditions such as relative humidity was not clear.
Within the available sample there was no obvious association with low RH, however,
this may be masked by the tendency for MVHR houses to be heated closer to
optimum temperatures. Looking at the absolute moisture content of the air also
revealed no clear trends, but some MVHR houses had high levels of moisture. What
was clear is that houses with MVHR systems tended to have more stable
environmental conditions – differences between peak and low levels of both RH and
temperature were consistently lower in the MVHR houses.
In general the energy consumption in houses with MVHR systems was lower, but
again this needs to be contextualised – 77% of the MVHR dwellings with energy data
were of Passivhaus construction, which in general have lower consumption within the
domestic sample (albeit with MVHR as a key component).
Overall the study indicates that the rationale behind the use of MVHR systems is
borne out – the rates of ventilation as evidenced very generally by CO2 levels are
better, and the energy use overall is lower. However, the study highlights the
prevalence of sub-optimal systems and the possible implications on both energy
efficiency and indoor air quality.
Characteristics and Performance of MVHR Systems: A Building Performance Evaluation Meta-Study 3
Summary
Well designed, installed, maintained and used MVHR systems are able to make
useful contributions to energy reduction and good ventilation. However, in practice
achieving all these conditions is a challenge for the industry and many of the projects
in the studies had a number of problems that would undermine these benefits.
Common problems included: insufficient system air flow and system imbalance; lack
of appropriate airtightness; poorly designed and installed ductwork; lack of occupant
handover and understanding; inadequate maintenance, in particular filter cleaning or
replacement.
In airtight homes, the importance of maintaining the ventilation provision is imperative
and the consequences of failure may be more significant, and may have detrimental
health implications for the occupants.
Key stages are improving design to avoid problems. This includes:
 Ensure that the performance requirements in terms of energy and ventilation are
clear;
 Consider design issues to ensure good airflow and to anticipate and avoid
installation problems associated with ductwork;
 Consider and design in maintenance requirements including unit location, filter
cleaning and replacement;
 Good communication of the design details with installers and commissioners in
conjunction with better quality control onsite to avoid installation defects;
 Improved handover processes and occupant guidance.
The most common problems at the installation or commissioning stages include
imbalance between supply and extract airflows (half of the projects), poor installation,
and inadequate commissioning (likely as a result of the former problems), with
systems requiring recommissioning in one-third of the projects. Other problems which
occurred include blockages or no airflow, systems difficult to commission, and fan
speeds that were too high.
In terms of operation, most interviewee dissatisfaction was with the inadequate level
of user understanding of how to operate and control the system, which suggests
insufficient training or handover. The most common operational issue was found to
be system maintenance. Without appropriate handover and training (including easy-
to-follow documentation and follow-ups), it is difficult to make occupant or housing
association-led maintenance regimes work.
Half of the projects sampled had occupants that disabled the system; the most
common reason was out of concern for the operating cost of the MVHR. Though
potentially tenuous, high cost of running the system was a common perception
among occupants.
Characteristics and Performance of MVHR Systems: A Building Performance Evaluation Meta-Study 4
1. Introduction
1.1. Study context
There is growing evidence that decarbonisation strategies aimed at the housing
sector do not always achieve intended results. This performance gap between ‘as
designed’ and ‘as built’ is increasingly well evidenced1
. To address this, Innovate UK
(formerly the Technology Strategy Board) commenced the Building Performance
Evaluation programme in 2010. This was a 4-year programme to support a range of
BPE studies across the UK in both domestic and non-domestic buildings. They
include Phase 1 studies looking at post-construction and early occupation, and
Phase 2 studies, which undertook Phase 1 evaluation but also in-use and post-
occupancy monitoring and evaluation over a 2-year period.
A key aim of the programme was to identify the causes and scope of performance
gaps across a wide range of buildings. In the Domestic programme there were 53
projects supported (representing 350 homes), with 23 Phase 1 early occupation
studies and 30 Phase 2 detailed monitoring projects.
1.1.1. Building performance evaluation
The requirements of the programme were identified in the ‘Guide for Project
Execution’ which set out the mandatory testing and evaluation requirements. For
Phase 1 projects, this included:
 Design & construction audit, photographic survey, drawings and SAP calculation
review, qualitative semi-structured interviews and walkthroughs with occupants
and separately, the design team, to explore design intentions compared with final
performance;

 Whole house heat loss testing, including air permeability test, infra-red
thermography, in-situ U-value measurements and smoke based air leakage test;

 Review of systems design and implementation, including installation and
commissioning checks of all services and systems provided to the dwelling,
including measurement of performance and energy use of any MV or MVHR
systems;
 Occupant survey using standardised housing questionnaire; analysis of which is
covered centrally by the Technology Strategy Board;

 Evaluation of hand-over process and any guidance provided to the occupants; 

 Comparison of predicted performance with actual performance and interpretation
of findings.
For Phase 2 projects monitoring was undertaken for a 2-year period and mandatory
elements included:
 Design & construction audit, photographic surveys, drawings and SAP calculation
review, qualitative semi-structured interviews, walkthroughs with occupants, and
separately, the design team to explore design intentions compared with final
1
Zero Carbon Hub (2014) Closing the Gap between Design & as-Built performance–End of Term
Report. Milton Keynes: Zero Carbon Hub
Characteristics and Performance of MVHR Systems: A Building Performance Evaluation Meta-Study 5
performance. This element was only necessary if not already undertaken as part
of a post-construction and early occupation study;
 Metered gas, electricity, water and if appropriate heat, into (and out of) the
dwelling;
 Sub metering according to use e.g. space heating, water heating, cooker, lights
and appliances;
 Measurement of the performance of microgeneration technologies generating
electrical energy and heating/cooling, including separate measurement of the
energy consumption and generation;
 Measurement of the performance and energy use of MVHR systems if not
already carried out as part of a post-completion and initial occupation study;
 An air permeability test towards the end of the monitoring period and also at the
beginning of monitoring period, if not already undertaken as part of a post-
completion and early occupation study;
 In-situ U-value measurement, if not already carried out as part of post-
construction and early occupation study;
 Monitoring of internal environmental conditions (temperature, relative humidity
and CO2);
 Monitoring of external temperature and relative humidity on site;
 External climatic conditions – obtained from an appropriate local weather station;
 Energy audit, including Appliance audit with equipment load and usage profiles
using DomEARM - domestic version of TM22;
 Occupant survey using standardised housing questionnaire – analysis of which
was covered centrally by the Technology Strategy Board;
 Comparison of predicted performance with actual performance and interpretation
of findings.
In practice not all projects were able to undertake all of these tests, or conduct them
to the same standard. Some reporting requirements and deliverables varied over the
4 year period and projects were undertaken at different times, consequently the
dataset is quite diverse. Nevertheless it represents a substantial body of information
from which important insights can be gathered on a range of issues.
More information on the Building Performance Evaluation programme is available
from the Knowledge Transfer Network [connect.innovateuk.org/web/building-
performance-evaluation] and outputs from individual BPE projects are available from
the Digital Catapult: Building Data Exchange [www.buildingdataexchange.org.uk]
1.2. Ventilation and MVHR
It was apparent from the start of the BPE programme that a significant number of
dwellings were using MVHR systems. The requirements for building airtightness
have increased and building regulations require all new dwellings to achieve an air
permeability level of less than 10m3
/(h.m2
) @50 Pa. With improved fabric thermal
performance, ventilation losses become more significant and strategies that can
reduce these may carry considerable weight when evaluating proposed performance.
As a result, MVHR is an attractive option when undertaking SAP calculations and for
improved performance standards in place during the studies, such as Code for
Sustainable Homes and Passivhaus. Consequently, the uptake of MVHR systems is
Characteristics and Performance of MVHR Systems: A Building Performance Evaluation Meta-Study 6
on the rise, with these systems expected to become a common form of ventilation in
the coming years 2
.
The ability to provide requisite levels of ventilation, whilst maintaining energy
efficiency is a highly desirable goal, but a move away from traditional and familiar
forms of ventilation is a step-change in UK housing design. These systems have
been found to provide considerable reductions in space heating demand, and
improvements of indoor air quality (IAQ) and thermal comfort3,4
. However, with
increasingly mainstream use, a series of studies have also highlighted significant
concerns regarding the specification, installation, commissioning, performance,
operation and maintenance of MVHR systems in a domestic context (Appendix A).
Links between ventilation and health are well established; however there is growing
concern that the modern building practice of reducing natural infiltration, increasing
insulation and limiting ventilation to reduce heat loss could cause a significant
detrimental impact on indoor air quality. A UK study carried out by the Ventilation and
Indoor Air Quality (VIAQ) Task Group on MVHR systems in new homes5
has found
significant concerns regarding the delivery and performance of these systems, and
provides recommendations for good practice and highlights the need for more
information.
1.3. Study aims and objectives
This meta study was therefore commissioned to undertake a broad assessment of
domestic projects that utilised MVHR systems in the BPE programme. Whilst projects
have undertaken individual assessments of performance, this study provided an
opportunity to make a broad comparison across a range of projects, to identify
common issues and to make a comparative analysis of the use of these systems.
The initial research questions included:
 Are MVHR systems in low energy homes delivering acceptable levels of indoor
air quality on a long term basis and to what extent? If not, why not?
 What was the design intention and expectation of these?
 What is their mode of operation in relation to the houses in which they are
installed?
 What is their operating efficiency in respect of heat recovery?
 Are they providing sufficient ventilation to maintain IAQ?
 What is their contribution to the overall energy efficiency of the homes?
 Are there problems in terms of specification, maintenance or operation that can
be identified?
 How are occupants interacting with this equipment and how does this impact on
their performance?
2
Sullivan L, Smith N, Adams D, Andrews I, Aston W, Bromley K, et al. (2012) Mechanical Ventilation
with Heat Recovery in New Homes. London: NHBC, Zero Carbon Hub
3
Schnieders J and Hermelink A (2006) CEPHEUS results: measurements and occupants’ satisfaction
provide evidence for Passive Houses being an option for sustainable building. Energy Policy 34(2):
151-171
4
Derbez M, Berthineau B, Cochet V, Lethrosne M, Pignon C, Riberon J, et al. (2014) Indoor air quality
and comfort in seven newly built, energy-efficient houses in France. Building and Environment 72(0):
173-187.
5
Sullivan L, Smith N, Adams D, Andrews I, Aston W, Bromley K, et al. (2013) Mechanical Ventilation
with Heat Recovery in New Homes. London: NHBC, Zero Carbon Hub
Characteristics and Performance of MVHR Systems: A Building Performance Evaluation Meta-Study 7
The aims of the study were to identify the nature of MVHR systems, to analyse the
available performance data, to gather information and insights from projects about
the issues affecting the use and performance of these systems, and to share this
information, experience and knowledge both within projects and to the wider
construction industry.
Characteristics and Performance of MVHR Systems: A Building Performance Evaluation Meta-Study 8
2. Methods and data sources
2.1. Dwelling selection and sample size
From the funded projects within the Innovate UK BPE portfolio, there were a total of
237 MVHR ventilated dwellings. The dwellings represented come from a range of
development sizes, one-off through to major developments (largest ~790 dwellings),
thus the total number of homes represented is in excess of 3300.
The map below shows the geographical spread of MVHR ventilated dwellings that
are included within this study. Subsequently, no one particular developer or installer
features more than once across the projects.
Figure 2.1a Geographical spread of MVHR dwellings
Owing to the tiered study nature of the BPE programme, not all of the 237 MVHR
ventilated dwellings were studied in detail. However, at least one dwelling from each
project site had been subject to detailed investigation by the project teams. The
systems subject to this level of review totalled 54 out of the 237 dwellings, covering
29 domestic BPE projects.
Characteristics and Performance of MVHR Systems: A Building Performance Evaluation Meta-Study 9
Considerable challenges were experienced accessing data for the study due to the
timescale of varying and progressive project completion dates and collation and
curation of the data that continued post-project completion. Assessments made in
this meta-study is based upon data that has been made available through mandatory
reporting templates and the web-based data repository known as Embed. Detailed
assessment of all the final reports was not practical, however, anonymised case
studies illustrating specific issues are included throughout this study.
The data from these 54 systems has been analysed in this meta-study with respect
to air flow characteristics. A selection of these have been assessed for their
contribution toward maintaining comfort conditions within the dwellings.
To give context to the physical data, responses from BUS Methodology©
(covering
resident satisfaction, comfort, control) were reanalysed for 27 projects. Further
information was obtained through surveys and interviews with 15 BPE projects based
on the willingness of the design team to get involved with qualitative review. Care
was taken to ensure that both mainstream low energy housing and Passivhaus
projects were represented in the sample (see section 2.2).
2.2. Dwelling types and systems
2.2.1. Dwelling types and data availability
A range of meta-reviews across different dwellings within the BPE portfolio have
been applied to projects where usable data has been available. Out of the 237
MVHR-ventilated dwellings in the programme, 54 were studied in sufficient detail by
the project teams and this data has been used to assess performance
characteristics. 33 MVHR-ventilated dwellings had consistent data available for
assessing indoor hygrothermal conditions, and this data has been used to assess
comfort criteria. Carbon dioxide data was available for 21 MVHR dwellings, which
was used as an indicator of ventilation performance. Out of all the dwellings
assessed in this meta-study, 20 are certified Passivhaus properties. To enrich the
study, a further 15 non-MVHR (MEV or naturally ventilated) dwellings have been
assessed for environmental performance, and this has been used to benchmark
performance against these two principle ventilation strategies. A summary of systems
reviewed is provided in Table 2.2a.
Table 2.2a. Summary of properties reviewed
Dwelling
types
Performance
characteristics
Design team
interviews
Temp / RH
data
BUS survey CO2 data Energy
MVHR 54 homes
15 projects
(163 homes)
33-34
homes
27 projects
(211 homes)
21 homes 39 homes
Non-
MVHR
n/a n/a 15 homes 15 homes 15 homes 20 homes
2.2.2. Overview of key building characteristics
A range of construction types were included within the portfolio of dwellings:
traditional masonry; timber-frame; pre-fabricated timber-panel; etc. The main dwelling
characteristic assessed in relation to ventilation characteristics is the airtightness
standard, both design target and tested.
Characteristics and Performance of MVHR Systems: A Building Performance Evaluation Meta-Study 10
Figure 2.2a. Dwelling air permeability characteristics – design and tested
* against dwelling reference denotes Passivhaus
The design air permeability target is important in the context of MVHR installations as
any leakage through the dwelling envelope will have an impact on the efficiency of
the heat recovery component. Figure 2.2a illustrates the design and tested air
permeability across 54 dwellings.
The design air permeability targets shown in light blue have a range from as low as
0.5 (m3
/h)/m2
@50Pa to as much as 7.0 (m3
/h)/m2
@50Pa. In total 20 dwellings
(37%) had a design air permeability of <1.0 (m3
/h)/m2
@50Pa; 21 dwellings (39%)
between >1.0 and <3.0 (m3
/h)/m2
@50Pa, and 13 dwellings (24%) were >3.0
(m3
/h)/m2
@50Pa. There are differences of opinion about the appropriate air
permeability threshold suitable for MVHR strategies. Passivhaus advocates suggest
<1.0 (m3
/h)/m2
@50Pa, whereas other suggested target thresholds are for 3.0
(m3
/h)/m2
@50Pa to an upper limit of 5.0 (m3
/h)/m2
@50Pa. Out of these 54
dwellings, 3 (6%) had a design air permeability of >5.0 (m3
/h)/m2
@50Pa.
The measured air permeability values for each dwelling are also shown in the chart,
coloured in dark blue against their design values (the chart is ranked in this order).
There is significant variance, even for some dwellings with <1.0 (m3
/h)/m2
@50Pa
target, between the intended air permeability and the tested value. The tested values
in the chart are for those conducted as part of the BPE projects, and not the test
result obtained at dwelling completion.
The measured air permeability test results range from 0.26 (m3
/h)/m2
@50Pa to 8.95
(m3
/h)/m2
@50Pa. In total, 16 out of the 54 dwellings (30%) achieve a tested air
permeability of <1.0 (m3
/h)/m2
@50Pa, with 15 of these being Passivhaus dwellings.
A further 13 dwellings (24%) achieve an air permeability between >1.0 and <3.0
(m3
/h)/m2
@50Pa, and an additional 11 dwellings (20%) are between >3.0 and <5.0
(m3
/h)/m2
@50Pa. This leaves 14 dwellings (26%) with a tested air permeability of
>5.0 (m3
/h)/m2
@50Pa, with 6 of these being >7.0 (m3
/h)/m2
@50Pa. The mean air
permeability test value in the dataset is 3.2 (m3
/h)/m2
@50Pa. In total, 25 dwelling air
permeability tests (46%) meet their design target value.
0
1
2
3
4
5
6
7
8
9
10
H8_a*
H23_a*
F12_b*
F7_b*
H23_b*
F7_a*
H28_a*
F12_a*
H5_a*
H8_b*
H31_a*
F23_a*
H28_b*
F7_c*
H22_a
H15_c*
H14_a*
H14_b*
H34_a
H20_a
H17_b*
F34_a
F37_a
F36_a
H17_a*
H20_d
F37_a
H17_c*
F37_a
H33_a
F36_b
H29_a
H20_c
H20_b
F36_c
H26_a
H26_b
H29_b
H25_a
F4_a
H24_a
H21_a
H32_b
F4_b
H35_a
H32_a
H24_b
F27_a
H30_b
H24_d
H30_a
H9_a
H24_c
H24_e
(m3/h)/m2@50Pa
Dwelling air permeability (m3/h)/m2@50Pa
Tested Air Permeability Design Air Permability
Design Values: n<1.0 = 20; n>1.0<3.0=21; n>3.0<5.0=10; n>5.0 = 3
Characteristics and Performance of MVHR Systems: A Building Performance Evaluation Meta-Study 11
2.3. Data collection methods
2.3.1. Assessing performance characteristics
Through the mandatory deliverables from each project, various data relating to the
characteristics of the dwelling and their ventilation systems was available. Final
reports were also reviewed in order to obtain the required information. This data trawl
resulted in standardised characteristics forms being created for each MVHR system
to allow characterisation of the systems and dwellings: air permeability; air flow
performance; system balance, etc. This process would also identify any emerging
trends, e.g. ducting types; relationship to original commissioning values, etc., which
may also have a bearing on in-use performance.
The first review for the performance characterisation was to understand the range of
air permeabilities within the MVHR ventilated dwellings. All projects, whether Phase 1
or Phase 2, undertook air permeability testing on their subject dwellings. These tests
were additional to any testing carried out for regulatory compliance purposes.
The programme requirement for air permeability testing was to test in Phase 1 (or at
the start of Phase 2 if no Phase 1 study), and to conduct a further test at the end of
Phase 2. For the purpose of this meta-study, the first test result has been used.
All tests performed followed the guidance within Technical Standard 1 – Measuring
air permeability of building envelopes, Issue 2, (ATTMA 2007) and BS EN 13829:
2001 Thermal performance of buildings - Determination of air permeability of
buildings – Fan pressurization method; with the additional requirement that the
derived permeability was the mean of the resulting pressure and de-pressure tests.
For assessing the air flow characteristics, the volume flow rates associated with each
system were re-measured by the project teams as part of the BPE study, irrespective
of any original commissioning that had previously taken place. This task usually took
place during Phase 1, with the intention being to understand the systems’
performance and make any necessary adjustments prior to taking the dwelling
forward to long-term monitoring. Measurements were made using UKAS calibrated
volume flow equipment, and followed specific requirements in the project execution
guide, which references the procedure in the published Domestic Ventilation
Compliance Guide6
.
For the purpose of this meta-study, Phase 1 measurement data has been used, as
this, theoretically, should closely represent the air flow performance of the systems
post-commissioning, but pre-occupation (i.e. condition at hand-over). The Phase 1
data was considered to be the most reliable of that available, and has been used as
a benchmark to compare against both the design and commissioning data, where
this was made available. However, in some cases, Phase 2 measurement data has
been used, but only where a project did not participate in Phase 1, or where full re-
commissioning of the system was necessary as a result of poor results from Phase 1
measurements. This is to discount potential system adjustments by residents (Phase
2 studies were undertaken in occupied dwellings), which may skew comparisons with
design and commissioning data.
Assessments have been made for each system to determine their success for
meeting both their original design air flow values, and for meeting the design
specification published in Approved Document F – Ventilation (AD F: Part F of the
Building Regulations for England and Wales). Where design information was not
available, the meta-study team have derived the minimum design air flow values in
accordance with the values published either in Approved Document F 2006 or 2010
editions (whichever revision was in force at the time for that particular dwelling).
6
Department for Communities and Local Government (July 2011) Domestic Ventilation Compliance
Guide
Characteristics and Performance of MVHR Systems: A Building Performance Evaluation Meta-Study 12
Some dwellings within the portfolio are located in Scotland and Northern Ireland,
where different regulations are used. However, for the purpose of this meta-study,
comparisons have been made with the design guidance published in AD F,
irrespective of dwelling location. AD F, which carries the same specification as
Technical Booklet K (Building Regulations (Northern Ireland)), and Building
(Scotland) Regulations (Technical Handbook - Domestic Section 3 Environment),
does not contain any performance specification for dwelling air flow rates.
2.3.2. In-use performance
Phase 2 projects generally spanned a two year period, during which time monitoring
equipment was installed in the dwellings to collect data in accordance with the BPE
programme protocol. The data recorded by the numerous sensors and meters in
each house has been uploaded onto the Embed data repository. Being a new
system, created during the same period as the BPE programme, there were
significant delays with uploading, configuring, and ultimately accessing the data from
individual projects. Access by the meta-study team was given in July 2015.
Included within this data is information applicable to understanding MVHR
performance. This included the following:
 Internal temperature (°C), typically living room and bedroom(s);
 Internal %RH, typically living room and bedroom(s);
 Internal CO2 concentration (ppm), typically living room and bedroom(s);
 Energy used by MVHR (kWh) installation.
Following a review of the data available on Embed, a decision was made to use the
statistics (max, min, mean and range) generated within the Embed platform to form
the basis of the analysis. Whilst this may have limited the results, it did eliminate the
need for analysis of the raw data files (which is beyond the scope of a meta-study),
and therefore significantly reduced the time required for data collection.
Monitoring sites were limited to living rooms and bedrooms, as these tend to have
the greatest levels of occupancy. Bedrooms are spaces where occupants spend the
most uninterrupted time. Children may also use their bedrooms for socialising and
schoolwork, in which case they could spend a significant amount of time in the
bedroom. Bedrooms over-night present consistent conditions with occupants asleep,
with little or no adaptive behaviour, which minimises confounding variables in respect
of ventilation. Accordingly, environmental conditions and ventilation rates in
bedrooms and living rooms are of particular interest as these spaces provide the
greatest exposure to occupants.
Analysis of environmental data (temperature, relative humidity and CO2) was limited
to three months (February, April and August), representative of winter, spring and
summer conditions. This provided the opportunity to explore seasonal variations. The
analysis was further limited to the year 2013, to reduce the impact of yearly climate
variations. Only complete datasets for each month were included in the analysis.
Although energy data was available on the Embed platform, this was significantly
limited and there were a number of caveats pertaining to the validity of the available
information. Specifically, there was concern regarding the correct use of units (W,
kW, kWh) and the format (cumulative or differential) in which the data was available.
Furthermore, aggregated data for total electrical, non-electrical and space heating
consumption was not available at the time for all projects, therefore manual
calculations were required. For these reasons, a decision was made to extract
energy data (annual space heating, electricity consumption and non-electricity
consumption) from the available DomEARM spreadsheets. Unfortunately, it was not
possible to accurately evaluate the energy performance (electrical consumption or
heat recovery efficiency) across the range of MVHR systems in practice due to a lack
of viable data.
Characteristics and Performance of MVHR Systems: A Building Performance Evaluation Meta-Study 13
2.3.3. Surveys and interviews
As well as dwelling characteristic information and monitored data, additional data
were gathered from the BUS surveys which were undertaken by all projects. To give
context to the physical data, responses from BUS Methodology© (covering resident
satisfaction, comfort, control) were reanalysed for 27 projects. Further information
was obtained through surveys and interviews with 15 BPE projects based on the
willingness of the design team to get involved with qualitative review.
The purpose of the reanalysis of BUS surveys, surveys and interviews by the BPE
project teams was to:
 Understand the design intention and expectation of the MVHR systems;
 Identify problems and good practices in terms of specification, maintenance or
operation;
 Evaluate how occupants interact with MVHR systems and how this may impact
on their performance.
Feedback from occupants was assessed by undertaking a re-analysis of BUS survey
results (n: 27 projects covering 211 dwellings) along with primary data collection
using online survey questionnaire and/or telephone interviews with design teams (n:
15 projects covering 163 dwellings). Table 2.3a lists the projects for which primary
data collection was undertaken.
Table 2.3a BPE projects represented by design team interviews (and/or questionnaire)
Project Code Feedback from design teams
H17 Questionnaire & Interview
F4 Questionnaire & Interview
H20 Questionnaire & Interview
H23/F23 Questionnaire & Interview
F1 Questionnaire & Interview
H14 Questionnaire only
H25 Interview
H8 Interview
H5 Interview
H15 Interview
H26 Interview
F27 Interview
H10 Interview
H9 Interview
H35 Interview
2.4. Limitations of the study
The study relies both on the quality and availability of project data that has been
collected by other parties. There will likely be some variances with data collection
techniques between 3rd
party project teams and the completeness of their respective
project data. This study has made reasonable attempts to ensure that any data used
for the purpose of meta-analysis is of sufficient quality to ensure that the findings
herein are satisfactorily robust.
Characteristics and Performance of MVHR Systems: A Building Performance Evaluation Meta-Study 14
The findings have some caveats. Importantly:
 Dwellings were not randomly selected for inclusion in the Building Performance
Evaluation programme, therefore may not be representative of all UK new build
dwellings with MVHR systems;
 Measurements were undertaken independently for each housing project,
therefore sampling equipment and methodology may have varied;
 Exact occupancy levels during the monitoring period were not known;
 Occupant behaviour and use were not objectively measured and are likely to
have had a significant effect on the results. In particular, it is not clear if all MVHR
systems were in operation during the environmental monitoring;
 The frequency of window opening was not monitored in the majority of homes;
 The volume of monitored living room and bedroom spaces were unknown;
 Data was extracted from the Embed platform manually, therefore may be subject
to human error;
 Variations of localised climatic conditions, airtightness levels, construction type
and space heating strategies were not taken into account;
 Start and end date for the annual energy monitoring data were not consistent
across all projects;
 Uneven sample sizes for MVHR and Non-MVHR data.
Despite these limitations, the results provide an important insight into the
performance of MVHR systems in practice. Furthermore, since the limitations were
the same for all monitored dwellings, they are not expected to have had a significant
impact on the results.
Characteristics and Performance of MVHR Systems: A Building Performance Evaluation Meta-Study 15
3. Characteristics of MVHR systems
3.1. Compliance: design stage
Figures 3.1a and 3.1b show data from a selection of 43 properties where the original
design data had been submitted. As the guidance for minimum air flow rates
changed between AD F 2006 and 2010, the charts have been separated to reflect
the whole dwelling ventilation rate according to the revision of the Approved
Document that was in force for that particular property.
Figure 3.1a shows the properties that were completed under the 2006 revision of AD
F. The minimum whole-house ventilation rate required, shown by the green line, is
based upon the requirement of 0.3 l/s per m2
of internal floor area with an allowance
for infiltration by subtracting 3% (single-storey) or 4% (multi-storey) internal volume of
air from the whole dwelling ventilation rate, according to dwelling type.
Figure 3.1a. Design stage air flow rates compared to AD F (2006)
Bold bars denote Passivhaus dwellings
The chart (Figure 3.1a) shows that, in all 25 submitted cases, the ventilation designs
meet the minimum air flow specification given AD F (2006). However, the guidance
published in this revision of AD F was designed to cope with air permeability levels
down to around 3-4 (m3
/h)/m2
@50Pa, and it suggested that additional ventilation
provisions (air flow) should be considered for more airtight properties. It would be
reasonable to consider that the allowance for additional provision would be to remove
the infiltration allowance, thereby the provision of all air flow is via the ventilation
system (i.e. not relying upon infiltration to account for a proportion of the total
ventilation). The purple line shows the 0.3 l/s per m2
(without infiltration allowance),
and this is the revised specification for minimum ventilation rates as required by AD F
(2010).
Of the 25 properties represented in Figure 3.1a, 18 of the properties have a tested air
permeability of <3.0 (m3
/h)/m2
@50Pa, and therefore the design air flow rate should
0
5
10
15
20
25
30
35
40
45
50
litrespersecond
Air flow rate (design) comparison to Part F requirements
(appropriate to dwellings when Part F 2006 was in force)
Designed Flow Rate (Supply) Designed Flow Rate (Extract)
Minimum for Part F (2006) Minimum for Part F (2010)
n(2006) = 25 (n < Part F = 0; n > Part F = 25)
Characteristics and Performance of MVHR Systems: A Building Performance Evaluation Meta-Study 16
accord with the requirements of AD F (2010). As the chart shows, only 6 of the
designs (all <3.0) meet the required air flow criteria. Thus, it could be considered that
only 13, or 52% of the design ventilation rates meet the AD F (2006) specification.
Figure 3.1b shows a further 18 properties that were completed to meet AD F (2010)
revision. The purple line in the chart shows the minimum design flow rate for each
property to meet the AD F (2010) specification. In the majority of cases (72%), the
original design values are equal, or greater than the minimum value. However, the
design for 5 properties do not meet the minimum specification. Given the period
during which the BPE programme spanned, it is probable that these properties fell
during the transition between 2006 and 2010 revision of AD F coming into force.
Figure 3.1b. Design stage air flow rates compared to AD F (2010)
Bold bars denote Passivhaus dwellings
The origin of the designs are not known, whether they had been undertaken by the
manufacturers (or their agents), or by a member of the project design team (e.g. M+E
engineer). Out of these 43 properties it is noted that the submitted design values for
the whole-dwelling supply and ventilation rates, are out of balance for 17 (39%) of
systems, the most striking being property F27_a in Figure 3.1a. In 16 out of 17 cases
(all except ref F27_a) it was found that the design flow rates followed the guidance in
the relevant revision of AD F, e.g. supply air rates determined by 0.3 l/s per m2
, and
extract rates determined from minimum high rate published for each room. AD F
does not require system air flows to balance, although it is necessary to obtain
optimum thermal efficiency and minimise risks relating to condensation. Imbalance
findings are discussed later in this section. It is believed that the design for property
F27_a used higher design extract rates, which are applicable to intermittent, as
opposed to continuously running mechanical extract fans.
3.2. Commissioning
The original commissioning data was available for 38 out of the 54 systems
reviewed. In most cases, this data has been transcribed by the project teams, thus
the original commissioning sheets have not been reviewed as part of this study.
Table 3.2a shows that, out of the 38 systems with commissioning data, it would
0
5
10
15
20
25
30
35
40
45
50
litrespersecond
Air flow rate (design) comparison to Part F requirements
(appropriate to dwellings when Part F 2010 was in force)
Designed Flow Rate (Supply) Designed Flow Rate (Extract) Minimum for Part F (2010)
n(2010) = 18 (n < Part F = 5; n > Part F = 13)
Characteristics and Performance of MVHR Systems: A Building Performance Evaluation Meta-Study 17
seem that only 19 have been commissioned at both speeds (normal and boost
speeds are necessary for demonstrating AD F minimum values have been met). It is
acknowledged that some MVHR systems have more than two speed settings, but
this review is limited to the published guidance values for minimum low and minimum
high rates in AD F.
Table 3.2a: Summary of commissioning data available
Number of systems
reviewed
Both speeds
Normal speed
only
Boost Speed only No data
54 19 28 27 16
Thus, 50% of the systems can be judged to be only partially commissioned with
respect to air flow. Of those that had partial commissioning data, a small number
gave only the supply air values in normal speed and extract values in boost speed.
These are the key values for demonstrating that the minimum requirement for 0.3 l/s
per m2
for supply, and individual room boost extract rates had been met.
Irrespective of completeness of commissioning, of greater concern is the reliability of
the commissioning values recorded. Out of the 38 systems reviewed, 25 (66%) had
either identical values to their design values, and/or the individual room extract rate
values were identical to those published in AD F. Whilst it is accepted that there may
be a degree of ‘rounding’ of recorded values during commissioning, the similarities
between commissioned and design values are unlikely. There is a strong possibility
that some systems have been provided with air flow commissioning values, even
though the systems themselves have not been commissioned.
Out of the 38 sets of commissioning data reviewed, only 6 (16%) systems have
provided sufficient evidence to demonstrate that they have been satisfactorily
commissioned with respect to minimum air flow rates and balancing.
3.3. Air flow rates
Measured air flow rates were available for 52 properties. The air flow measurements
used for this assessment were those taken during the BPE study, and not the original
commissioned air flow values. 34 of the systems are represented in figure 3.3a, and
are judged against AD F (2006), which was in force at the time.
Out of the 34 systems, the minimum air flow requirement is met in 23 systems (68%),
with two systems (H24_c and H24_d) failing significantly. A number of systems were
commissioned to have higher air flow rates, meeting or exceeding the AD F (2010)
air flow rates. In most cases, these are the more airtight dwellings (<3.0 (m3
/h)/m2
),
as summarised later.
Characteristics and Performance of MVHR Systems: A Building Performance Evaluation Meta-Study 18
Figure 3.3a. Measured air flow rates compared to AD F (2006)
Bold bars denote Passivhaus dwellings.
Figure 3.3b. Measured air flow rates compared to AD F (2010)
Bold bars denote Passivhaus dwellings
Chart 3.3b displays systems where AD F (2010) was in force. Out of the 18 systems
represented, only 6 (33%) meet the minimum air flow rate required.
Across the 52 systems assessed, 27 were for dwellings with a tested air permeability
of <3.0 (m3
/h)/m2
. Using AD F (2010) minimum dwelling ventilation rate for these,
more airtight homes (irrespective if AD F (2010) was in force), only 33% met the
minimum criteria.
Specific extract air high rates (or boost speed ) for wet rooms are published in AD F
for the removal of excess moisture production during cooking and bathing times.
0
5
10
15
20
25
30
35
40
45
litrespersecond
Air flow rate (measured) compared to Part F requirements
(appropriate to dwellings when Part F 2006 was in force)
Measured Flow Rate (Supply) Measured Flow Rate (Extract)
Minimum for Part F (2006) Minimum for Part F (2010)
n(2006) = 34 (n < Part F = 11; n < Design = 14)
0
5
10
15
20
25
30
35
40
45
litrespersecond
Air flow rate (measured) compared to Part F requirements
(appropriate to dwellings when Part F 2010 was in force)
Measured Flow Rate (Supply) Measured Flow Rate (Extract) Minimum for Part F (2010)
n(2010) = 18 (n < Part F = 12)
Characteristics and Performance of MVHR Systems: A Building Performance Evaluation Meta-Study 19
These extract rate values between the 2006 and 2010 revisions are the same and
set the minimum value for these rooms, as illustrated in table 3.3a.
Table 3.3a. Extract air: minimum high rate values AD F
Room Minimum High Rate (l/s)
Kitchen 13
Bathroom 8
Utility room 8
Sanitary (e.g. W.C. no bath/shower) 6
Figure 3.3c quantifies the individual room extract air high flow rates across the 48
systems assessed. The boxes show the upper and lower quartiles, and the median
value. The whiskers show the minimum and maximum values from the dataset. The
red dot highlights the minimum value required to satisfy AD F.
Overall, the measured boost extract air flow rates meet the 13 l/s minimum for
kitchens (AD F) in 44% of systems. 71% of bathrooms meet the 8 l/s requirement,
whereas only 30% of en-suites and 38% of utility rooms meet the 8 l/s criteria. In
W.C.’s, which have a lower extract flow rate requirement of 6 l/s, the flow rates were
met in 77% of systems.
Figure 3.3c Measured individual room extract flow rates in boost
3.4. System balance
Achieving a reasonable balance between supply/intake air streams and extract/
exhaust air streams is important for heat recovery with an MVHR system. By
achieving a reasonable system balance it can be assumed that all ventilation air
entering and leaving the property passes via the heat exchanger, thus maximising
the available heat recovery potential. An imbalance between these air streams can
0.00
5.00
10.00
15.00
20.00
25.00
Kitchen Bathroom En Suite Utility W.C.
Litrespersecond(l.s-1)
Measured Extract Flow (High) Rates
Minimum AD F
n = 48
n = 48
n = 8
n = 30n = 10
n<13 l/s
= 27
n<8 l/s
= 14 n<8 l/s
= 7
n<8 l/s
= 5 n<6 l/s
= 7
Characteristics and Performance of MVHR Systems: A Building Performance Evaluation Meta-Study 20
put the dwelling under a slight pressure differential, which in turn will allow ventilation
air to find alternative air paths via the building envelope. This will likely have a
bearing on the system heat recovery efficiency, although it has not been possible to
explore this aspect in this meta-study.
In practice, achieving a perfect balance, that is a balance of 0%, is usually
impracticable to achieve. Some of this is due to the accuracy limitations of
measurement devices used during commissioning and influences during
commissioning (e.g. wind), and some is to do with the variability of some
manufactured systems to allow such a degree of fine-tuning. In order to achieve a
reasonable balance it is often necessary to set an imbalance between supply and
extract fans. The amount of imbalance will depend upon the difference in resistances
present in these two air streams, dictated by variables such as: the length of ducting;
number of junctions, and bends; number of room outlets.
AD F (2010) does not set imbalance criteria, and the only known specification for
system balance is that set within the protocols for commissioning Passivhaus
certified installations. The maximum allowable imbalance between intake and
exhaust air flow for these systems is 10%. A slightly more relaxed allowance of 15%
is taken as current accepted practice, although there is no known publication of this
value.
Figure 3.4a. Symmetrical mean percentage deviation between supply and extract rates
* against dwelling reference denotes Passivhaus.
Figure 3.4a shows the balance observed in 52 MVHR systems set at ‘normal’ speed.
These values are taken from the sum of the individual room supply and extract rates,
and not the intake and exhaust measurements, as these were not available in most
cases. The red dotted line shows the 15% allowance. Out of the 52 systems, 25
(48%) have an imbalance of <15%, the remainder being above this, with 14 (27%)
being significantly out of balance (deemed as >30%). Of the 15 Passivhaus systems,
6 show an imbalance of >10%.
3.5. Influence of duct type
The type of ducting across 48 systems has been reviewed. The systems selected are
those where data about the ducting type has been reported by the projects. This has
been categorised into three broad types:
0
10
20
30
40
50
60
70
80
90
100
F7_a*
H31_a*
H5_a*
H15_c*
H8_b*
H28_b*
H29_b
H8_a*
H28_a*
H20_b
H20_d
F37_a
H29_a
H17_a*
H20_c
F36_c
H17_b*
H14_b*
H17_c*
F7_b
H33_a
F36_b
H32_b
F4_a
F36_a
H21_a
H20_a
F7_c*
F12_b*
F4_b
H25_a
F37_a
H30_a
H35_a
H22_a
H24_e
F37_a
H30_b
H32_a
F12_a*
H14_a
H9_a
H34_a
H26_a
H26_b
F27_a
F34_a
Mean Percentage Deviation (Balance Between Supply/Extract)
+
Characteristics and Performance of MVHR Systems: A Building Performance Evaluation Meta-Study 21
1. Flexible: this is where 100% of the installed ducting for the system is flexible,
irrespective of material or quality.
2. Hybrid: this is where the large majority of ducting is rigid, but some flexible
elements have been used, particularly for final connections to room terminals
and the MVHR fan unit. Some installations may have had flexible components
for bends, offsets, or other awkward elements.
3. Rigid: this is where it is known that 100% of the installed ducting is rigid (an
exception being final connections to the MVHR unit which is often a
recommendation of some manufacturers), irrespective of material, e.g. plastic
or metal.
This review, limited by the data available, compared the measured air flow
performance against the original design air flow. Although a fairly simple assessment,
it is useful to determine any emerging trend for ducting types where system air flow
performance is better than or equal to the design air flow. The design data used for
this assessment is the original submitted design.
The results from this review are presented in figure 3.5a. The upper segment of the
chart (green background) represents systems where the measured air flow rates are
equal to or greater than the design. The lower segment represents system air flow
rates that do not meet the design air flow. The air flows for the supply (S) and extract
(E) for each duct type are plotted.
Figure 3.5a Duct types: measured airflow comparison with design air flow.
Overall, 40% of hybrid ducted systems and 44% of flexible ducted systems meet their
design air flow criteria. By comparison, the measured air flow in 88% of rigid-duct
systems meet the design air flow criteria. This assessment is limited and some
caveats need to be considered. For example, duct pressure drop is not known for
any system in the data set, air leakage through ducting is not known, the fan system
employed by the MVHR may either be constant power or constant velocity types,
quality of installation and commissioning is not known, etc. The results do however
indicate a trend toward improved performance with rigid ducting systems.
0
5
10
15
20
25
30
35
40
45
0 5 10 15 20 25 30 35 40 45
Measuredairflow(l/s)
Min Part F Design air flow (l/s)
Duct type vs air flow
100% Flexible (S) 100% Flexible (E) Hybrid (S) Hybrid (E) 100% Rigid (S) 100% Rigid (E)
Characteristics and Performance of MVHR Systems: A Building Performance Evaluation Meta-Study 22
4. In-use performance
4.1. Ventilation performance
Levels of carbon dioxide indoors correlate well with human occupancy and human-
generated pollutants. There is a general acceptance that carbon dioxide keeps ‘bad
company’ and that levels above 1000 ppm are indicative of poor ventilation rates.
The derivation of this is well evidenced7
and corresponds well with a ventilation rate
of 8 l/s per person identified in CIBSE Guide A8
, which also sets down classifications
for IAQ and CO2 concentrations associated with these.
Health effects of ventilation are also well evidenced and whilst there is less literature
available as to these effects in housing, a recent paper by Wargocki9
identifying
associations between carbon dioxide levels and health concluded, “The ventilation
rates above 0.4 h-1
or CO2 below 900 ppm in homes seem to be the minimum level to
protect against health risks based on the studies reported in the scientific literature”.
There are however some limitations to the use of CO2 as an indicator. The rise in
levels is relative to external levels, which may vary by location and time; different
projects may be using different types of equipment, placement and methodology; the
degree of range and accuracy is not known; and periods of occupancy are likely to
vary over time and between projects. Levels of CO2 may also be unconnected to
pollutants unrelated to occupancy, such as off-gassing from building materials,
carpets and furniture.
Nevertheless, in the context of concern over ventilation rates, CO2 levels provide a
useful indicator of relative levels of ventilation and the BPE projects have used CO2
measurements as a low cost means of examining ventilation. Projects also recorded
temperature and relative humidity levels, and in a limited number of projects,
occupancy (through passive infrared (PIR) sensors) and window opening (through
contact sensors) were recorded. This data has been examined to evaluate the
comparative performance across a range of projects.
Available data (maximum, minimum, range and average values) for each parameter
was extracted manually from the BPE section in Embed and transferred to Excel for
analysis. Cleaning of the data was performed within the Embed platform, where data
greater than two standard deviations from the median was classified as ‘in error’ and
was not used in the calculations. Monthly data was constructed from average daily
rollups for instant readings.
After initial observation, it was evident that the available dataset for MVHR dwellings
was relatively limited and there was not a complete overlap with the dataset on
system characteristics (only 21 dwellings with both environmental and system
characteristics data). Properties were selected based on the availability of data and
the completeness of the datasets. A decision therefore was made to include data
pertaining to non-MVHR dwellings (also collected as part of the BPE programme) in
the analysis to provide a basis for comparison.
4.1.1. Comparative ventilation performance
The internal CO2 levels were initially compared to available data of non-MVHR
dwellings (dwellings that were ventilated naturally or with Mechanical Extract
7
Porteous, Colin (2011) Sensing a historic low-CO2 future. Chemistry, Emission Control, Radioactive
Pollution and Indoor Air Quality, Rijeka, Croatia: Intech.
8
CIBSE. Guide A: Environmental design. 7th Edition, London: CIBSE, 2006
9
Wargocki P (2013) The effects of ventilation in homes on health. International Journal of Ventilation
12(2): 101-118.
Characteristics and Performance of MVHR Systems: A Building Performance Evaluation Meta-Study 23
Ventilation). Data is shown for living rooms (MVHR n=18-22, non-MVHR n=15) and
bedrooms (MVHR n=20-23, non-MVHR n=20) in three sample months (February,
April and August 2013). Comparison graphs show mean and peak levels of CO2
during February (figure 4.1a and 4.1b) and are ranked in order of magnitude. The full
range of graphs is shown in Appendix B and the data is summarised in Tables 4.1a
and 4.1b.
Table 4.1a. Average living room CO2 levels (ppm) in MVHR and Non-MVHR homes
MVHR (n=18-22) Non-MVHR (n=15)
Peak CO2 Mean CO2
Range of
CO2
Peak CO2 Mean CO2
Range of
CO2
Feb (mean) 1046 754 492 2013 867 1588
Apr (mean) 1206 754 669 1768 783 1388
Aug (mean) 966 631 471 1675 726 1262
Table 4.1b. Bedroom CO2 levels (ppm)
MVHR (n=20-23) Non-MVHR (n=20)
Peak CO2 Mean CO2
Range of
CO2
Peak CO2 Mean CO2
Range of
CO2
Feb (mean) 1122 762 614 2514 1118 2040
Apr (mean) 1275 749 779 2638 1103 2121
Aug (mean) 1120 644 674 2623 966 2189
Figure 4.1a. February average (mean) living room CO2 levels in MVHR and Non-MVHR homes
* Passivhaus dwellings
* * * * * *
* *
* * *
0
10
20
30
40
50
60
70
80
90
0
100
200
300
400
500
600
700
800
900
1000
1100
1200
1300
1400
F11_b
H20_a
H14_a
F4_b
F12_b
H8_b
F1_d
H16_a
H9_a
H15_c
F4_a
H17_b
H5_a
H20_d
H8_a
F11_c
F11_a
H11_a
F1_a
H15_b
F7_c
H6_b
H9_B
H11_b
F1_e
H11_d
H15_a
H11_c
H6_a
H17_c
F7_a
H17_d
F19_a
F11_d
H19_b
H19_a
H20_c
Floorare(m2)perperson
CarbonDioxide(ppm)
February Mean Living Room CO2 Levels (MVHR and Non-MVHR)
Feb Mean CO2 (MVHR) Feb Mean CO2 (Non-MVHR) Floor area (m2) per person
Characteristics and Performance of MVHR Systems: A Building Performance Evaluation Meta-Study 24
Figure 4.1b. February Peak Bedroom CO2 levels in MVHR and Non-MVHR homes
* Passivhaus dwellings
Figure 4.1c. Peak Living room CO2 levels in MVHR and Non-MVHR homes
* * * * *
* * * * * *
*
* *
0
20
40
60
80
100
120
140
160
180
200
0
500
1000
1500
2000
2500
3000
3500
4000
4500
5000 H14_a1
H8_b1
F1_d1
H5_a1
H10_a1
F12_b1
F11_b1
H16_a1
H15_c1
F1_b1
H8_a1
H15_c2
H17_b1
F7_a1
F7_b1
F11_d1
F19_a1
H15_a2
H17_d1
H11_d1
H15_a1
H6_a1
H17_d2
H17_c1
H11_a2
H6_b1
F11_c1
H11_c1
H11_d2
H19_a1
H11_b2
F11_a1
H19_b1
H15_b1
H11_b1
H11_c2
H11_a1
Totalfloorarea(m2)perperson
CarbonDioxide(ppm)
February Peak Bedroom CO2 Levels (MVHR and Non-MVHR)
Feb Peak CO2 (MVHR) Feb Peak CO2 (Non-MVHR) Floor area (m2) per person
0%
20%
40%
60%
80%
100%
MVHR Non-MVHR MVHR Non-MVHR MVHR Non-MVHR
February April August
Percentageofmonitoredlivingrooms
Peak living room CO2 levels (MVHR and Non MVHR dwellings)
Percentage ≤1000 ppm Percentage >1000, <1500 ppm Percentage ≥1500 ppm
Characteristics and Performance of MVHR Systems: A Building Performance Evaluation Meta-Study 25
Figure 4.1d. Peak Bedroom CO2 levels in MVHR and Non-MVHR homes
It is important to note that the limitations of data access means that average levels
are not time weighted and are therefore averaged across the entire month,
regardless of times or intensity of occupation. Furthermore, although data in Embed
has been checked to omit spurious results, individual peaks may be isolated events.
Nevertheless, there is a clear differentiation between the dwellings with and without
MVHR systems, with MVHR systems in general having lower levels of CO2. The
difference is more marked when comparing peak CO2 levels in living rooms and
bedrooms, which were noticeably higher in the non-MVHR dwellings (see Figures
4.1c and 4.1d). Both peak and average levels were higher in the bedrooms and in
these spaces the difference was much greater in non-MVHR houses.
The impact of ventilation provision on indoor CO2 levels was most evident during
February, which is likely due to a lower prevalence of window opening during the
winter season. However higher CO2 levels were also found in general in non-MVHR
compared to MVHR dwellings during both April and August months, but in the
summer the picture is more mixed, with more MVHR houses with higher CO2 levels.
This may be due to a shift toward natural ventilation strategies in summer with
greater window opening, but may also be due in some cases to MVHR systems
being turned off in summer.
This comparison may indicate that the homes with MVHR systems achieved a better
ventilation outcome compared to non-MVHR homes and, specifically, that the use of
an MVHR system may have attributed to improvements of ventilation levels in these
homes. There are some exceptions to this, which are evident through the outliers
identified in the graphs. In the case of dwellings with MVHR systems, the disabling of
the system may mean that the dwelling has effectively become non-MVHR.
Reporting of the projects suggest that in a number of cases systems may be disabled
due to issues of noise and understanding, and that dwellings then revert to a window
opening strategy (in the absence of any means of background ventilation); examples
of these are described in later case studies.
These findings may however be flattering to MVHR dwellings and should be
considered in light of previous studies that have demonstrated significant issues with
ventilation effectiveness in naturally ventilated dwellings with low air permeability,
0%
20%
40%
60%
80%
100%
MVHR Non-MVHR MVHR Non-MVHR MVHR Non-MVHR
February April August
Percentageofmonitoredbedrooms
Peak bedroom CO2 levels (MVHR and Non MVHR dwellings)
Percentage ≤1000 ppm Percentage >1000, <1500 ppm Percentage ≥1500 ppm
Characteristics and Performance of MVHR Systems: A Building Performance Evaluation Meta-Study 26
particularly the performance of trickle vents in practice10
. Furthermore, analysis of the
occupancy levels and floor area data indicates that many of the homes with MVHR
systems had lower occupancy densities than non-MVHR dwellings, which is likely to
have significantly influenced the results. The total floor area per person (m2
) was
determined by dividing the footprint of each home by the stated number of occupants
(extracted from the DomEARM spreadsheets). Since occupancy levels were not
objectively measured during the Building Performance Evaluation process, these
figures represent estimated occupancy densities only, and therefore do not take into
consideration, for example, changes of household occupancy over the measurement
period, employment status (working at home or away), or occupancy levels in
specific rooms.
Nevertheless, the prospect that a dwelling which has a constantly running
mechanical system supplying air to these rooms would result in an improved
ventilation provision is not unreasonable. Of remaining concern however is what the
effects are when such a system is not in operation or operating correctly.
4.1.2. Ventilation performance in dwellings with MVHR systems
Focusing particularly on the dwellings with MVHR systems, an analysis of the limited
available monitoring data did not produce any significant differentiation between
dwellings. Figure 4.1e presents average bedroom levels of CO2 for February, April
and August. CO2 levels were generally lowest during the summer season, attributed
most likely to a greater prevalence of window opening. Of interest is that peak levels
were rarely above 1000ppm in all seasons in the majority of dwellings, but those that
were high were significantly higher. Whilst the majority are Passivhaus, there was no
clear association between these and lower CO2 (see Table 4.1c and Figure 4.1e), or
between houses with higher flow rates. However given the relatively small sample
size, there will be other confounding variables, for example room occupancy and flow
rate to the room being monitored.
Table 4.1c. Average living room CO2 levels (ppm) in Passivhaus and Non-Passivhaus homes
Passivhaus (n=12-15) Non-Passivhaus (n=11-12)
Peak CO2 Mean CO2
Range of
CO2
Peak CO2 Mean CO2
Range of
CO2
Feb (mean) 1134 757 599 946 748 372
Apr (mean) 1265 691 795 1138 829 522
Aug (mean) 1157 628 706 758 633 215
10
Sharpe T, Porteous C, Foster J and Shearer D (2014) An assessment of environmental conditions in
bedrooms of contemporary low energy houses in Scotland. Indoor and Built Environment 23 (3): 393-
416.
Characteristics and Performance of MVHR Systems: A Building Performance Evaluation Meta-Study 27
Figure 4.1e. Average bedroom CO2 levels in dwellings with MVHR
* Passivhaus dwellings
Whilst these averages were generally lower than 1000ppm the limitations of the data
are such that these figures represent average bedroom levels for the whole month
and therefore will include significant periods of time when the bedrooms were most
likely unoccupied, particularly during the day time; occupied periods may have higher
CO2 averages.
Figure 4.1f. Peak bedroom CO2 levels in dwellings with MVHR
* Passivhaus dwellings
*
*
*
*
* * *
*
* * *
* * *
0
20
40
60
80
100
120
140
160
180
200
0
500
1000
1500
2000
2500
3000
Floorarea(m2)perperson
CarbonDioxide(ppm)
February, April and August 2013 Average Bedroom CO2 Levels
Feb Mean CO2 Apr Mean CO2 Aug Mean CO2 Floor area (m2) per person
*
*
*
*
* * *
*
* *
*
*
*
0
20
40
60
80
100
120
140
160
180
200
0
500
1000
1500
2000
2500
3000
Floorarea(m2)perperson
CarbonDioxide(ppm)
February, April and August 2013 Peak Bedroom CO2 Levels
Feb Peak CO2 Apr Peak CO2 Aug Peak CO2 Floor area (m2) per person
Characteristics and Performance of MVHR Systems: A Building Performance Evaluation Meta-Study 28
Peak CO2 levels therefore may be considered a better indicator of bedroom
ventilation rates, (see Figure 4.1f). This graph demonstrates that whilst in most
bedrooms peak CO2 levels remained relatively low (<1,500 ppm), in a few cases this
value was significantly exceeded. Peak CO2 levels exceeded 1,000 ppm in 65% of
monitored bedrooms during February, 59% during April and 35% during August.
Figure 4.1g. Peak living room CO2 levels in dwellings with MVHR
* Passivhaus dwellings
In the monitored MVHR living rooms, levels peaked above 1000ppm in 45% of
homes during February, 55% of homes during April and 23% of homes during
August, as illustrated in Figure 4.1g. In the majority of cases (73%) however, peak
levels did not exceed 1500ppm. Similar to the bedroom results, living room peak CO2
levels were highest in H17_c1 and H17_d1, suggesting particular problems with
ventilation rates in these homes.
4.2. Comparative relative humidity levels
One of the potential consequences of ventilation performance is the impact on
moisture in the buildings. Ventilation rates set in regulations are primarily designed to
control moisture (rather than a more general requirement of IAQ) so a comparison
may be made of relative humidity (RH) levels in MVHR and Non-MVHR dwellings. It
should be noted that the RH sample size was not identical to the CO2 data since a
larger dataset was available for MVHR dwellings compared to Non-MVHR dwellings.
The results are summarised in Tables 4.2a and 4.2b.
*
*
*
*
* * *
*
*
0
10
20
30
40
50
60
70
80
90
0
500
1000
1500
2000
2500
3000
FloorArea(m2)perperson
CarbonDioxide(ppm)
February, April and August 2013 Peak Living room CO2 Levels
Feb Peak CO2 Apr Peak CO2 Aug Peak CO2 Floor area (m2) per person
Characteristics and Performance of MVHR Systems: A Building Performance Evaluation Meta-Study 29
Table 4.2a. Living room relative humidity levels (%)
MVHR (n=34-36) Non-MVHR (n=15-17)
Minimum
RH
Peak
RH
Mean
RH
Range
of RH
Min RH
Peak
RH
Mean
RH
Range
of RH
Feb (mean) 30.9 44.7 37.3 13.8 22.0 48.3 31.7 26.3
Apr (mean) 29.1 47.4 37.9 18.3 20.6 47.6 31.2 26.9
Aug (mean) 42.0 56.8 49.5 14.8 33.8 57.3 44.5 23.5
Table 4.2b. Bedroom relative humidity levels (%)
MVHR (n=37-39) Non-MVHR (n=20-24)
Min
RH
Peak
RH
Mean
RH
Range
of RH
Min RH
Peak
RH
Mean
RH
Range
of RH
Feb (mean) 30.9 45.5 37.2 14.6 26.8 48.5 36.7 21.7
Apr (mean) 29.1 48.7 38.2 19.6 24.2 49.2 35.0 25.0
Aug (mean) 41.9 57.5 49.1 15.6 38.1 58.5 47.6 20.4
In general RH levels were within reasonable ranges, tending toward the lower end.
The average and minimum living room and bedroom RH levels (during February,
April and August) were generally higher in dwellings with MVHR systems but were
not at unduly extreme levels. However, these relationships are inverted when
considering temperature (Figure 4.2a), in general, dwellings with MVHR systems had
lower and more stable temperatures, which suggests that the RH is more a function
of temperature than ventilation in this data.
Characteristics and Performance of MVHR Systems: A Building Performance Evaluation Meta-Study 30
Figure 4.2a. February mean living room temperature and RH% (MVHR and Non MVHR)
* Passivhaus dwellings
However, a clear difference was in the range of relative humidity levels between
MVHR and Non-MVHR dwellings. In general RH levels were more stable during all
monitored seasons (see Table 4.2a and 4.2b) in the MVHR houses and this trend
was particularly evident during winter (Figures 4.2b and 4.2c).
* *
* * * * * *
* * * * * *
0
20
40
60
80
100
120
140
160
180
0
10
20
30
40
50
60
70
80
90 H3_h
H3_e
H9_b
H3_g
F11_a
H14_a
H17_b
H11_d
F11_c
F11_b
H11_a
H15_b
H14_b
H8_b
H11_c
H6_b
F11_d
H3_d
H19_b
H8_a
H11_b
F1_b
H17_d
F1_e
H15_c
F1_d
H9_a
H16_a
H19_a
H17_c
F19_a
H3_b
H15_a
H6_a
F7_b
H3_a
F4_b
F12_a
H20_b
H20_d
F7_c
F12_b
F7_a
H10_a
H20_c
H20_a
Totalfloorarea(m2)perperson
RelativeHumidity(%) February Mean Living Room Relative Humidity (MVHR and Non-MVHR)
Feb Mean (MVHR) Feb Mean (Non-MVHR) Total floor area (m2) per occupant
*
* * *
* * * *
* * * * * *
0
20
40
60
80
100
120
140
160
180
12
14
16
18
20
22
24
26
28
30
H9_a
H10_a
F12_b
H3_a
H15_c
H5_a
F11_b
H3_f
F4_b
H20_c
F1_d
F7_b
F4_a
F7_c
H3_e
F7_a
H20_b
H3_b
F11_d
F19_a
H8_b
H3_d
H11_c
H15_a
H3_h
F11_c
H11_b
H19_a
H14_b
H20_d
F11_a
H17_c
H16_a
F1_b
H19_b
H17_d
F1_e
H17_b
H11_d
H8_a
H3_g
H15_b
H14_a
H11_a
H6_b
H6_a
H9_b
Floorarea(m2)perperson
Temperature(°C)
February Mean Living Room Temperature (MVHR and Non-MVHR)
Feb Mean Temp (MVHR) Feb Mean Temp (Non-MVHR) Total floor area (m2) per person
Characteristics and Performance of MVHR Systems: A Building Performance Evaluation Meta-Study 31
Figure 4.2b. Range of February living room relative humidity levels
* Passivhaus dwellings
Figure 4.2c. Range of February bedroom relative humidity levels
* Passivhaus dwellings
*
* * * * *
* * * * * *
*
*
0
20
40
60
80
100
120
140
160
180
200
0
5
10
15
20
25
30
35
40
45
50 H20_a
H14_a
H9_b
H10_a
H3_b
H3_h
H3_a
H9_a
H3_d
H17_d
H20_c
F7_c
H16_a
H15_c
H14_b
H3_e
H20_b
F7_a
F1_b
F1_e
F7_b
F19_a
H17_b
F12_a
H8_b
H3_g
F1_d
H17_c
H11_d
F4_b
H15_b
H11_b
H11_c
H15_a
F11_c
H6_a
F11_a
H8_a
H6_b
H11_a
F11_b
H19_b
H19_a
H20_d
F11_d
Floorarea(m2)peroccupant
RelativeHumidity(%)
February Living Room Relative Humidity Range (MVHR and Non-MVHR)
Feb Range (MVHR) Feb Range (Non-MVHR) Total floor area (m2) per occupant
* *
*
* * * * * * * * *
* *
*
*
0
20
40
60
80
100
120
140
160
180
200
0
5
10
15
20
25
30
35
40
45
50
H9_a1
H14_a1
H3_h1
H3_f1
H20_c1
H3_f2
H3_h2
F7_c1
H3_e2
H20_b1
H3_e1
F12_a1
H3_g1
H15_a2
H17_d1
F7_b1
H15_c1
H17_d2
H3_g2
F1_b1
H9_a1
F12_b1
H3_a1
H8_b1
F7_a1
F1_d1
H15_a1
H11_d2
F11_b1
H17_b1
H19_b1
H11_c2
F19_a1
H20_d1
F11_c1
H17_c1
H15_b1
H15_c2
F4_b1
H11_d1
F11_a1
H11_c1
H11_b1
H11_b2
H11_a1
H8_a2
H6_a1
H6_b1
F11_d1
H8_a1
H16_a1
Totalfloorarea(m2)peroccupant
RelativeHumidity(%)
February Bedroom Relative Humidity Range (MVHR and Non-MVHR)
February Range (MVHR) February Range (Non-MVHR) Total floor area (m2) per occupant
Characteristics and Performance of MVHR Systems: A Building Performance Evaluation Meta-Study 32
4.2.1. Relative humidity in dwellings with MVHR
A more detailed analysis of the dwellings with MVHR systems found average and
peak living room levels were generally low (<70%) during February, April and August
months, as illustrated in Figure 4.2.d. Living room relative humidity levels were
highest during August, with the exception of H20_a, H20_b, H20_c. There does not
appear to be any association between Passivhaus and non-Passivhaus certified
dwellings, or between systems that were out of balance. Highest RH levels were
seen in August with 35% of MVHR dwellings recording peaks > 60% RH. As
indicated by the CO2 data this suggests high rates of window opening.
Figure 4.2.d. Average and peak living room relative humidity levels in MVHR dwellings
* Passivhaus dwellings
* *
* * * * * *
*
* * * * *
10
20
30
40
50
60
70
80
RelativeHumidity(%)
Average Living Room Relative Humidity Levels in MVHR dwellings
Feb Mean April Mean August Mean
*
* * * *
*
* * * * * * * *
10
20
30
40
50
60
70
80
RelativeHumidity(%)
Peak Living Room Relative Humidity Levels in MVHR dwellings
Feb Max April Max August Max
Characteristics and Performance of MVHR Systems: A Building Performance Evaluation Meta-Study 33
Figure 4.2e. Minimum living room relative humidity levels in dwellings with MVHR
* Passivhaus dwellings
Monitored relative humidity levels fell below 30%RH in 48% of living rooms during
February and 58% of living rooms during April (see Figure 4.2e). Average humidity
levels were below 30% in roughly a quarter of monitored living rooms during
February (26%) and April (23%) months.
Figure 4.2f. Peak bedroom relative humidity levels in dwellings with MVHR
* Passivhaus dwellings
In the bedrooms, average humidity levels remained below 70%, with levels peaking
above this in 15% of cases (Figure 4.2f). Figure 4.2g shows the percentage of rooms
that had average relative humidity levels between 40 and 60%. It is apparent that low
RH is common in MVHR dwellings during the heating season.
* * * * *
* * *
* *
* * *
*
0
10
20
30
40
50
60
70
80
RelativeHumidity(%)
Minimum Living Room Relative Humidity Levels in MVHR dwellings
Feb Minimum April Minimum August Minimum
*
*
*
*
* *
*
*
*
* *
* *
*
*
*
0
10
20
30
40
50
60
70
80
H14_a1
H3_e2
H3_h1
H3_e1
H3_h2
H3_g2
H17_d1
H3_g1
H17_b1
H3_f1
H8_b1
H3_f2
F1_b1
H17_d2
F1_d1
H15_c1
F12_a1
H17_c1
H3_a1
H10_a1
F7_b1
H15_c2
H9_a1
H20_b1
F4_b1
F7_c1
F12_b1
H8_a2
F7_a1
H8_a1
H20_d1
H20_c1
H16_a1
RelativeHumidity(%)
Peak Bedroom Relative Humidity Levels in MVHR dwellings
February Peak April Peak August Peak
Characteristics and Performance of MVHR Systems: A Building Performance Evaluation Meta-Study 34
Figure 4.2g. Average relative humidity levels in dwellings with MVHR
4.3. Comparative indoor temperatures
Data on temperature is summarised in Tables 4.3a and 4.3b. An observation of this
data is that in general average temperatures were higher in Non-MVHR dwellings
during February and April, but higher in MVHR dwellings during summer. These
findings may help to explain the higher relative humidity levels observed in MVHR
dwellings (compared to Non-MVHR dwellings) during February and April.
Table 4.3a. Living room temperature levels (°C)
MVHR (n=34-35) Non-MVHR (n=15-17)
Min
temp
Peak
temp
Mean
temp
Range
of temp
Min
temp
Peak
temp
Mean
temp
Range
of temp
Feb (mean) 18.7 23.3 21.1 4.6 18.2 27.3 22.8 9.1
Apr (mean) 18.7 23.5 21.3 4.8 17.9 28.4 23.0 10.4
Aug (mean) 22.5 26.2 24.2 3.7 20.5 27.7 23.5 7.2
Table 4.3b. Bedroom temperature levels (°C)
MVHR (n=42-45) Non-MVHR (n=21-24)
Min
temp
Peak
temp
Mean
temp
Range
of temp
Min
temp
Peak
temp
Mean
temp
Range
of temp
Feb (mean) 18.0 22.5 20.3 4.4 17.9 24.8 21.6 6.9
Apr (mean) 18.2 22.8 20.7 4.7 18.3 25.7 22.3 7.4
Aug (mean) 22.3 26.1 24.1 3.9 20.2 26.2 23.2 6.0
0%
20%
40%
60%
80%
100%
Bedroom Living room Bedroom Living room Bedroom Living room
February April August
Percentageofmonitoredrooms
Average Relative Humidity Levels in MVHR dwellings
RH <40% RH >40%, <60% RH >60%
Characteristics and Performance of MVHR Systems: A Building Performance Evaluation Meta-Study 35
Correspondingly, an analysis of peak temperatures found higher levels in Non-MVHR
dwellings when compared to MVHR dwellings. This trend was most evident in the
monitored living rooms during February, (Figure 4.3a). Higher average and peak
temperatures during February in Non-MVHR dwellings may be attributed to a number
of factors, including oversizing of heating systems in Non-MVHR homes or a lack of
awareness of the post heater (where available) in the dwellings with MVHR systems.
Average temperatures in MVHR dwellings were closed to the expected norms, so
this suggests a tendency for overheating in non-MVHR dwellings. Nevertheless,
incidences of high temperatures were also observed in MVHR dwellings.
Figure 4.3a. Peak February living room temperatures in MVHR and Non MVHR homes
* Passivhaus dwellings
As with the data on relative humidity, an apparent trend is for houses with MVHR
systems to have greater temperature stability, with a greater dispersion of indoor
hygrothermal conditions found in dwellings without MVHR systems. For example,
Figures 4.3b and 4.3c present the range of living room temperatures during April and
August months. Despite the small sample size and uneven sample numbers, the
tendency towards lower temperature ranges in MVHR dwellings is clear.
*
*
* * *
* * *
*
*
*
* *
*
0
20
40
60
80
100
120
140
160
180
200
14
16
18
20
22
24
26
28
30
32
34
H9_a
H10_a
F12_b
H3_a
F4_b
H3_f
F1_d
F4_a
F7_c
H5_a
H20_b
H20_c
F7_a
H3_e
H3_d
H15_c
H3_b
F7_b
H8_b
H14_b
F1_b
H3_h
F1_e
H16_a
H15_a
F11_d
H14_a
F19_a
H11_b
H3_g
H8_a
H11_d
F11_c
H19_a
H17_c
H19_b
H17_d
H11_c
H9_b
H15_b
H11_a
H6_b
H6_a
F11_a
H20_d
H17_b
F11_b
Totalfloorare(m2)perperson
Temperature(°C)
February Peak Living Room Temperature (MVHR and Non-MVHR)
Feb Peak Temp (MVHR) Feb Peak Temp (Non-MVHR) Total floor area (m2) per person
Characteristics and Performance of MVHR Systems: A Building Performance Evaluation Meta-Study 36
Figure 4.3b. Range of April living room temperatures in MVHR and Non MVHR homes
* Passivhaus dwellings
Figure 4.3c. Range of August living room temperatures in MVHR and Non MVHR homes
* Passivhaus dwellings
The temperatures observed in the MVHR dwellings were closer to optimal conditions.
This may be affected by the prevalence of Passivhaus dwellings in this cohort, but
may also be due to poor performance in non-MVHR houses which may have
oversized and poorly controlled heating systems.
Whilst it may be considered that having stable temperatures close to optimum
conditions is beneficial in terms of energy consumption and indoor comfort, a growing
body of research suggests that temperature fluctuations may in fact be beneficial for
* * * * * *
* *
*
*
* *
*
*
0
20
40
60
80
100
120
140
160
180
200
0
2
4
6
8
10
12
14
16
18
20 F4_a
F4_b
F7_a
F1_d
H14_b
H8_a
H20_b
H3_d
H3_h
F7_c
F1_b
H9_b
H3_b
H3_e
H8_b
H3_f
H14_a
H6_a
H3_g
F7_b
F12_b
H20_c
H20_d
H10_a
F1_e
H16_a
H6_b
H9_a
H5_a
H15_a
F11_d
H17_d
H17_c
H19_a
H15_c
F19_a
H3_a
H11_c
F11_a
H11_b
H17_b
H15_b
H11_a
H11_d
H19_b
F11_c
F11_b
Totalfloorare(m2)perperson
Temperature(°C)
April Living Room Temperature Range (MVHR and Non-MVHR)
Apr Temp Range (MVHR) Apr Temp Range (Non-MVHR) Total floor area (m2) per person
* * * * * * *
*
* *
* * *
*
0
20
40
60
80
100
120
140
160
180
200
0
2
4
6
8
10
12
14
16
18
20
F1_d
F12_b
F7_a
F7_c
F7_b
H8_a
F4_a
H14_a
H16_a
H10_a
F1_b
H3_f
H20_c
F4_b
H3_b
H5_a
H20_d
H3_g
H3_h
H3_e
H20_b
F1_e
H3_d
H14_b
H8_b
H6_a
H15_a
H3_a
H9_a
H9_b
H6_b
H17_c
H15_c
H17_d
H11_d
F19_a
H19_a
H15_b
F11_c
F11_b
H11_b
F11_d
H17_b
H11_c
H19_b
F11_a
H11_a
Totalfloorare(m2)perperson
Temperaturerange(°C)
August Living Room Temperature Range (MVHR and Non-MVHR)
Aug Temp Range (MVHR) Aug Temp Range (Non-MVHR) Total floor area (m2) per person
Characteristics and Performance of MVHR Systems: A Building Performance Evaluation Meta-Study 37
health11
and that lack of temperature stimulation indoors may result in thermal
monotony12
. This may be particularly problematic during the summer season if
occupants are exposed to repeatedly high temperatures indoors.
In summer a differentiation between MVHR and non-MVHR was less clear (see
appendix B), with some MVHR houses having very high peak temperatures. Whilst
the overall trend for MVHR houses is positive, there are outliers where conditions are
poorer.
4.3.1. Indoor temperatures in dwellings with MVHR
Looking at the MVHR houses only, no obvious trends were apparent in terms of
Passivhaus or system balance. Figures 4.3d and 4.3e present average and peak
bedroom temperatures in dwellings with MVHR systems. It should be acknowledged
that these values are for the whole month, therefore are likely to include significant
periods of time where the rooms were unoccupied.
Figure 4.3d. Average bedroom temperatures in dwellings with MVHR
* Passivhaus dwellings
Without detailed occupancy data and external weather data, it may not be applicable
to compare measured indoor temperatures with comfort criteria. Nevertheless, it is
important to highlight that average temperatures exceeded 25°C (Passivhaus
overheating criteria) during August in 18% of MVHR bedrooms, with peak levels
exceeding 28°C in 11% (Figure 4.3e).
11
van Marken Lichtenbelt, Wouter D (2015) To Comfort Or Not to Comfort, Keynote Presentation at
Healthy Buildings Conference, Eindhoven, 18-20th may, 2015.
12
de Dear, RJ and Brager, GS (2002) Thermal comfort in naturally ventilated buildings: revisions to
ASHRAE Standard 55. Energy and Buildings 34(6): 549-561.
*
* * * * * * *
* * * * * * * * *
8
10
12
14
16
18
20
22
24
26
28
30
H8_b1
H10_a1
H15_c1
H3_d1
H14_b1
H14_a1
H3_e2
F4_b1
F12_a1
H3_c2
F7_a1
H3_e1
H16_a1
H3_f1
H15_c2
H3_h1
H3_a1
H3_h2
H3_c1
H3_f2
H3_g1
H20_d1
H3_g2
H17_c1
F7_c1
H9_a1
H8_a1
F12_b1
H20_a1
H20_b1
H17_b1
F7_b1
H8_a2
H17_d1
H17_d2
H20_c1
F1_b1
F1_d1
Temperature(°C)
Average Bedroom Temperatures (MVHR dwellings)
Feb Mean April Mean August Mean
Characteristics and Performance of MVHR Systems: A Building Performance Evaluation Meta-Study 38
Figure 4.3e. Peak bedroom temperatures in dwellings with MVHR
* Passivhaus dwellings
Figure 4.3f. Average living room temperatures in MVHR dwellings
* Passivhaus dwellings
Correspondingly, in the monitored living rooms (Figures 4.3f and 4.3g), average
temperatures exceeded 25°C in 31% of MVHR dwellings during August, with levels
peaking above 28°C in 16%. These results suggest issues with summertime
overheating in a number of the MVHR dwellings. This may be attributed to a lack of
summer by-pass capabilities in some homes, or systems being disabled in the
summer, which is also suggested by the CO2 and RH data. Whilst this may be
expected, or indeed planned, it raises questions about the effectiveness of this in
certain rooms which may be less tolerant of window opening due to issues of noise
or security. It is interesting to note that despite the majority of dwellings
demonstrating temperature distinctions between seasons, some dwellings appear to
maintain constant temperatures year round, with average February or April
temperatures exceeding August temperatures in some cases.
* * * * * * * * * * *
* * * * * *
8
10
12
14
16
18
20
22
24
26
28
30
H8_b1
H15_c1
F7_a1
H10_a1
F4_b1
F12_a1
H14_b1
H14_a1
H16_a1
H3_e1
H3_c2
H15_c2
H3_h1
H3_d1
F7_c1
H3_e2
F12_b1
H3_g1
H3_h2
H3_g2
H3_f1
F7_b1
H20_d1
H3_f2
H3_c1
H17_c1
H8_a2
H8_a1
H20_b1
H20_a1
F1_d1
H9_a1
H3_a1
F1_b1
H20_c1
H17_d2
H17_b1
H17_d1
Temperature(°C)
Peak Bedroom Temperatures (MVHR dwellings)
Feb Peak April Peak August Peak
* *
* *
* * * * * * * * * *
8
10
12
14
16
18
20
22
24
26
28
30
H8_b
H10_a
H3_a
H14_b
H15_c
F4_b
H3_e
H16_a
H3_d
H20_d
F7_a
H17_b
H17_c
F4_a
H14_a
H3_f
H9_a
H3_h
H3_g
F12_b
F7_c
H20_b
H3_b
H17_d
F7_b
H9_b
H5_a
H8_a
F1_d
H20_c
F1_b
F1_e
Temperature(°C)
Average Living Room Temperature (MVHR dwellings)
Feb Mean April Mean August Mean
Characteristics and Performance of MVHR Systems: A Building Performance Evaluation Meta-Study 39
Figure 4.3g. Peak living room temperatures in MVHR dwellings
* Passivhaus dwellings
4.4. Comparative vapour pressure levels
Given the anomalies with regard to RH and temperature data, this data was used to
calculate vapour pressure levels in the dwelling as a means to identify possible risks
associated with moisture. Vapour Pressure (VP) levels in the monitored dwellings
were calculated using the following equation:
𝑒 𝑜
= 0.6108 𝑒𝑥𝑝 ((17.27 × 𝑇)/(𝑇 + 273.15))
𝑒 𝑎
= (𝑅𝐻/100) × 𝑒 𝑜
Where:
𝑒 𝑜
= Saturation Vapour Pressure (kPa)
𝑇 = Temperature (° C)
𝑒 𝑎
= Actual Vapour Pressure (kPa)
𝑅𝐻 = Relative Humidity (%)
Summary data is shown in Tables 4.4a and 4.4b. There is a noticeable difference
between average, peak and range of VP in MVHR and Non-MVHR dwellings (see for
example Figure 4.4a), which corresponds to the findings from the temperature and
relative humidity analysis. Figure 4.4b illustrates the average VP across MVHR and
non-MVHR houses during August. Mean August vapour pressure levels were
significantly lower in MVHR dwellings, with some notable exceptions, and the range
in VP is also generally smaller in houses with MVHR. This supports the premise that
use of an MVHR system may help to provide greater level of stability of hygrothermal
conditions indoors, when compared to natural or Mechanical Extract Ventilation
strategies.
* * * *
* * * * *
* * * * *
8
10
12
14
16
18
20
22
24
26
28
30 H10_a
H8_b
H14_b
F7_a
F4_b
H3_a
H16_a
H14_a
F12_b
F4_a
H3_e
H20_d
H3_f
F7_c
H3_d
H15_c
F7_b
H17_c
H3_g
H3_h
F1_d
H8_a
H3_b
H5_a
H9_a
H20_b
H20_c
F1_b
H17_d
H17_b
H9_b
F1_e
Temperature(°C)
Peak Living Room Temperature (MVHR dwellings)
Feb Peak April Peak August Peak
Characteristics and Performance of MVHR Systems: A Building Performance Evaluation Meta-Study 40
Table 4.4a. Living room vapour pressure (kPa)
MVHR (n=31-34) Non-MVHR (n=15-17)
Min
VP
Peak
VP
Mean
VP
Range
of VP
Min VP
Peak
VP
Mean
VP
Range
of VP
Feb (mean) 0.64 1.25 0.90 0.61 0.47 1.76 0.88 1.29
Apr (mean) 0.61 1.36 0.95 0.74 0.43 1.82 0.88 1.39
Aug (mean) 1.15 1.92 1.49 0.78 0.82 2.12 1.29 1.30
Table 4.4b. Bedroom vapour pressure (kPa)
MVHR (n=33-37) Non-MVHR (n=19-22)
Min
VP
Peak
VP
Mean
VP
Range
of VP
Min VP
Peak
VP
Mean
VP
Range
of VP
Feb (mean) 0.65 1.29 0.90 0.63 0.52 1.54 0.93 1.02
Apr (mean) 0.61 1.37 0.94 0.76 0.51 1.61 0.94 1.10
Aug (mean) 1.15 1.98 1.49 0.83 0.90 1.98 1.34 1.08
Figure 4.4a. February living room vapour pressure ranges in MVHR and Non-MVHR homes
* Passivhaus dwellings
*
**
***
** **
**
* *
*
0
20
40
60
80
100
120
140
160
180
0.0
0.2
0.4
0.6
0.8
1.0
1.2
1.4
1.6
1.8
2.0
2.2
2.4
F7_c
H9_a
H3_a
H3_d
H10_a
H14_a
H3_b
H3_h
H9_b
H3_e
H20_b
F7_a
H14_b
F12_b
F1_d
F2_a
H3_c
F4_a
F1_b
F4_b
F12_a
H8_b
H20_c
F2_b
F7_b
H15_c
H16_a
F1_e
H3_g
H5_a
H17_a
H17_d
H11_d
F19_a
H11_b
H15_a
H17_b
H15_b
H17_c
F11_c
H8_a
H11_c
H6_a
F11_a
H6_b
H11_a
F11_d
H19_b
H19_a
H20_d
F11_b
Floorarea(m2)perperson
Actualvapourpressure(kPa)
February Living Room Vapour Pressure Range (MVHR and Non-MVHR)
Feb Range (MVHR) Feb Range (Non-MVHR) Floor area (m2) per person
Characteristics and Performance of MVHR Systems: A Building Performance Evaluation Meta-Study 41
Figure 4.4b. August mean bedroom vapour pressure in MVHR and Non-MVHR homes
* Passivhaus dwellings
Vapour pressure levels followed the same trends as temperature and RH data
generally – non MVHR houses had lower range of VP levels, but some outliers were
observed. Whilst the observation of the RH levels did not indicate conditions that
would lead to problems of dampness in general, there is a concern that higher
temperatures in thermally efficient dwellings may be masking an underlying moisture
problem, particularly in relation to proliferation of dust mite populations. To test this,
data was plotted against the Critical Equilibrium Humidity (CEH) levels for
Dermatophagoides pteronyssinus and Dermatophagoides farina, common dust mite
species of the UK and USA13
. PEH refers to Population Equilibrium Humidity, which
is the percentage relative humidity at a given temperature at which house dust mite
populations neither propagate nor decline14
.
13
Arlian LG (1992) Water balance and humidity requirements of house dust mites. Experimental &
Applied Acarology 16(1-2): 15-35.
14
Crowther D, Wilkinson T, Biddulph P, Oreszczyn T, Pretlove S and Ridley I (2006) A simple model
for predicting the effect of hygrothermal conditions on populations of house dust mite
Dermatophagoides pteronyssinus (Acari: Pyroglyphidae). Experimental & Applied Acarology 39(2):
127-148
*
*
**
* ** **** *****
0
20
40
60
80
100
120
140
160
180
0.4
0.6
0.8
1.0
1.2
1.4
1.6
1.8
2.0
2.2 F11_a1
H14_a1
F11_b1
H3_e2
H11_d2
H3_h1
H3_h2
H11_c2
H3_e1
H11_c1
H3_f1
H6_a1
H11_d1
H11_b1
H3_f2
H11_a1
H3_g1
H6_b1
H15_c1
H15_b1
H3_g2
H16_a1
H19_b1
F11_d1
F19_a1
H15_a2
H15_c2
H17_d1
H15_a1
H10_a1
H9_a1
F11_c1
H17_b1
H17_c1
H11_b2
H17_d2
H8_b1
H8_a2
H8_a1
H3_a1
F12_a1
F7_a1
F7_b1
F7_c1
F12_b1
H20_b1
H20_d1
F4_b1
F1_b1
F1_d1
H20_c1
Floorarea(m2)perperson
ActualVapourPressure(kPa)
August Mean Bedroom Vapour Pressure (MVHR and Non-MVHR)
August Mean (MVHR) August Mean (Non- MVHR) Floor area (m2) per person
Characteristics and Performance of MVHR Systems: A Building Performance Evaluation Meta-Study 42
Figure 4.4c. February master bedroom mean temperature and relative humidity levels
Figure 4.4d. April master bedroom mean temperature and relative humidity levels
F7_a
F7_c
H20_c
H20_d
H6_b
20
30
40
50
60
70
80
15 17 19 21 23 25 27 29 31
RelativeHumidity(%)
Temperature (°C)
February Mean Master Bedroom Temperature & RH Conditions
7g/kg / 1.13kPa
CEH min (DF2)
CEH min (DP2)
PEH
MVHR
Non-MVHR
H20_c
H20_d
20
30
40
50
60
70
80
15 17 19 21 23 25 27 29 31
RelativeHumidity(%)
Temperature (°C)
April Mean Master Bedroom Temperature & RH Conditions
7g/kg / 1.13kPa
CEH min (DF2)
CEH min (DP2)
PEH
MVHR
Non-MVHR
Characteristics and performance of MVHR systems

Mais conteúdo relacionado

Mais procurados

Viscosity test of bitumen
Viscosity test of bitumenViscosity test of bitumen
Viscosity test of bitumenAmrit pandit
 
Mix Design of Concrete
Mix Design of ConcreteMix Design of Concrete
Mix Design of ConcreteVivek Das
 
Performance Evaluation of Hot Mix Asphalt with Recycled Asphalt Pavement usin...
Performance Evaluation of Hot Mix Asphalt with Recycled Asphalt Pavement usin...Performance Evaluation of Hot Mix Asphalt with Recycled Asphalt Pavement usin...
Performance Evaluation of Hot Mix Asphalt with Recycled Asphalt Pavement usin...Basavaraj
 
Stabilization of soil using bitumenous emulsions
Stabilization of soil using bitumenous emulsionsStabilization of soil using bitumenous emulsions
Stabilization of soil using bitumenous emulsionsprashanth kumar
 
Properties of aggregrate
Properties of aggregrateProperties of aggregrate
Properties of aggregrateNIT Warangal
 
Cement concrete-technology
Cement concrete-technologyCement concrete-technology
Cement concrete-technologyrashid5733
 
Isolation Of Foundation fron swelling zone By CNS (Cohesive Non-Swelling) Soil
Isolation Of Foundation fron swelling zone By CNS (Cohesive Non-Swelling) SoilIsolation Of Foundation fron swelling zone By CNS (Cohesive Non-Swelling) Soil
Isolation Of Foundation fron swelling zone By CNS (Cohesive Non-Swelling) SoilStudent
 
Compressive strength in concrete test
Compressive strength in concrete testCompressive strength in concrete test
Compressive strength in concrete testSelva Prakash
 
CON 122 Session 4 - Water Reducing & Set Controlling Admixtures
CON 122 Session 4 - Water Reducing & Set Controlling AdmixturesCON 122 Session 4 - Water Reducing & Set Controlling Admixtures
CON 122 Session 4 - Water Reducing & Set Controlling Admixturesalpenaccedu
 
Aggregate impact value test
Aggregate impact value testAggregate impact value test
Aggregate impact value testAdarsh Shukla
 
Methods Of Soil stabilization
Methods Of Soil stabilizationMethods Of Soil stabilization
Methods Of Soil stabilizationShubhamGiri24
 
Subgrade soil test, by Micotol
Subgrade soil test, by MicotolSubgrade soil test, by Micotol
Subgrade soil test, by MicotolMicotol
 
Concrete lab manual - Polytechnics
Concrete lab manual - PolytechnicsConcrete lab manual - Polytechnics
Concrete lab manual - PolytechnicsSHAMJITH KM
 
Durability and Permeability of Concrete
Durability  and Permeability of ConcreteDurability  and Permeability of Concrete
Durability and Permeability of ConcreteGAURAV. H .TANDON
 
MASS CONCRETE
MASS CONCRETEMASS CONCRETE
MASS CONCRETESATISH
 
Study of design of the flexible pavements ppt
Study of design of the flexible pavements pptStudy of design of the flexible pavements ppt
Study of design of the flexible pavements pptShaik Asif Ahmed
 

Mais procurados (20)

Viscosity test of bitumen
Viscosity test of bitumenViscosity test of bitumen
Viscosity test of bitumen
 
Prestressed concrete continuous beam
Prestressed concrete continuous beamPrestressed concrete continuous beam
Prestressed concrete continuous beam
 
Mix Design of Concrete
Mix Design of ConcreteMix Design of Concrete
Mix Design of Concrete
 
Performance Evaluation of Hot Mix Asphalt with Recycled Asphalt Pavement usin...
Performance Evaluation of Hot Mix Asphalt with Recycled Asphalt Pavement usin...Performance Evaluation of Hot Mix Asphalt with Recycled Asphalt Pavement usin...
Performance Evaluation of Hot Mix Asphalt with Recycled Asphalt Pavement usin...
 
Bulk density and bulking of fine and coarse aggregate
Bulk density and bulking of fine and coarse aggregateBulk density and bulking of fine and coarse aggregate
Bulk density and bulking of fine and coarse aggregate
 
Stabilization of soil using bitumenous emulsions
Stabilization of soil using bitumenous emulsionsStabilization of soil using bitumenous emulsions
Stabilization of soil using bitumenous emulsions
 
Properties of aggregrate
Properties of aggregrateProperties of aggregrate
Properties of aggregrate
 
Cement concrete-technology
Cement concrete-technologyCement concrete-technology
Cement concrete-technology
 
Hardened Concrete
Hardened ConcreteHardened Concrete
Hardened Concrete
 
Isolation Of Foundation fron swelling zone By CNS (Cohesive Non-Swelling) Soil
Isolation Of Foundation fron swelling zone By CNS (Cohesive Non-Swelling) SoilIsolation Of Foundation fron swelling zone By CNS (Cohesive Non-Swelling) Soil
Isolation Of Foundation fron swelling zone By CNS (Cohesive Non-Swelling) Soil
 
Compressive strength in concrete test
Compressive strength in concrete testCompressive strength in concrete test
Compressive strength in concrete test
 
CON 122 Session 4 - Water Reducing & Set Controlling Admixtures
CON 122 Session 4 - Water Reducing & Set Controlling AdmixturesCON 122 Session 4 - Water Reducing & Set Controlling Admixtures
CON 122 Session 4 - Water Reducing & Set Controlling Admixtures
 
Aggregate impact value test
Aggregate impact value testAggregate impact value test
Aggregate impact value test
 
Methods Of Soil stabilization
Methods Of Soil stabilizationMethods Of Soil stabilization
Methods Of Soil stabilization
 
Subgrade soil test, by Micotol
Subgrade soil test, by MicotolSubgrade soil test, by Micotol
Subgrade soil test, by Micotol
 
Concrete lab manual - Polytechnics
Concrete lab manual - PolytechnicsConcrete lab manual - Polytechnics
Concrete lab manual - Polytechnics
 
Mix design
Mix designMix design
Mix design
 
Durability and Permeability of Concrete
Durability  and Permeability of ConcreteDurability  and Permeability of Concrete
Durability and Permeability of Concrete
 
MASS CONCRETE
MASS CONCRETEMASS CONCRETE
MASS CONCRETE
 
Study of design of the flexible pavements ppt
Study of design of the flexible pavements pptStudy of design of the flexible pavements ppt
Study of design of the flexible pavements ppt
 

Semelhante a Characteristics and performance of MVHR systems

Asu December 2010 Application For Bio Pcm
Asu December 2010 Application For Bio PcmAsu December 2010 Application For Bio Pcm
Asu December 2010 Application For Bio Pcmenergy4you
 
Verification of a Thermal Model for Affordable Solar Assisted Biogas Digester...
Verification of a Thermal Model for Affordable Solar Assisted Biogas Digester...Verification of a Thermal Model for Affordable Solar Assisted Biogas Digester...
Verification of a Thermal Model for Affordable Solar Assisted Biogas Digester...Vergil Weatherford, P.E.
 
The Design and Build of Biodigester Toilet
The Design and Build of Biodigester Toilet The Design and Build of Biodigester Toilet
The Design and Build of Biodigester Toilet Natasha Rayan
 
Evaluating Environmental Performance in Low-Carbon Energy Systems
Evaluating Environmental Performance in Low-Carbon Energy SystemsEvaluating Environmental Performance in Low-Carbon Energy Systems
Evaluating Environmental Performance in Low-Carbon Energy SystemsLeonardo ENERGY
 
UCHILE_M_Sc_Thesis_final
UCHILE_M_Sc_Thesis_finalUCHILE_M_Sc_Thesis_final
UCHILE_M_Sc_Thesis_finalGustavo Pabon
 
UCHILE_M_Sc_Thesis_final
UCHILE_M_Sc_Thesis_finalUCHILE_M_Sc_Thesis_final
UCHILE_M_Sc_Thesis_finalGustavo Pabon
 
Experimental Investigation of Optimal Aerodynamics of a Flying Wing UAV(Link)
Experimental Investigation of Optimal Aerodynamics of a Flying Wing UAV(Link)Experimental Investigation of Optimal Aerodynamics of a Flying Wing UAV(Link)
Experimental Investigation of Optimal Aerodynamics of a Flying Wing UAV(Link)Baba Kakkar
 
MSc_Thesis_ORR
MSc_Thesis_ORRMSc_Thesis_ORR
MSc_Thesis_ORROscar Ram
 
FULLTEXT01 (1).pdf
FULLTEXT01 (1).pdfFULLTEXT01 (1).pdf
FULLTEXT01 (1).pdfssuser9c6e31
 
IITBMastersReport
IITBMastersReportIITBMastersReport
IITBMastersReportPranav Shah
 
Thesis-MitchellColgan_LongTerm_PowerSystem_Planning
Thesis-MitchellColgan_LongTerm_PowerSystem_PlanningThesis-MitchellColgan_LongTerm_PowerSystem_Planning
Thesis-MitchellColgan_LongTerm_PowerSystem_PlanningElliott Mitchell-Colgan
 
Thesis_Eddie_Zisser_final_submission
Thesis_Eddie_Zisser_final_submissionThesis_Eddie_Zisser_final_submission
Thesis_Eddie_Zisser_final_submissionEddie Zisser
 

Semelhante a Characteristics and performance of MVHR systems (20)

Asu December 2010 Application For Bio Pcm
Asu December 2010 Application For Bio PcmAsu December 2010 Application For Bio Pcm
Asu December 2010 Application For Bio Pcm
 
CDP FINAL REPORT
CDP FINAL REPORTCDP FINAL REPORT
CDP FINAL REPORT
 
JPMthesis
JPMthesisJPMthesis
JPMthesis
 
Verification of a Thermal Model for Affordable Solar Assisted Biogas Digester...
Verification of a Thermal Model for Affordable Solar Assisted Biogas Digester...Verification of a Thermal Model for Affordable Solar Assisted Biogas Digester...
Verification of a Thermal Model for Affordable Solar Assisted Biogas Digester...
 
Master_Thesis
Master_ThesisMaster_Thesis
Master_Thesis
 
Knapp_Masterarbeit
Knapp_MasterarbeitKnapp_Masterarbeit
Knapp_Masterarbeit
 
Black_book
Black_bookBlack_book
Black_book
 
HDR_APC_INPT_dec2012
HDR_APC_INPT_dec2012HDR_APC_INPT_dec2012
HDR_APC_INPT_dec2012
 
The Design and Build of Biodigester Toilet
The Design and Build of Biodigester Toilet The Design and Build of Biodigester Toilet
The Design and Build of Biodigester Toilet
 
Evaluating Environmental Performance in Low-Carbon Energy Systems
Evaluating Environmental Performance in Low-Carbon Energy SystemsEvaluating Environmental Performance in Low-Carbon Energy Systems
Evaluating Environmental Performance in Low-Carbon Energy Systems
 
UCHILE_M_Sc_Thesis_final
UCHILE_M_Sc_Thesis_finalUCHILE_M_Sc_Thesis_final
UCHILE_M_Sc_Thesis_final
 
UCHILE_M_Sc_Thesis_final
UCHILE_M_Sc_Thesis_finalUCHILE_M_Sc_Thesis_final
UCHILE_M_Sc_Thesis_final
 
report
reportreport
report
 
Experimental Investigation of Optimal Aerodynamics of a Flying Wing UAV(Link)
Experimental Investigation of Optimal Aerodynamics of a Flying Wing UAV(Link)Experimental Investigation of Optimal Aerodynamics of a Flying Wing UAV(Link)
Experimental Investigation of Optimal Aerodynamics of a Flying Wing UAV(Link)
 
MSc_Thesis_ORR
MSc_Thesis_ORRMSc_Thesis_ORR
MSc_Thesis_ORR
 
thesis
thesisthesis
thesis
 
FULLTEXT01 (1).pdf
FULLTEXT01 (1).pdfFULLTEXT01 (1).pdf
FULLTEXT01 (1).pdf
 
IITBMastersReport
IITBMastersReportIITBMastersReport
IITBMastersReport
 
Thesis-MitchellColgan_LongTerm_PowerSystem_Planning
Thesis-MitchellColgan_LongTerm_PowerSystem_PlanningThesis-MitchellColgan_LongTerm_PowerSystem_Planning
Thesis-MitchellColgan_LongTerm_PowerSystem_Planning
 
Thesis_Eddie_Zisser_final_submission
Thesis_Eddie_Zisser_final_submissionThesis_Eddie_Zisser_final_submission
Thesis_Eddie_Zisser_final_submission
 

Mais de Innovate UK

@Iuk comp mediatoolkit_jul20
@Iuk comp mediatoolkit_jul20@Iuk comp mediatoolkit_jul20
@Iuk comp mediatoolkit_jul20Innovate UK
 
UK - Norway plugin vehicle roundtable summary report
UK - Norway plugin vehicle roundtable summary reportUK - Norway plugin vehicle roundtable summary report
UK - Norway plugin vehicle roundtable summary reportInnovate UK
 
Plugin vehicle 2025 stakeholder success vision updated October 2017
Plugin vehicle 2025 stakeholder success vision updated October 2017Plugin vehicle 2025 stakeholder success vision updated October 2017
Plugin vehicle 2025 stakeholder success vision updated October 2017Innovate UK
 
Plugin vehicle stakeholder vision September 2017
Plugin vehicle stakeholder vision September 2017Plugin vehicle stakeholder vision September 2017
Plugin vehicle stakeholder vision September 2017Innovate UK
 
Innovate UK's monitoring services procurement - engagement event slides
Innovate UK's monitoring services procurement - engagement event slidesInnovate UK's monitoring services procurement - engagement event slides
Innovate UK's monitoring services procurement - engagement event slidesInnovate UK
 
Innovate UK's monitoring services procurement - full briefing pack
Innovate UK's monitoring services procurement - full briefing packInnovate UK's monitoring services procurement - full briefing pack
Innovate UK's monitoring services procurement - full briefing packInnovate UK
 
Company pitching Powerpoint slide template
Company pitching Powerpoint slide templateCompany pitching Powerpoint slide template
Company pitching Powerpoint slide templateInnovate UK
 
Horizon 2020 space – Mapping of UK university expertise and resources against...
Horizon 2020 space – Mapping of UK university expertise and resources against...Horizon 2020 space – Mapping of UK university expertise and resources against...
Horizon 2020 space – Mapping of UK university expertise and resources against...Innovate UK
 
Innovate uk Horizons Sustainable Economy Framework,
Innovate uk Horizons Sustainable Economy Framework,Innovate uk Horizons Sustainable Economy Framework,
Innovate uk Horizons Sustainable Economy Framework,Innovate UK
 
The Wales Space Strategy John Whalley
The Wales Space Strategy John WhalleyThe Wales Space Strategy John Whalley
The Wales Space Strategy John WhalleyInnovate UK
 
Connected digital additive manufacturing competition briefing
Connected digital additive manufacturing competition briefingConnected digital additive manufacturing competition briefing
Connected digital additive manufacturing competition briefingInnovate UK
 
Rft f data for apr 2016 charts
Rft f data for apr 2016 chartsRft f data for apr 2016 charts
Rft f data for apr 2016 chartsInnovate UK
 
Insights from social housing projects: building performance evaluation
Insights from social housing projects: building performance evaluationInsights from social housing projects: building performance evaluation
Insights from social housing projects: building performance evaluationInnovate UK
 
Uk Research Infrastructure Workshop E-infrastructure Juan Bicarregui
Uk Research Infrastructure Workshop E-infrastructure Juan BicarreguiUk Research Infrastructure Workshop E-infrastructure Juan Bicarregui
Uk Research Infrastructure Workshop E-infrastructure Juan BicarreguiInnovate UK
 
Research Infrastructures Draft Work Programme 2016-2017
Research Infrastructures Draft Work Programme 2016-2017Research Infrastructures Draft Work Programme 2016-2017
Research Infrastructures Draft Work Programme 2016-2017Innovate UK
 
European Long-term Ecosystem and Socio Ecological Research Infrastructure (eL...
European Long-term Ecosystem and Socio Ecological Research Infrastructure (eL...European Long-term Ecosystem and Socio Ecological Research Infrastructure (eL...
European Long-term Ecosystem and Socio Ecological Research Infrastructure (eL...Innovate UK
 
The economic impact of the marine and maritime sector on the UK in 2011/12
The economic impact of the marine and maritime sector on the UK in 2011/12The economic impact of the marine and maritime sector on the UK in 2011/12
The economic impact of the marine and maritime sector on the UK in 2011/12Innovate UK
 
Autocar, Low Carbon Vehicles: The UK's innovation success story
Autocar, Low Carbon Vehicles: The UK's innovation success story Autocar, Low Carbon Vehicles: The UK's innovation success story
Autocar, Low Carbon Vehicles: The UK's innovation success story Innovate UK
 
Design for Future Climate: Adapting Buildings, June 2010
Design for Future Climate: Adapting Buildings, June 2010 Design for Future Climate: Adapting Buildings, June 2010
Design for Future Climate: Adapting Buildings, June 2010 Innovate UK
 

Mais de Innovate UK (19)

@Iuk comp mediatoolkit_jul20
@Iuk comp mediatoolkit_jul20@Iuk comp mediatoolkit_jul20
@Iuk comp mediatoolkit_jul20
 
UK - Norway plugin vehicle roundtable summary report
UK - Norway plugin vehicle roundtable summary reportUK - Norway plugin vehicle roundtable summary report
UK - Norway plugin vehicle roundtable summary report
 
Plugin vehicle 2025 stakeholder success vision updated October 2017
Plugin vehicle 2025 stakeholder success vision updated October 2017Plugin vehicle 2025 stakeholder success vision updated October 2017
Plugin vehicle 2025 stakeholder success vision updated October 2017
 
Plugin vehicle stakeholder vision September 2017
Plugin vehicle stakeholder vision September 2017Plugin vehicle stakeholder vision September 2017
Plugin vehicle stakeholder vision September 2017
 
Innovate UK's monitoring services procurement - engagement event slides
Innovate UK's monitoring services procurement - engagement event slidesInnovate UK's monitoring services procurement - engagement event slides
Innovate UK's monitoring services procurement - engagement event slides
 
Innovate UK's monitoring services procurement - full briefing pack
Innovate UK's monitoring services procurement - full briefing packInnovate UK's monitoring services procurement - full briefing pack
Innovate UK's monitoring services procurement - full briefing pack
 
Company pitching Powerpoint slide template
Company pitching Powerpoint slide templateCompany pitching Powerpoint slide template
Company pitching Powerpoint slide template
 
Horizon 2020 space – Mapping of UK university expertise and resources against...
Horizon 2020 space – Mapping of UK university expertise and resources against...Horizon 2020 space – Mapping of UK university expertise and resources against...
Horizon 2020 space – Mapping of UK university expertise and resources against...
 
Innovate uk Horizons Sustainable Economy Framework,
Innovate uk Horizons Sustainable Economy Framework,Innovate uk Horizons Sustainable Economy Framework,
Innovate uk Horizons Sustainable Economy Framework,
 
The Wales Space Strategy John Whalley
The Wales Space Strategy John WhalleyThe Wales Space Strategy John Whalley
The Wales Space Strategy John Whalley
 
Connected digital additive manufacturing competition briefing
Connected digital additive manufacturing competition briefingConnected digital additive manufacturing competition briefing
Connected digital additive manufacturing competition briefing
 
Rft f data for apr 2016 charts
Rft f data for apr 2016 chartsRft f data for apr 2016 charts
Rft f data for apr 2016 charts
 
Insights from social housing projects: building performance evaluation
Insights from social housing projects: building performance evaluationInsights from social housing projects: building performance evaluation
Insights from social housing projects: building performance evaluation
 
Uk Research Infrastructure Workshop E-infrastructure Juan Bicarregui
Uk Research Infrastructure Workshop E-infrastructure Juan BicarreguiUk Research Infrastructure Workshop E-infrastructure Juan Bicarregui
Uk Research Infrastructure Workshop E-infrastructure Juan Bicarregui
 
Research Infrastructures Draft Work Programme 2016-2017
Research Infrastructures Draft Work Programme 2016-2017Research Infrastructures Draft Work Programme 2016-2017
Research Infrastructures Draft Work Programme 2016-2017
 
European Long-term Ecosystem and Socio Ecological Research Infrastructure (eL...
European Long-term Ecosystem and Socio Ecological Research Infrastructure (eL...European Long-term Ecosystem and Socio Ecological Research Infrastructure (eL...
European Long-term Ecosystem and Socio Ecological Research Infrastructure (eL...
 
The economic impact of the marine and maritime sector on the UK in 2011/12
The economic impact of the marine and maritime sector on the UK in 2011/12The economic impact of the marine and maritime sector on the UK in 2011/12
The economic impact of the marine and maritime sector on the UK in 2011/12
 
Autocar, Low Carbon Vehicles: The UK's innovation success story
Autocar, Low Carbon Vehicles: The UK's innovation success story Autocar, Low Carbon Vehicles: The UK's innovation success story
Autocar, Low Carbon Vehicles: The UK's innovation success story
 
Design for Future Climate: Adapting Buildings, June 2010
Design for Future Climate: Adapting Buildings, June 2010 Design for Future Climate: Adapting Buildings, June 2010
Design for Future Climate: Adapting Buildings, June 2010
 

Último

DBX First Quarter 2024 Investor Presentation
DBX First Quarter 2024 Investor PresentationDBX First Quarter 2024 Investor Presentation
DBX First Quarter 2024 Investor PresentationDropbox
 
Modular Monolith - a Practical Alternative to Microservices @ Devoxx UK 2024
Modular Monolith - a Practical Alternative to Microservices @ Devoxx UK 2024Modular Monolith - a Practical Alternative to Microservices @ Devoxx UK 2024
Modular Monolith - a Practical Alternative to Microservices @ Devoxx UK 2024Victor Rentea
 
Finding Java's Hidden Performance Traps @ DevoxxUK 2024
Finding Java's Hidden Performance Traps @ DevoxxUK 2024Finding Java's Hidden Performance Traps @ DevoxxUK 2024
Finding Java's Hidden Performance Traps @ DevoxxUK 2024Victor Rentea
 
AWS Community Day CPH - Three problems of Terraform
AWS Community Day CPH - Three problems of TerraformAWS Community Day CPH - Three problems of Terraform
AWS Community Day CPH - Three problems of TerraformAndrey Devyatkin
 
Introduction to Multilingual Retrieval Augmented Generation (RAG)
Introduction to Multilingual Retrieval Augmented Generation (RAG)Introduction to Multilingual Retrieval Augmented Generation (RAG)
Introduction to Multilingual Retrieval Augmented Generation (RAG)Zilliz
 
Platformless Horizons for Digital Adaptability
Platformless Horizons for Digital AdaptabilityPlatformless Horizons for Digital Adaptability
Platformless Horizons for Digital AdaptabilityWSO2
 
FWD Group - Insurer Innovation Award 2024
FWD Group - Insurer Innovation Award 2024FWD Group - Insurer Innovation Award 2024
FWD Group - Insurer Innovation Award 2024The Digital Insurer
 
Repurposing LNG terminals for Hydrogen Ammonia: Feasibility and Cost Saving
Repurposing LNG terminals for Hydrogen Ammonia: Feasibility and Cost SavingRepurposing LNG terminals for Hydrogen Ammonia: Feasibility and Cost Saving
Repurposing LNG terminals for Hydrogen Ammonia: Feasibility and Cost SavingEdi Saputra
 
Artificial Intelligence Chap.5 : Uncertainty
Artificial Intelligence Chap.5 : UncertaintyArtificial Intelligence Chap.5 : Uncertainty
Artificial Intelligence Chap.5 : UncertaintyKhushali Kathiriya
 
Mcleodganj Call Girls 🥰 8617370543 Service Offer VIP Hot Model
Mcleodganj Call Girls 🥰 8617370543 Service Offer VIP Hot ModelMcleodganj Call Girls 🥰 8617370543 Service Offer VIP Hot Model
Mcleodganj Call Girls 🥰 8617370543 Service Offer VIP Hot ModelDeepika Singh
 
Connector Corner: Accelerate revenue generation using UiPath API-centric busi...
Connector Corner: Accelerate revenue generation using UiPath API-centric busi...Connector Corner: Accelerate revenue generation using UiPath API-centric busi...
Connector Corner: Accelerate revenue generation using UiPath API-centric busi...DianaGray10
 
Web Form Automation for Bonterra Impact Management (fka Social Solutions Apri...
Web Form Automation for Bonterra Impact Management (fka Social Solutions Apri...Web Form Automation for Bonterra Impact Management (fka Social Solutions Apri...
Web Form Automation for Bonterra Impact Management (fka Social Solutions Apri...Jeffrey Haguewood
 
MINDCTI Revenue Release Quarter One 2024
MINDCTI Revenue Release Quarter One 2024MINDCTI Revenue Release Quarter One 2024
MINDCTI Revenue Release Quarter One 2024MIND CTI
 
Rising Above_ Dubai Floods and the Fortitude of Dubai International Airport.pdf
Rising Above_ Dubai Floods and the Fortitude of Dubai International Airport.pdfRising Above_ Dubai Floods and the Fortitude of Dubai International Airport.pdf
Rising Above_ Dubai Floods and the Fortitude of Dubai International Airport.pdfOrbitshub
 
Exploring Multimodal Embeddings with Milvus
Exploring Multimodal Embeddings with MilvusExploring Multimodal Embeddings with Milvus
Exploring Multimodal Embeddings with MilvusZilliz
 
Polkadot JAM Slides - Token2049 - By Dr. Gavin Wood
Polkadot JAM Slides - Token2049 - By Dr. Gavin WoodPolkadot JAM Slides - Token2049 - By Dr. Gavin Wood
Polkadot JAM Slides - Token2049 - By Dr. Gavin WoodJuan lago vázquez
 
CNIC Information System with Pakdata Cf In Pakistan
CNIC Information System with Pakdata Cf In PakistanCNIC Information System with Pakdata Cf In Pakistan
CNIC Information System with Pakdata Cf In Pakistandanishmna97
 
Cloud Frontiers: A Deep Dive into Serverless Spatial Data and FME
Cloud Frontiers:  A Deep Dive into Serverless Spatial Data and FMECloud Frontiers:  A Deep Dive into Serverless Spatial Data and FME
Cloud Frontiers: A Deep Dive into Serverless Spatial Data and FMESafe Software
 
Apidays New York 2024 - Passkeys: Developing APIs to enable passwordless auth...
Apidays New York 2024 - Passkeys: Developing APIs to enable passwordless auth...Apidays New York 2024 - Passkeys: Developing APIs to enable passwordless auth...
Apidays New York 2024 - Passkeys: Developing APIs to enable passwordless auth...apidays
 

Último (20)

DBX First Quarter 2024 Investor Presentation
DBX First Quarter 2024 Investor PresentationDBX First Quarter 2024 Investor Presentation
DBX First Quarter 2024 Investor Presentation
 
Modular Monolith - a Practical Alternative to Microservices @ Devoxx UK 2024
Modular Monolith - a Practical Alternative to Microservices @ Devoxx UK 2024Modular Monolith - a Practical Alternative to Microservices @ Devoxx UK 2024
Modular Monolith - a Practical Alternative to Microservices @ Devoxx UK 2024
 
Finding Java's Hidden Performance Traps @ DevoxxUK 2024
Finding Java's Hidden Performance Traps @ DevoxxUK 2024Finding Java's Hidden Performance Traps @ DevoxxUK 2024
Finding Java's Hidden Performance Traps @ DevoxxUK 2024
 
AWS Community Day CPH - Three problems of Terraform
AWS Community Day CPH - Three problems of TerraformAWS Community Day CPH - Three problems of Terraform
AWS Community Day CPH - Three problems of Terraform
 
Introduction to Multilingual Retrieval Augmented Generation (RAG)
Introduction to Multilingual Retrieval Augmented Generation (RAG)Introduction to Multilingual Retrieval Augmented Generation (RAG)
Introduction to Multilingual Retrieval Augmented Generation (RAG)
 
Platformless Horizons for Digital Adaptability
Platformless Horizons for Digital AdaptabilityPlatformless Horizons for Digital Adaptability
Platformless Horizons for Digital Adaptability
 
FWD Group - Insurer Innovation Award 2024
FWD Group - Insurer Innovation Award 2024FWD Group - Insurer Innovation Award 2024
FWD Group - Insurer Innovation Award 2024
 
Repurposing LNG terminals for Hydrogen Ammonia: Feasibility and Cost Saving
Repurposing LNG terminals for Hydrogen Ammonia: Feasibility and Cost SavingRepurposing LNG terminals for Hydrogen Ammonia: Feasibility and Cost Saving
Repurposing LNG terminals for Hydrogen Ammonia: Feasibility and Cost Saving
 
Artificial Intelligence Chap.5 : Uncertainty
Artificial Intelligence Chap.5 : UncertaintyArtificial Intelligence Chap.5 : Uncertainty
Artificial Intelligence Chap.5 : Uncertainty
 
+971581248768>> SAFE AND ORIGINAL ABORTION PILLS FOR SALE IN DUBAI AND ABUDHA...
+971581248768>> SAFE AND ORIGINAL ABORTION PILLS FOR SALE IN DUBAI AND ABUDHA...+971581248768>> SAFE AND ORIGINAL ABORTION PILLS FOR SALE IN DUBAI AND ABUDHA...
+971581248768>> SAFE AND ORIGINAL ABORTION PILLS FOR SALE IN DUBAI AND ABUDHA...
 
Mcleodganj Call Girls 🥰 8617370543 Service Offer VIP Hot Model
Mcleodganj Call Girls 🥰 8617370543 Service Offer VIP Hot ModelMcleodganj Call Girls 🥰 8617370543 Service Offer VIP Hot Model
Mcleodganj Call Girls 🥰 8617370543 Service Offer VIP Hot Model
 
Connector Corner: Accelerate revenue generation using UiPath API-centric busi...
Connector Corner: Accelerate revenue generation using UiPath API-centric busi...Connector Corner: Accelerate revenue generation using UiPath API-centric busi...
Connector Corner: Accelerate revenue generation using UiPath API-centric busi...
 
Web Form Automation for Bonterra Impact Management (fka Social Solutions Apri...
Web Form Automation for Bonterra Impact Management (fka Social Solutions Apri...Web Form Automation for Bonterra Impact Management (fka Social Solutions Apri...
Web Form Automation for Bonterra Impact Management (fka Social Solutions Apri...
 
MINDCTI Revenue Release Quarter One 2024
MINDCTI Revenue Release Quarter One 2024MINDCTI Revenue Release Quarter One 2024
MINDCTI Revenue Release Quarter One 2024
 
Rising Above_ Dubai Floods and the Fortitude of Dubai International Airport.pdf
Rising Above_ Dubai Floods and the Fortitude of Dubai International Airport.pdfRising Above_ Dubai Floods and the Fortitude of Dubai International Airport.pdf
Rising Above_ Dubai Floods and the Fortitude of Dubai International Airport.pdf
 
Exploring Multimodal Embeddings with Milvus
Exploring Multimodal Embeddings with MilvusExploring Multimodal Embeddings with Milvus
Exploring Multimodal Embeddings with Milvus
 
Polkadot JAM Slides - Token2049 - By Dr. Gavin Wood
Polkadot JAM Slides - Token2049 - By Dr. Gavin WoodPolkadot JAM Slides - Token2049 - By Dr. Gavin Wood
Polkadot JAM Slides - Token2049 - By Dr. Gavin Wood
 
CNIC Information System with Pakdata Cf In Pakistan
CNIC Information System with Pakdata Cf In PakistanCNIC Information System with Pakdata Cf In Pakistan
CNIC Information System with Pakdata Cf In Pakistan
 
Cloud Frontiers: A Deep Dive into Serverless Spatial Data and FME
Cloud Frontiers:  A Deep Dive into Serverless Spatial Data and FMECloud Frontiers:  A Deep Dive into Serverless Spatial Data and FME
Cloud Frontiers: A Deep Dive into Serverless Spatial Data and FME
 
Apidays New York 2024 - Passkeys: Developing APIs to enable passwordless auth...
Apidays New York 2024 - Passkeys: Developing APIs to enable passwordless auth...Apidays New York 2024 - Passkeys: Developing APIs to enable passwordless auth...
Apidays New York 2024 - Passkeys: Developing APIs to enable passwordless auth...
 

Characteristics and performance of MVHR systems

  • 1. Characteristics and performance of MVHR systems A meta study of MVHR systems used in the Innovate UK Building Performance Evaluation Programme Report authors: Tim Sharpe Gráinne McGill The Mackintosh Environmental Architecture Research Unit (MEARU) The Glasgow School of Art Rajat Gupta Matt Gregg Oxford Institute for Sustainable Development (OISD) Oxford Brookes University Ian Mawditt fourwalls Consultants
  • 2. Characteristics and Performance of MVHR Systems: A Building Performance Evaluation Meta-Study i Contents Executive Summary..............................................................................1 Introduction ...................................................................................................................... 1 Characteristics.................................................................................................................. 1 Design.............................................................................................................................. 2 Performance..................................................................................................................... 2 Summary.......................................................................................................................... 3 1. Introduction.....................................................................................4 1.1. Study context .......................................................................................................... 4 1.1.1. Building performance evaluation ....................................................................... 4 1.2. Ventilation and MVHR ............................................................................................. 5 1.3. Study aims and objectives....................................................................................... 6 2. Methods and data sources.............................................................8 2.1. Dwelling selection and sample size ......................................................................... 8 2.2. Dwelling types and systems .................................................................................... 9 2.2.1. Dwelling types and data availability ................................................................... 9 2.2.2. Overview of key building characteristics............................................................ 9 2.3. Data collection methods ........................................................................................ 11 2.3.1. Assessing performance characteristics ........................................................... 11 2.3.2. In-use performance ......................................................................................... 12 2.3.3. Surveys and interviews ................................................................................... 13 2.4. Limitations of the study.......................................................................................... 13 3. Characteristics of MVHR systems...............................................15 3.1. Compliance: design stage ..................................................................................... 15 3.2. Commissioning...................................................................................................... 16 3.3. Air flow rates ......................................................................................................... 17 3.4. System balance..................................................................................................... 19 3.5. Influence of duct type ............................................................................................ 20 4. In-use performance.......................................................................22 4.1. Ventilation performance......................................................................................... 22 4.1.1. Comparative ventilation performance .............................................................. 22 4.1.2. Ventilation performance in dwellings with MVHR systems............................... 26 4.2. Comparative relative humidity levels ..................................................................... 28 4.2.1. Relative humidity in dwellings with MVHR ....................................................... 32 4.3. Comparative indoor temperatures ......................................................................... 34 4.3.1. Indoor temperatures in dwellings with MVHR .................................................. 37
  • 3. Characteristics and Performance of MVHR Systems: A Building Performance Evaluation Meta-Study ii 4.4. Comparative vapour pressure levels ..................................................................... 39 4.4.1. Vapour pressure levels in MVHR dwellings ..................................................... 43 4.5. Energy use comparative analysis .......................................................................... 44 5. Feedback from design team and residents.................................47 5.1. Introduction ........................................................................................................... 47 5.2. Design and procurement ....................................................................................... 47 5.3. Construction and installation ................................................................................. 49 5.4. Handover and use................................................................................................. 52 5.5. Summary............................................................................................................... 59 6. Learning from representative case studies ................................61 6.1. Case Study 1: Typical ‘fit and forget’ example ....................................................... 61 6.1.1. Design............................................................................................................. 61 6.1.2. Construction and installation ........................................................................... 62 6.1.3. Handover and use........................................................................................... 64 6.1.4. Maintenance.................................................................................................... 64 6.1.5. Recommendations .......................................................................................... 65 6.2. Case Study 2: Consequences of system failure .................................................... 66 6.3. Case Study 3: Impact of inadequate maintenance................................................. 71 6.3.1. Design............................................................................................................. 71 6.3.2. Performance.................................................................................................... 72 6.3.3. Summary......................................................................................................... 79 7. Conclusions ..................................................................................80 7.1. Observations from the study elements .................................................................. 80 7.2. Implications for practice and policy........................................................................ 82 7.2.1. Design............................................................................................................. 82 7.2.2. Installation....................................................................................................... 82 7.2.3. Usability .......................................................................................................... 83 7.2.4. Maintenance.................................................................................................... 83 7.3. Future work ........................................................................................................... 83 8. Appendices ...................................................................................85 8.1. Appendix A: Common shortcomings of MVHR systems ........................................ 85 8.2. Appendix B: Carbon dioxide .................................................................................. 86 8.3. Appendix C: Relative Humidity .............................................................................. 92 8.4. Appendix D: Temperature ..................................................................................... 95 8.5. Appendix E: Vapour pressure................................................................................ 98
  • 4. Characteristics and Performance of MVHR Systems: A Building Performance Evaluation Meta-Study 1 Executive Summary Introduction This meta-study was commissioned by Innovate UK as part of the Building Performance Evaluation (BPE) Programme to provide an overview of the performance and use of whole-house heat recovery ventilation (MVHR) systems in domestic projects. With increasing requirements for energy reduction, the impact of ventilation strategies has increased in importance, both in terms of energy reduction and indoor air quality (IAQ). The primary aims of this meta-study are to: 1. Review the characteristics of installed systems in relation to air flow, system balance and compare to existing published guidelines, particularly those contained in the relevant Building Regulations documents; 2. Investigate, via surveys and interviews, the reasons for selecting MVHR as a ventilation strategy on a development and experience of MVHR systems in practice; 3. Review available monitored data to investigate the performance of houses with MVHR systems; 4. Determine the key features of MVHR systems with respect to the quality of their design and installation and commissioning procedures. Across the BPE domestic programme, a total of 85 study dwellings from 29 projects with MVHR systems were investigated. Development sizes range from single homes to major developments of 700+ dwellings, thus the total number of homes that the study dwellings potentially represent is in excess of 3300. Characteristics data was available for 51 dwellings, while consistent monitored CO2 data was available for 21 dwellings. The data used has been taken from three main sources: 1. Final versions of reports, submitted to Innovate UK, which include mandatory elements, e.g. ventilation measurement data, installation and commissioning reviews, contextual data in final reports, etc.; 2. Surveys and/or interviews with a selection of participating project teams across fifteen projects; 3. The online data repository for the BPE (and other) programmes, known as Embed (www.getembed.com). This Platform is owned and operated by the Energy Saving Trust, whereas the BPE data within it is owned by Innovate UK. The dataset contains a number of limitations which are described in the report, particularly with regard to the monitored data. Characteristics The review of the air flow designs showed that the majority of systems met the minimum requirements of the building regulations. However, significant problems were found with the commissioning, with only 16% of systems being found to have been commissioned correctly with respect to air flow and balancing. Consequently, the performance of the systems investigated in the BPE programme varies significantly, with only 56% of installations meeting the design air flow value. Similarly, 52% of systems were found to have a measured imbalance between
  • 5. Characteristics and Performance of MVHR Systems: A Building Performance Evaluation Meta-Study 2 supply and extract airflow of >15%. Extracts in ‘boost’ setting from wet rooms, such as kitchens and bathrooms were found to have a significant range, with only 44% of kitchens meeting the minimum requirement of 13 litres per second. A review of ductwork types revealed that the measured air flow in 88% of systems utilising rigid ducting were equal to or greater than their design air flow values, whereas between only 40 and 44% of systems utilising flexible ducting met their respective design values. Design Due to the nature of the BPE programme, only projects with high sustainability standards (Code for Sustainable Homes level 4, 5, Passivhaus) were funded. This meant that the dwellings were designed to have good levels of airtightness. This is why provision of acceptable indoor air quality was an important consideration for installation of MVHR systems across the majority of the projects studied. In a few cases, MVHR systems were selected to achieve Code compliance without much understanding of required air-tightness of the building envelope or the maintenance requirements of these systems. Performance Overall comparison of CO2 levels in houses with non-MVHR ventilation indicates that average and peak CO2 levels are lower in MVHR houses, but this should be contextualised with emerging evidence of poor performance (particularly in bedroom spaces) of natural ventilation in airtight homes. However, peak CO2 levels were consistently lower suggesting that, when working, mechanical systems may improve ventilation rates. However, a number of the MVHR houses demonstrated sub-optimal performance and indicate that there are risks when systems do not work correctly or are not being used. This would lead to houses being naturally ventilated, but relying entirely on opening windows where there is no provision for background ventilation. In some spaces where this is not possible (for example due to external factors such as noise or security), or where there is less adaptive behaviour (for example bedrooms overnight), very poor levels of ventilation are experienced. The impact of MVHR on internal conditions such as relative humidity was not clear. Within the available sample there was no obvious association with low RH, however, this may be masked by the tendency for MVHR houses to be heated closer to optimum temperatures. Looking at the absolute moisture content of the air also revealed no clear trends, but some MVHR houses had high levels of moisture. What was clear is that houses with MVHR systems tended to have more stable environmental conditions – differences between peak and low levels of both RH and temperature were consistently lower in the MVHR houses. In general the energy consumption in houses with MVHR systems was lower, but again this needs to be contextualised – 77% of the MVHR dwellings with energy data were of Passivhaus construction, which in general have lower consumption within the domestic sample (albeit with MVHR as a key component). Overall the study indicates that the rationale behind the use of MVHR systems is borne out – the rates of ventilation as evidenced very generally by CO2 levels are better, and the energy use overall is lower. However, the study highlights the prevalence of sub-optimal systems and the possible implications on both energy efficiency and indoor air quality.
  • 6. Characteristics and Performance of MVHR Systems: A Building Performance Evaluation Meta-Study 3 Summary Well designed, installed, maintained and used MVHR systems are able to make useful contributions to energy reduction and good ventilation. However, in practice achieving all these conditions is a challenge for the industry and many of the projects in the studies had a number of problems that would undermine these benefits. Common problems included: insufficient system air flow and system imbalance; lack of appropriate airtightness; poorly designed and installed ductwork; lack of occupant handover and understanding; inadequate maintenance, in particular filter cleaning or replacement. In airtight homes, the importance of maintaining the ventilation provision is imperative and the consequences of failure may be more significant, and may have detrimental health implications for the occupants. Key stages are improving design to avoid problems. This includes:  Ensure that the performance requirements in terms of energy and ventilation are clear;  Consider design issues to ensure good airflow and to anticipate and avoid installation problems associated with ductwork;  Consider and design in maintenance requirements including unit location, filter cleaning and replacement;  Good communication of the design details with installers and commissioners in conjunction with better quality control onsite to avoid installation defects;  Improved handover processes and occupant guidance. The most common problems at the installation or commissioning stages include imbalance between supply and extract airflows (half of the projects), poor installation, and inadequate commissioning (likely as a result of the former problems), with systems requiring recommissioning in one-third of the projects. Other problems which occurred include blockages or no airflow, systems difficult to commission, and fan speeds that were too high. In terms of operation, most interviewee dissatisfaction was with the inadequate level of user understanding of how to operate and control the system, which suggests insufficient training or handover. The most common operational issue was found to be system maintenance. Without appropriate handover and training (including easy- to-follow documentation and follow-ups), it is difficult to make occupant or housing association-led maintenance regimes work. Half of the projects sampled had occupants that disabled the system; the most common reason was out of concern for the operating cost of the MVHR. Though potentially tenuous, high cost of running the system was a common perception among occupants.
  • 7. Characteristics and Performance of MVHR Systems: A Building Performance Evaluation Meta-Study 4 1. Introduction 1.1. Study context There is growing evidence that decarbonisation strategies aimed at the housing sector do not always achieve intended results. This performance gap between ‘as designed’ and ‘as built’ is increasingly well evidenced1 . To address this, Innovate UK (formerly the Technology Strategy Board) commenced the Building Performance Evaluation programme in 2010. This was a 4-year programme to support a range of BPE studies across the UK in both domestic and non-domestic buildings. They include Phase 1 studies looking at post-construction and early occupation, and Phase 2 studies, which undertook Phase 1 evaluation but also in-use and post- occupancy monitoring and evaluation over a 2-year period. A key aim of the programme was to identify the causes and scope of performance gaps across a wide range of buildings. In the Domestic programme there were 53 projects supported (representing 350 homes), with 23 Phase 1 early occupation studies and 30 Phase 2 detailed monitoring projects. 1.1.1. Building performance evaluation The requirements of the programme were identified in the ‘Guide for Project Execution’ which set out the mandatory testing and evaluation requirements. For Phase 1 projects, this included:  Design & construction audit, photographic survey, drawings and SAP calculation review, qualitative semi-structured interviews and walkthroughs with occupants and separately, the design team, to explore design intentions compared with final performance;
  Whole house heat loss testing, including air permeability test, infra-red thermography, in-situ U-value measurements and smoke based air leakage test;
  Review of systems design and implementation, including installation and commissioning checks of all services and systems provided to the dwelling, including measurement of performance and energy use of any MV or MVHR systems;  Occupant survey using standardised housing questionnaire; analysis of which is covered centrally by the Technology Strategy Board;
  Evaluation of hand-over process and any guidance provided to the occupants; 
  Comparison of predicted performance with actual performance and interpretation of findings. For Phase 2 projects monitoring was undertaken for a 2-year period and mandatory elements included:  Design & construction audit, photographic surveys, drawings and SAP calculation review, qualitative semi-structured interviews, walkthroughs with occupants, and separately, the design team to explore design intentions compared with final 1 Zero Carbon Hub (2014) Closing the Gap between Design & as-Built performance–End of Term Report. Milton Keynes: Zero Carbon Hub
  • 8. Characteristics and Performance of MVHR Systems: A Building Performance Evaluation Meta-Study 5 performance. This element was only necessary if not already undertaken as part of a post-construction and early occupation study;  Metered gas, electricity, water and if appropriate heat, into (and out of) the dwelling;  Sub metering according to use e.g. space heating, water heating, cooker, lights and appliances;  Measurement of the performance of microgeneration technologies generating electrical energy and heating/cooling, including separate measurement of the energy consumption and generation;  Measurement of the performance and energy use of MVHR systems if not already carried out as part of a post-completion and initial occupation study;  An air permeability test towards the end of the monitoring period and also at the beginning of monitoring period, if not already undertaken as part of a post- completion and early occupation study;  In-situ U-value measurement, if not already carried out as part of post- construction and early occupation study;  Monitoring of internal environmental conditions (temperature, relative humidity and CO2);  Monitoring of external temperature and relative humidity on site;  External climatic conditions – obtained from an appropriate local weather station;  Energy audit, including Appliance audit with equipment load and usage profiles using DomEARM - domestic version of TM22;  Occupant survey using standardised housing questionnaire – analysis of which was covered centrally by the Technology Strategy Board;  Comparison of predicted performance with actual performance and interpretation of findings. In practice not all projects were able to undertake all of these tests, or conduct them to the same standard. Some reporting requirements and deliverables varied over the 4 year period and projects were undertaken at different times, consequently the dataset is quite diverse. Nevertheless it represents a substantial body of information from which important insights can be gathered on a range of issues. More information on the Building Performance Evaluation programme is available from the Knowledge Transfer Network [connect.innovateuk.org/web/building- performance-evaluation] and outputs from individual BPE projects are available from the Digital Catapult: Building Data Exchange [www.buildingdataexchange.org.uk] 1.2. Ventilation and MVHR It was apparent from the start of the BPE programme that a significant number of dwellings were using MVHR systems. The requirements for building airtightness have increased and building regulations require all new dwellings to achieve an air permeability level of less than 10m3 /(h.m2 ) @50 Pa. With improved fabric thermal performance, ventilation losses become more significant and strategies that can reduce these may carry considerable weight when evaluating proposed performance. As a result, MVHR is an attractive option when undertaking SAP calculations and for improved performance standards in place during the studies, such as Code for Sustainable Homes and Passivhaus. Consequently, the uptake of MVHR systems is
  • 9. Characteristics and Performance of MVHR Systems: A Building Performance Evaluation Meta-Study 6 on the rise, with these systems expected to become a common form of ventilation in the coming years 2 . The ability to provide requisite levels of ventilation, whilst maintaining energy efficiency is a highly desirable goal, but a move away from traditional and familiar forms of ventilation is a step-change in UK housing design. These systems have been found to provide considerable reductions in space heating demand, and improvements of indoor air quality (IAQ) and thermal comfort3,4 . However, with increasingly mainstream use, a series of studies have also highlighted significant concerns regarding the specification, installation, commissioning, performance, operation and maintenance of MVHR systems in a domestic context (Appendix A). Links between ventilation and health are well established; however there is growing concern that the modern building practice of reducing natural infiltration, increasing insulation and limiting ventilation to reduce heat loss could cause a significant detrimental impact on indoor air quality. A UK study carried out by the Ventilation and Indoor Air Quality (VIAQ) Task Group on MVHR systems in new homes5 has found significant concerns regarding the delivery and performance of these systems, and provides recommendations for good practice and highlights the need for more information. 1.3. Study aims and objectives This meta study was therefore commissioned to undertake a broad assessment of domestic projects that utilised MVHR systems in the BPE programme. Whilst projects have undertaken individual assessments of performance, this study provided an opportunity to make a broad comparison across a range of projects, to identify common issues and to make a comparative analysis of the use of these systems. The initial research questions included:  Are MVHR systems in low energy homes delivering acceptable levels of indoor air quality on a long term basis and to what extent? If not, why not?  What was the design intention and expectation of these?  What is their mode of operation in relation to the houses in which they are installed?  What is their operating efficiency in respect of heat recovery?  Are they providing sufficient ventilation to maintain IAQ?  What is their contribution to the overall energy efficiency of the homes?  Are there problems in terms of specification, maintenance or operation that can be identified?  How are occupants interacting with this equipment and how does this impact on their performance? 2 Sullivan L, Smith N, Adams D, Andrews I, Aston W, Bromley K, et al. (2012) Mechanical Ventilation with Heat Recovery in New Homes. London: NHBC, Zero Carbon Hub 3 Schnieders J and Hermelink A (2006) CEPHEUS results: measurements and occupants’ satisfaction provide evidence for Passive Houses being an option for sustainable building. Energy Policy 34(2): 151-171 4 Derbez M, Berthineau B, Cochet V, Lethrosne M, Pignon C, Riberon J, et al. (2014) Indoor air quality and comfort in seven newly built, energy-efficient houses in France. Building and Environment 72(0): 173-187. 5 Sullivan L, Smith N, Adams D, Andrews I, Aston W, Bromley K, et al. (2013) Mechanical Ventilation with Heat Recovery in New Homes. London: NHBC, Zero Carbon Hub
  • 10. Characteristics and Performance of MVHR Systems: A Building Performance Evaluation Meta-Study 7 The aims of the study were to identify the nature of MVHR systems, to analyse the available performance data, to gather information and insights from projects about the issues affecting the use and performance of these systems, and to share this information, experience and knowledge both within projects and to the wider construction industry.
  • 11. Characteristics and Performance of MVHR Systems: A Building Performance Evaluation Meta-Study 8 2. Methods and data sources 2.1. Dwelling selection and sample size From the funded projects within the Innovate UK BPE portfolio, there were a total of 237 MVHR ventilated dwellings. The dwellings represented come from a range of development sizes, one-off through to major developments (largest ~790 dwellings), thus the total number of homes represented is in excess of 3300. The map below shows the geographical spread of MVHR ventilated dwellings that are included within this study. Subsequently, no one particular developer or installer features more than once across the projects. Figure 2.1a Geographical spread of MVHR dwellings Owing to the tiered study nature of the BPE programme, not all of the 237 MVHR ventilated dwellings were studied in detail. However, at least one dwelling from each project site had been subject to detailed investigation by the project teams. The systems subject to this level of review totalled 54 out of the 237 dwellings, covering 29 domestic BPE projects.
  • 12. Characteristics and Performance of MVHR Systems: A Building Performance Evaluation Meta-Study 9 Considerable challenges were experienced accessing data for the study due to the timescale of varying and progressive project completion dates and collation and curation of the data that continued post-project completion. Assessments made in this meta-study is based upon data that has been made available through mandatory reporting templates and the web-based data repository known as Embed. Detailed assessment of all the final reports was not practical, however, anonymised case studies illustrating specific issues are included throughout this study. The data from these 54 systems has been analysed in this meta-study with respect to air flow characteristics. A selection of these have been assessed for their contribution toward maintaining comfort conditions within the dwellings. To give context to the physical data, responses from BUS Methodology© (covering resident satisfaction, comfort, control) were reanalysed for 27 projects. Further information was obtained through surveys and interviews with 15 BPE projects based on the willingness of the design team to get involved with qualitative review. Care was taken to ensure that both mainstream low energy housing and Passivhaus projects were represented in the sample (see section 2.2). 2.2. Dwelling types and systems 2.2.1. Dwelling types and data availability A range of meta-reviews across different dwellings within the BPE portfolio have been applied to projects where usable data has been available. Out of the 237 MVHR-ventilated dwellings in the programme, 54 were studied in sufficient detail by the project teams and this data has been used to assess performance characteristics. 33 MVHR-ventilated dwellings had consistent data available for assessing indoor hygrothermal conditions, and this data has been used to assess comfort criteria. Carbon dioxide data was available for 21 MVHR dwellings, which was used as an indicator of ventilation performance. Out of all the dwellings assessed in this meta-study, 20 are certified Passivhaus properties. To enrich the study, a further 15 non-MVHR (MEV or naturally ventilated) dwellings have been assessed for environmental performance, and this has been used to benchmark performance against these two principle ventilation strategies. A summary of systems reviewed is provided in Table 2.2a. Table 2.2a. Summary of properties reviewed Dwelling types Performance characteristics Design team interviews Temp / RH data BUS survey CO2 data Energy MVHR 54 homes 15 projects (163 homes) 33-34 homes 27 projects (211 homes) 21 homes 39 homes Non- MVHR n/a n/a 15 homes 15 homes 15 homes 20 homes 2.2.2. Overview of key building characteristics A range of construction types were included within the portfolio of dwellings: traditional masonry; timber-frame; pre-fabricated timber-panel; etc. The main dwelling characteristic assessed in relation to ventilation characteristics is the airtightness standard, both design target and tested.
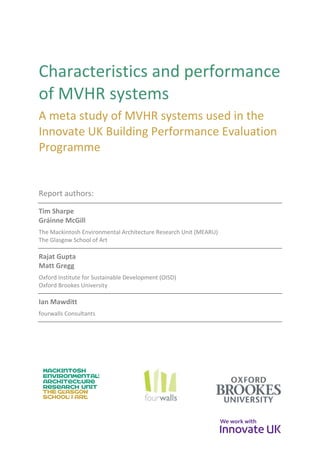
  • 13. Characteristics and Performance of MVHR Systems: A Building Performance Evaluation Meta-Study 10 Figure 2.2a. Dwelling air permeability characteristics – design and tested * against dwelling reference denotes Passivhaus The design air permeability target is important in the context of MVHR installations as any leakage through the dwelling envelope will have an impact on the efficiency of the heat recovery component. Figure 2.2a illustrates the design and tested air permeability across 54 dwellings. The design air permeability targets shown in light blue have a range from as low as 0.5 (m3 /h)/m2 @50Pa to as much as 7.0 (m3 /h)/m2 @50Pa. In total 20 dwellings (37%) had a design air permeability of <1.0 (m3 /h)/m2 @50Pa; 21 dwellings (39%) between >1.0 and <3.0 (m3 /h)/m2 @50Pa, and 13 dwellings (24%) were >3.0 (m3 /h)/m2 @50Pa. There are differences of opinion about the appropriate air permeability threshold suitable for MVHR strategies. Passivhaus advocates suggest <1.0 (m3 /h)/m2 @50Pa, whereas other suggested target thresholds are for 3.0 (m3 /h)/m2 @50Pa to an upper limit of 5.0 (m3 /h)/m2 @50Pa. Out of these 54 dwellings, 3 (6%) had a design air permeability of >5.0 (m3 /h)/m2 @50Pa. The measured air permeability values for each dwelling are also shown in the chart, coloured in dark blue against their design values (the chart is ranked in this order). There is significant variance, even for some dwellings with <1.0 (m3 /h)/m2 @50Pa target, between the intended air permeability and the tested value. The tested values in the chart are for those conducted as part of the BPE projects, and not the test result obtained at dwelling completion. The measured air permeability test results range from 0.26 (m3 /h)/m2 @50Pa to 8.95 (m3 /h)/m2 @50Pa. In total, 16 out of the 54 dwellings (30%) achieve a tested air permeability of <1.0 (m3 /h)/m2 @50Pa, with 15 of these being Passivhaus dwellings. A further 13 dwellings (24%) achieve an air permeability between >1.0 and <3.0 (m3 /h)/m2 @50Pa, and an additional 11 dwellings (20%) are between >3.0 and <5.0 (m3 /h)/m2 @50Pa. This leaves 14 dwellings (26%) with a tested air permeability of >5.0 (m3 /h)/m2 @50Pa, with 6 of these being >7.0 (m3 /h)/m2 @50Pa. The mean air permeability test value in the dataset is 3.2 (m3 /h)/m2 @50Pa. In total, 25 dwelling air permeability tests (46%) meet their design target value. 0 1 2 3 4 5 6 7 8 9 10 H8_a* H23_a* F12_b* F7_b* H23_b* F7_a* H28_a* F12_a* H5_a* H8_b* H31_a* F23_a* H28_b* F7_c* H22_a H15_c* H14_a* H14_b* H34_a H20_a H17_b* F34_a F37_a F36_a H17_a* H20_d F37_a H17_c* F37_a H33_a F36_b H29_a H20_c H20_b F36_c H26_a H26_b H29_b H25_a F4_a H24_a H21_a H32_b F4_b H35_a H32_a H24_b F27_a H30_b H24_d H30_a H9_a H24_c H24_e (m3/h)/m2@50Pa Dwelling air permeability (m3/h)/m2@50Pa Tested Air Permeability Design Air Permability Design Values: n<1.0 = 20; n>1.0<3.0=21; n>3.0<5.0=10; n>5.0 = 3
  • 14. Characteristics and Performance of MVHR Systems: A Building Performance Evaluation Meta-Study 11 2.3. Data collection methods 2.3.1. Assessing performance characteristics Through the mandatory deliverables from each project, various data relating to the characteristics of the dwelling and their ventilation systems was available. Final reports were also reviewed in order to obtain the required information. This data trawl resulted in standardised characteristics forms being created for each MVHR system to allow characterisation of the systems and dwellings: air permeability; air flow performance; system balance, etc. This process would also identify any emerging trends, e.g. ducting types; relationship to original commissioning values, etc., which may also have a bearing on in-use performance. The first review for the performance characterisation was to understand the range of air permeabilities within the MVHR ventilated dwellings. All projects, whether Phase 1 or Phase 2, undertook air permeability testing on their subject dwellings. These tests were additional to any testing carried out for regulatory compliance purposes. The programme requirement for air permeability testing was to test in Phase 1 (or at the start of Phase 2 if no Phase 1 study), and to conduct a further test at the end of Phase 2. For the purpose of this meta-study, the first test result has been used. All tests performed followed the guidance within Technical Standard 1 – Measuring air permeability of building envelopes, Issue 2, (ATTMA 2007) and BS EN 13829: 2001 Thermal performance of buildings - Determination of air permeability of buildings – Fan pressurization method; with the additional requirement that the derived permeability was the mean of the resulting pressure and de-pressure tests. For assessing the air flow characteristics, the volume flow rates associated with each system were re-measured by the project teams as part of the BPE study, irrespective of any original commissioning that had previously taken place. This task usually took place during Phase 1, with the intention being to understand the systems’ performance and make any necessary adjustments prior to taking the dwelling forward to long-term monitoring. Measurements were made using UKAS calibrated volume flow equipment, and followed specific requirements in the project execution guide, which references the procedure in the published Domestic Ventilation Compliance Guide6 . For the purpose of this meta-study, Phase 1 measurement data has been used, as this, theoretically, should closely represent the air flow performance of the systems post-commissioning, but pre-occupation (i.e. condition at hand-over). The Phase 1 data was considered to be the most reliable of that available, and has been used as a benchmark to compare against both the design and commissioning data, where this was made available. However, in some cases, Phase 2 measurement data has been used, but only where a project did not participate in Phase 1, or where full re- commissioning of the system was necessary as a result of poor results from Phase 1 measurements. This is to discount potential system adjustments by residents (Phase 2 studies were undertaken in occupied dwellings), which may skew comparisons with design and commissioning data. Assessments have been made for each system to determine their success for meeting both their original design air flow values, and for meeting the design specification published in Approved Document F – Ventilation (AD F: Part F of the Building Regulations for England and Wales). Where design information was not available, the meta-study team have derived the minimum design air flow values in accordance with the values published either in Approved Document F 2006 or 2010 editions (whichever revision was in force at the time for that particular dwelling). 6 Department for Communities and Local Government (July 2011) Domestic Ventilation Compliance Guide
  • 15. Characteristics and Performance of MVHR Systems: A Building Performance Evaluation Meta-Study 12 Some dwellings within the portfolio are located in Scotland and Northern Ireland, where different regulations are used. However, for the purpose of this meta-study, comparisons have been made with the design guidance published in AD F, irrespective of dwelling location. AD F, which carries the same specification as Technical Booklet K (Building Regulations (Northern Ireland)), and Building (Scotland) Regulations (Technical Handbook - Domestic Section 3 Environment), does not contain any performance specification for dwelling air flow rates. 2.3.2. In-use performance Phase 2 projects generally spanned a two year period, during which time monitoring equipment was installed in the dwellings to collect data in accordance with the BPE programme protocol. The data recorded by the numerous sensors and meters in each house has been uploaded onto the Embed data repository. Being a new system, created during the same period as the BPE programme, there were significant delays with uploading, configuring, and ultimately accessing the data from individual projects. Access by the meta-study team was given in July 2015. Included within this data is information applicable to understanding MVHR performance. This included the following:  Internal temperature (°C), typically living room and bedroom(s);  Internal %RH, typically living room and bedroom(s);  Internal CO2 concentration (ppm), typically living room and bedroom(s);  Energy used by MVHR (kWh) installation. Following a review of the data available on Embed, a decision was made to use the statistics (max, min, mean and range) generated within the Embed platform to form the basis of the analysis. Whilst this may have limited the results, it did eliminate the need for analysis of the raw data files (which is beyond the scope of a meta-study), and therefore significantly reduced the time required for data collection. Monitoring sites were limited to living rooms and bedrooms, as these tend to have the greatest levels of occupancy. Bedrooms are spaces where occupants spend the most uninterrupted time. Children may also use their bedrooms for socialising and schoolwork, in which case they could spend a significant amount of time in the bedroom. Bedrooms over-night present consistent conditions with occupants asleep, with little or no adaptive behaviour, which minimises confounding variables in respect of ventilation. Accordingly, environmental conditions and ventilation rates in bedrooms and living rooms are of particular interest as these spaces provide the greatest exposure to occupants. Analysis of environmental data (temperature, relative humidity and CO2) was limited to three months (February, April and August), representative of winter, spring and summer conditions. This provided the opportunity to explore seasonal variations. The analysis was further limited to the year 2013, to reduce the impact of yearly climate variations. Only complete datasets for each month were included in the analysis. Although energy data was available on the Embed platform, this was significantly limited and there were a number of caveats pertaining to the validity of the available information. Specifically, there was concern regarding the correct use of units (W, kW, kWh) and the format (cumulative or differential) in which the data was available. Furthermore, aggregated data for total electrical, non-electrical and space heating consumption was not available at the time for all projects, therefore manual calculations were required. For these reasons, a decision was made to extract energy data (annual space heating, electricity consumption and non-electricity consumption) from the available DomEARM spreadsheets. Unfortunately, it was not possible to accurately evaluate the energy performance (electrical consumption or heat recovery efficiency) across the range of MVHR systems in practice due to a lack of viable data.
  • 16. Characteristics and Performance of MVHR Systems: A Building Performance Evaluation Meta-Study 13 2.3.3. Surveys and interviews As well as dwelling characteristic information and monitored data, additional data were gathered from the BUS surveys which were undertaken by all projects. To give context to the physical data, responses from BUS Methodology© (covering resident satisfaction, comfort, control) were reanalysed for 27 projects. Further information was obtained through surveys and interviews with 15 BPE projects based on the willingness of the design team to get involved with qualitative review. The purpose of the reanalysis of BUS surveys, surveys and interviews by the BPE project teams was to:  Understand the design intention and expectation of the MVHR systems;  Identify problems and good practices in terms of specification, maintenance or operation;  Evaluate how occupants interact with MVHR systems and how this may impact on their performance. Feedback from occupants was assessed by undertaking a re-analysis of BUS survey results (n: 27 projects covering 211 dwellings) along with primary data collection using online survey questionnaire and/or telephone interviews with design teams (n: 15 projects covering 163 dwellings). Table 2.3a lists the projects for which primary data collection was undertaken. Table 2.3a BPE projects represented by design team interviews (and/or questionnaire) Project Code Feedback from design teams H17 Questionnaire & Interview F4 Questionnaire & Interview H20 Questionnaire & Interview H23/F23 Questionnaire & Interview F1 Questionnaire & Interview H14 Questionnaire only H25 Interview H8 Interview H5 Interview H15 Interview H26 Interview F27 Interview H10 Interview H9 Interview H35 Interview 2.4. Limitations of the study The study relies both on the quality and availability of project data that has been collected by other parties. There will likely be some variances with data collection techniques between 3rd party project teams and the completeness of their respective project data. This study has made reasonable attempts to ensure that any data used for the purpose of meta-analysis is of sufficient quality to ensure that the findings herein are satisfactorily robust.
  • 17. Characteristics and Performance of MVHR Systems: A Building Performance Evaluation Meta-Study 14 The findings have some caveats. Importantly:  Dwellings were not randomly selected for inclusion in the Building Performance Evaluation programme, therefore may not be representative of all UK new build dwellings with MVHR systems;  Measurements were undertaken independently for each housing project, therefore sampling equipment and methodology may have varied;  Exact occupancy levels during the monitoring period were not known;  Occupant behaviour and use were not objectively measured and are likely to have had a significant effect on the results. In particular, it is not clear if all MVHR systems were in operation during the environmental monitoring;  The frequency of window opening was not monitored in the majority of homes;  The volume of monitored living room and bedroom spaces were unknown;  Data was extracted from the Embed platform manually, therefore may be subject to human error;  Variations of localised climatic conditions, airtightness levels, construction type and space heating strategies were not taken into account;  Start and end date for the annual energy monitoring data were not consistent across all projects;  Uneven sample sizes for MVHR and Non-MVHR data. Despite these limitations, the results provide an important insight into the performance of MVHR systems in practice. Furthermore, since the limitations were the same for all monitored dwellings, they are not expected to have had a significant impact on the results.
  • 18. Characteristics and Performance of MVHR Systems: A Building Performance Evaluation Meta-Study 15 3. Characteristics of MVHR systems 3.1. Compliance: design stage Figures 3.1a and 3.1b show data from a selection of 43 properties where the original design data had been submitted. As the guidance for minimum air flow rates changed between AD F 2006 and 2010, the charts have been separated to reflect the whole dwelling ventilation rate according to the revision of the Approved Document that was in force for that particular property. Figure 3.1a shows the properties that were completed under the 2006 revision of AD F. The minimum whole-house ventilation rate required, shown by the green line, is based upon the requirement of 0.3 l/s per m2 of internal floor area with an allowance for infiltration by subtracting 3% (single-storey) or 4% (multi-storey) internal volume of air from the whole dwelling ventilation rate, according to dwelling type. Figure 3.1a. Design stage air flow rates compared to AD F (2006) Bold bars denote Passivhaus dwellings The chart (Figure 3.1a) shows that, in all 25 submitted cases, the ventilation designs meet the minimum air flow specification given AD F (2006). However, the guidance published in this revision of AD F was designed to cope with air permeability levels down to around 3-4 (m3 /h)/m2 @50Pa, and it suggested that additional ventilation provisions (air flow) should be considered for more airtight properties. It would be reasonable to consider that the allowance for additional provision would be to remove the infiltration allowance, thereby the provision of all air flow is via the ventilation system (i.e. not relying upon infiltration to account for a proportion of the total ventilation). The purple line shows the 0.3 l/s per m2 (without infiltration allowance), and this is the revised specification for minimum ventilation rates as required by AD F (2010). Of the 25 properties represented in Figure 3.1a, 18 of the properties have a tested air permeability of <3.0 (m3 /h)/m2 @50Pa, and therefore the design air flow rate should 0 5 10 15 20 25 30 35 40 45 50 litrespersecond Air flow rate (design) comparison to Part F requirements (appropriate to dwellings when Part F 2006 was in force) Designed Flow Rate (Supply) Designed Flow Rate (Extract) Minimum for Part F (2006) Minimum for Part F (2010) n(2006) = 25 (n < Part F = 0; n > Part F = 25)
  • 19. Characteristics and Performance of MVHR Systems: A Building Performance Evaluation Meta-Study 16 accord with the requirements of AD F (2010). As the chart shows, only 6 of the designs (all <3.0) meet the required air flow criteria. Thus, it could be considered that only 13, or 52% of the design ventilation rates meet the AD F (2006) specification. Figure 3.1b shows a further 18 properties that were completed to meet AD F (2010) revision. The purple line in the chart shows the minimum design flow rate for each property to meet the AD F (2010) specification. In the majority of cases (72%), the original design values are equal, or greater than the minimum value. However, the design for 5 properties do not meet the minimum specification. Given the period during which the BPE programme spanned, it is probable that these properties fell during the transition between 2006 and 2010 revision of AD F coming into force. Figure 3.1b. Design stage air flow rates compared to AD F (2010) Bold bars denote Passivhaus dwellings The origin of the designs are not known, whether they had been undertaken by the manufacturers (or their agents), or by a member of the project design team (e.g. M+E engineer). Out of these 43 properties it is noted that the submitted design values for the whole-dwelling supply and ventilation rates, are out of balance for 17 (39%) of systems, the most striking being property F27_a in Figure 3.1a. In 16 out of 17 cases (all except ref F27_a) it was found that the design flow rates followed the guidance in the relevant revision of AD F, e.g. supply air rates determined by 0.3 l/s per m2 , and extract rates determined from minimum high rate published for each room. AD F does not require system air flows to balance, although it is necessary to obtain optimum thermal efficiency and minimise risks relating to condensation. Imbalance findings are discussed later in this section. It is believed that the design for property F27_a used higher design extract rates, which are applicable to intermittent, as opposed to continuously running mechanical extract fans. 3.2. Commissioning The original commissioning data was available for 38 out of the 54 systems reviewed. In most cases, this data has been transcribed by the project teams, thus the original commissioning sheets have not been reviewed as part of this study. Table 3.2a shows that, out of the 38 systems with commissioning data, it would 0 5 10 15 20 25 30 35 40 45 50 litrespersecond Air flow rate (design) comparison to Part F requirements (appropriate to dwellings when Part F 2010 was in force) Designed Flow Rate (Supply) Designed Flow Rate (Extract) Minimum for Part F (2010) n(2010) = 18 (n < Part F = 5; n > Part F = 13)
  • 20. Characteristics and Performance of MVHR Systems: A Building Performance Evaluation Meta-Study 17 seem that only 19 have been commissioned at both speeds (normal and boost speeds are necessary for demonstrating AD F minimum values have been met). It is acknowledged that some MVHR systems have more than two speed settings, but this review is limited to the published guidance values for minimum low and minimum high rates in AD F. Table 3.2a: Summary of commissioning data available Number of systems reviewed Both speeds Normal speed only Boost Speed only No data 54 19 28 27 16 Thus, 50% of the systems can be judged to be only partially commissioned with respect to air flow. Of those that had partial commissioning data, a small number gave only the supply air values in normal speed and extract values in boost speed. These are the key values for demonstrating that the minimum requirement for 0.3 l/s per m2 for supply, and individual room boost extract rates had been met. Irrespective of completeness of commissioning, of greater concern is the reliability of the commissioning values recorded. Out of the 38 systems reviewed, 25 (66%) had either identical values to their design values, and/or the individual room extract rate values were identical to those published in AD F. Whilst it is accepted that there may be a degree of ‘rounding’ of recorded values during commissioning, the similarities between commissioned and design values are unlikely. There is a strong possibility that some systems have been provided with air flow commissioning values, even though the systems themselves have not been commissioned. Out of the 38 sets of commissioning data reviewed, only 6 (16%) systems have provided sufficient evidence to demonstrate that they have been satisfactorily commissioned with respect to minimum air flow rates and balancing. 3.3. Air flow rates Measured air flow rates were available for 52 properties. The air flow measurements used for this assessment were those taken during the BPE study, and not the original commissioned air flow values. 34 of the systems are represented in figure 3.3a, and are judged against AD F (2006), which was in force at the time. Out of the 34 systems, the minimum air flow requirement is met in 23 systems (68%), with two systems (H24_c and H24_d) failing significantly. A number of systems were commissioned to have higher air flow rates, meeting or exceeding the AD F (2010) air flow rates. In most cases, these are the more airtight dwellings (<3.0 (m3 /h)/m2 ), as summarised later.
  • 21. Characteristics and Performance of MVHR Systems: A Building Performance Evaluation Meta-Study 18 Figure 3.3a. Measured air flow rates compared to AD F (2006) Bold bars denote Passivhaus dwellings. Figure 3.3b. Measured air flow rates compared to AD F (2010) Bold bars denote Passivhaus dwellings Chart 3.3b displays systems where AD F (2010) was in force. Out of the 18 systems represented, only 6 (33%) meet the minimum air flow rate required. Across the 52 systems assessed, 27 were for dwellings with a tested air permeability of <3.0 (m3 /h)/m2 . Using AD F (2010) minimum dwelling ventilation rate for these, more airtight homes (irrespective if AD F (2010) was in force), only 33% met the minimum criteria. Specific extract air high rates (or boost speed ) for wet rooms are published in AD F for the removal of excess moisture production during cooking and bathing times. 0 5 10 15 20 25 30 35 40 45 litrespersecond Air flow rate (measured) compared to Part F requirements (appropriate to dwellings when Part F 2006 was in force) Measured Flow Rate (Supply) Measured Flow Rate (Extract) Minimum for Part F (2006) Minimum for Part F (2010) n(2006) = 34 (n < Part F = 11; n < Design = 14) 0 5 10 15 20 25 30 35 40 45 litrespersecond Air flow rate (measured) compared to Part F requirements (appropriate to dwellings when Part F 2010 was in force) Measured Flow Rate (Supply) Measured Flow Rate (Extract) Minimum for Part F (2010) n(2010) = 18 (n < Part F = 12)
  • 22. Characteristics and Performance of MVHR Systems: A Building Performance Evaluation Meta-Study 19 These extract rate values between the 2006 and 2010 revisions are the same and set the minimum value for these rooms, as illustrated in table 3.3a. Table 3.3a. Extract air: minimum high rate values AD F Room Minimum High Rate (l/s) Kitchen 13 Bathroom 8 Utility room 8 Sanitary (e.g. W.C. no bath/shower) 6 Figure 3.3c quantifies the individual room extract air high flow rates across the 48 systems assessed. The boxes show the upper and lower quartiles, and the median value. The whiskers show the minimum and maximum values from the dataset. The red dot highlights the minimum value required to satisfy AD F. Overall, the measured boost extract air flow rates meet the 13 l/s minimum for kitchens (AD F) in 44% of systems. 71% of bathrooms meet the 8 l/s requirement, whereas only 30% of en-suites and 38% of utility rooms meet the 8 l/s criteria. In W.C.’s, which have a lower extract flow rate requirement of 6 l/s, the flow rates were met in 77% of systems. Figure 3.3c Measured individual room extract flow rates in boost 3.4. System balance Achieving a reasonable balance between supply/intake air streams and extract/ exhaust air streams is important for heat recovery with an MVHR system. By achieving a reasonable system balance it can be assumed that all ventilation air entering and leaving the property passes via the heat exchanger, thus maximising the available heat recovery potential. An imbalance between these air streams can 0.00 5.00 10.00 15.00 20.00 25.00 Kitchen Bathroom En Suite Utility W.C. Litrespersecond(l.s-1) Measured Extract Flow (High) Rates Minimum AD F n = 48 n = 48 n = 8 n = 30n = 10 n<13 l/s = 27 n<8 l/s = 14 n<8 l/s = 7 n<8 l/s = 5 n<6 l/s = 7
  • 23. Characteristics and Performance of MVHR Systems: A Building Performance Evaluation Meta-Study 20 put the dwelling under a slight pressure differential, which in turn will allow ventilation air to find alternative air paths via the building envelope. This will likely have a bearing on the system heat recovery efficiency, although it has not been possible to explore this aspect in this meta-study. In practice, achieving a perfect balance, that is a balance of 0%, is usually impracticable to achieve. Some of this is due to the accuracy limitations of measurement devices used during commissioning and influences during commissioning (e.g. wind), and some is to do with the variability of some manufactured systems to allow such a degree of fine-tuning. In order to achieve a reasonable balance it is often necessary to set an imbalance between supply and extract fans. The amount of imbalance will depend upon the difference in resistances present in these two air streams, dictated by variables such as: the length of ducting; number of junctions, and bends; number of room outlets. AD F (2010) does not set imbalance criteria, and the only known specification for system balance is that set within the protocols for commissioning Passivhaus certified installations. The maximum allowable imbalance between intake and exhaust air flow for these systems is 10%. A slightly more relaxed allowance of 15% is taken as current accepted practice, although there is no known publication of this value. Figure 3.4a. Symmetrical mean percentage deviation between supply and extract rates * against dwelling reference denotes Passivhaus. Figure 3.4a shows the balance observed in 52 MVHR systems set at ‘normal’ speed. These values are taken from the sum of the individual room supply and extract rates, and not the intake and exhaust measurements, as these were not available in most cases. The red dotted line shows the 15% allowance. Out of the 52 systems, 25 (48%) have an imbalance of <15%, the remainder being above this, with 14 (27%) being significantly out of balance (deemed as >30%). Of the 15 Passivhaus systems, 6 show an imbalance of >10%. 3.5. Influence of duct type The type of ducting across 48 systems has been reviewed. The systems selected are those where data about the ducting type has been reported by the projects. This has been categorised into three broad types: 0 10 20 30 40 50 60 70 80 90 100 F7_a* H31_a* H5_a* H15_c* H8_b* H28_b* H29_b H8_a* H28_a* H20_b H20_d F37_a H29_a H17_a* H20_c F36_c H17_b* H14_b* H17_c* F7_b H33_a F36_b H32_b F4_a F36_a H21_a H20_a F7_c* F12_b* F4_b H25_a F37_a H30_a H35_a H22_a H24_e F37_a H30_b H32_a F12_a* H14_a H9_a H34_a H26_a H26_b F27_a F34_a Mean Percentage Deviation (Balance Between Supply/Extract) +
  • 24. Characteristics and Performance of MVHR Systems: A Building Performance Evaluation Meta-Study 21 1. Flexible: this is where 100% of the installed ducting for the system is flexible, irrespective of material or quality. 2. Hybrid: this is where the large majority of ducting is rigid, but some flexible elements have been used, particularly for final connections to room terminals and the MVHR fan unit. Some installations may have had flexible components for bends, offsets, or other awkward elements. 3. Rigid: this is where it is known that 100% of the installed ducting is rigid (an exception being final connections to the MVHR unit which is often a recommendation of some manufacturers), irrespective of material, e.g. plastic or metal. This review, limited by the data available, compared the measured air flow performance against the original design air flow. Although a fairly simple assessment, it is useful to determine any emerging trend for ducting types where system air flow performance is better than or equal to the design air flow. The design data used for this assessment is the original submitted design. The results from this review are presented in figure 3.5a. The upper segment of the chart (green background) represents systems where the measured air flow rates are equal to or greater than the design. The lower segment represents system air flow rates that do not meet the design air flow. The air flows for the supply (S) and extract (E) for each duct type are plotted. Figure 3.5a Duct types: measured airflow comparison with design air flow. Overall, 40% of hybrid ducted systems and 44% of flexible ducted systems meet their design air flow criteria. By comparison, the measured air flow in 88% of rigid-duct systems meet the design air flow criteria. This assessment is limited and some caveats need to be considered. For example, duct pressure drop is not known for any system in the data set, air leakage through ducting is not known, the fan system employed by the MVHR may either be constant power or constant velocity types, quality of installation and commissioning is not known, etc. The results do however indicate a trend toward improved performance with rigid ducting systems. 0 5 10 15 20 25 30 35 40 45 0 5 10 15 20 25 30 35 40 45 Measuredairflow(l/s) Min Part F Design air flow (l/s) Duct type vs air flow 100% Flexible (S) 100% Flexible (E) Hybrid (S) Hybrid (E) 100% Rigid (S) 100% Rigid (E)
  • 25. Characteristics and Performance of MVHR Systems: A Building Performance Evaluation Meta-Study 22 4. In-use performance 4.1. Ventilation performance Levels of carbon dioxide indoors correlate well with human occupancy and human- generated pollutants. There is a general acceptance that carbon dioxide keeps ‘bad company’ and that levels above 1000 ppm are indicative of poor ventilation rates. The derivation of this is well evidenced7 and corresponds well with a ventilation rate of 8 l/s per person identified in CIBSE Guide A8 , which also sets down classifications for IAQ and CO2 concentrations associated with these. Health effects of ventilation are also well evidenced and whilst there is less literature available as to these effects in housing, a recent paper by Wargocki9 identifying associations between carbon dioxide levels and health concluded, “The ventilation rates above 0.4 h-1 or CO2 below 900 ppm in homes seem to be the minimum level to protect against health risks based on the studies reported in the scientific literature”. There are however some limitations to the use of CO2 as an indicator. The rise in levels is relative to external levels, which may vary by location and time; different projects may be using different types of equipment, placement and methodology; the degree of range and accuracy is not known; and periods of occupancy are likely to vary over time and between projects. Levels of CO2 may also be unconnected to pollutants unrelated to occupancy, such as off-gassing from building materials, carpets and furniture. Nevertheless, in the context of concern over ventilation rates, CO2 levels provide a useful indicator of relative levels of ventilation and the BPE projects have used CO2 measurements as a low cost means of examining ventilation. Projects also recorded temperature and relative humidity levels, and in a limited number of projects, occupancy (through passive infrared (PIR) sensors) and window opening (through contact sensors) were recorded. This data has been examined to evaluate the comparative performance across a range of projects. Available data (maximum, minimum, range and average values) for each parameter was extracted manually from the BPE section in Embed and transferred to Excel for analysis. Cleaning of the data was performed within the Embed platform, where data greater than two standard deviations from the median was classified as ‘in error’ and was not used in the calculations. Monthly data was constructed from average daily rollups for instant readings. After initial observation, it was evident that the available dataset for MVHR dwellings was relatively limited and there was not a complete overlap with the dataset on system characteristics (only 21 dwellings with both environmental and system characteristics data). Properties were selected based on the availability of data and the completeness of the datasets. A decision therefore was made to include data pertaining to non-MVHR dwellings (also collected as part of the BPE programme) in the analysis to provide a basis for comparison. 4.1.1. Comparative ventilation performance The internal CO2 levels were initially compared to available data of non-MVHR dwellings (dwellings that were ventilated naturally or with Mechanical Extract 7 Porteous, Colin (2011) Sensing a historic low-CO2 future. Chemistry, Emission Control, Radioactive Pollution and Indoor Air Quality, Rijeka, Croatia: Intech. 8 CIBSE. Guide A: Environmental design. 7th Edition, London: CIBSE, 2006 9 Wargocki P (2013) The effects of ventilation in homes on health. International Journal of Ventilation 12(2): 101-118.
  • 26. Characteristics and Performance of MVHR Systems: A Building Performance Evaluation Meta-Study 23 Ventilation). Data is shown for living rooms (MVHR n=18-22, non-MVHR n=15) and bedrooms (MVHR n=20-23, non-MVHR n=20) in three sample months (February, April and August 2013). Comparison graphs show mean and peak levels of CO2 during February (figure 4.1a and 4.1b) and are ranked in order of magnitude. The full range of graphs is shown in Appendix B and the data is summarised in Tables 4.1a and 4.1b. Table 4.1a. Average living room CO2 levels (ppm) in MVHR and Non-MVHR homes MVHR (n=18-22) Non-MVHR (n=15) Peak CO2 Mean CO2 Range of CO2 Peak CO2 Mean CO2 Range of CO2 Feb (mean) 1046 754 492 2013 867 1588 Apr (mean) 1206 754 669 1768 783 1388 Aug (mean) 966 631 471 1675 726 1262 Table 4.1b. Bedroom CO2 levels (ppm) MVHR (n=20-23) Non-MVHR (n=20) Peak CO2 Mean CO2 Range of CO2 Peak CO2 Mean CO2 Range of CO2 Feb (mean) 1122 762 614 2514 1118 2040 Apr (mean) 1275 749 779 2638 1103 2121 Aug (mean) 1120 644 674 2623 966 2189 Figure 4.1a. February average (mean) living room CO2 levels in MVHR and Non-MVHR homes * Passivhaus dwellings * * * * * * * * * * * 0 10 20 30 40 50 60 70 80 90 0 100 200 300 400 500 600 700 800 900 1000 1100 1200 1300 1400 F11_b H20_a H14_a F4_b F12_b H8_b F1_d H16_a H9_a H15_c F4_a H17_b H5_a H20_d H8_a F11_c F11_a H11_a F1_a H15_b F7_c H6_b H9_B H11_b F1_e H11_d H15_a H11_c H6_a H17_c F7_a H17_d F19_a F11_d H19_b H19_a H20_c Floorare(m2)perperson CarbonDioxide(ppm) February Mean Living Room CO2 Levels (MVHR and Non-MVHR) Feb Mean CO2 (MVHR) Feb Mean CO2 (Non-MVHR) Floor area (m2) per person
  • 27. Characteristics and Performance of MVHR Systems: A Building Performance Evaluation Meta-Study 24 Figure 4.1b. February Peak Bedroom CO2 levels in MVHR and Non-MVHR homes * Passivhaus dwellings Figure 4.1c. Peak Living room CO2 levels in MVHR and Non-MVHR homes * * * * * * * * * * * * * * 0 20 40 60 80 100 120 140 160 180 200 0 500 1000 1500 2000 2500 3000 3500 4000 4500 5000 H14_a1 H8_b1 F1_d1 H5_a1 H10_a1 F12_b1 F11_b1 H16_a1 H15_c1 F1_b1 H8_a1 H15_c2 H17_b1 F7_a1 F7_b1 F11_d1 F19_a1 H15_a2 H17_d1 H11_d1 H15_a1 H6_a1 H17_d2 H17_c1 H11_a2 H6_b1 F11_c1 H11_c1 H11_d2 H19_a1 H11_b2 F11_a1 H19_b1 H15_b1 H11_b1 H11_c2 H11_a1 Totalfloorarea(m2)perperson CarbonDioxide(ppm) February Peak Bedroom CO2 Levels (MVHR and Non-MVHR) Feb Peak CO2 (MVHR) Feb Peak CO2 (Non-MVHR) Floor area (m2) per person 0% 20% 40% 60% 80% 100% MVHR Non-MVHR MVHR Non-MVHR MVHR Non-MVHR February April August Percentageofmonitoredlivingrooms Peak living room CO2 levels (MVHR and Non MVHR dwellings) Percentage ≤1000 ppm Percentage >1000, <1500 ppm Percentage ≥1500 ppm
  • 28. Characteristics and Performance of MVHR Systems: A Building Performance Evaluation Meta-Study 25 Figure 4.1d. Peak Bedroom CO2 levels in MVHR and Non-MVHR homes It is important to note that the limitations of data access means that average levels are not time weighted and are therefore averaged across the entire month, regardless of times or intensity of occupation. Furthermore, although data in Embed has been checked to omit spurious results, individual peaks may be isolated events. Nevertheless, there is a clear differentiation between the dwellings with and without MVHR systems, with MVHR systems in general having lower levels of CO2. The difference is more marked when comparing peak CO2 levels in living rooms and bedrooms, which were noticeably higher in the non-MVHR dwellings (see Figures 4.1c and 4.1d). Both peak and average levels were higher in the bedrooms and in these spaces the difference was much greater in non-MVHR houses. The impact of ventilation provision on indoor CO2 levels was most evident during February, which is likely due to a lower prevalence of window opening during the winter season. However higher CO2 levels were also found in general in non-MVHR compared to MVHR dwellings during both April and August months, but in the summer the picture is more mixed, with more MVHR houses with higher CO2 levels. This may be due to a shift toward natural ventilation strategies in summer with greater window opening, but may also be due in some cases to MVHR systems being turned off in summer. This comparison may indicate that the homes with MVHR systems achieved a better ventilation outcome compared to non-MVHR homes and, specifically, that the use of an MVHR system may have attributed to improvements of ventilation levels in these homes. There are some exceptions to this, which are evident through the outliers identified in the graphs. In the case of dwellings with MVHR systems, the disabling of the system may mean that the dwelling has effectively become non-MVHR. Reporting of the projects suggest that in a number of cases systems may be disabled due to issues of noise and understanding, and that dwellings then revert to a window opening strategy (in the absence of any means of background ventilation); examples of these are described in later case studies. These findings may however be flattering to MVHR dwellings and should be considered in light of previous studies that have demonstrated significant issues with ventilation effectiveness in naturally ventilated dwellings with low air permeability, 0% 20% 40% 60% 80% 100% MVHR Non-MVHR MVHR Non-MVHR MVHR Non-MVHR February April August Percentageofmonitoredbedrooms Peak bedroom CO2 levels (MVHR and Non MVHR dwellings) Percentage ≤1000 ppm Percentage >1000, <1500 ppm Percentage ≥1500 ppm
  • 29. Characteristics and Performance of MVHR Systems: A Building Performance Evaluation Meta-Study 26 particularly the performance of trickle vents in practice10 . Furthermore, analysis of the occupancy levels and floor area data indicates that many of the homes with MVHR systems had lower occupancy densities than non-MVHR dwellings, which is likely to have significantly influenced the results. The total floor area per person (m2 ) was determined by dividing the footprint of each home by the stated number of occupants (extracted from the DomEARM spreadsheets). Since occupancy levels were not objectively measured during the Building Performance Evaluation process, these figures represent estimated occupancy densities only, and therefore do not take into consideration, for example, changes of household occupancy over the measurement period, employment status (working at home or away), or occupancy levels in specific rooms. Nevertheless, the prospect that a dwelling which has a constantly running mechanical system supplying air to these rooms would result in an improved ventilation provision is not unreasonable. Of remaining concern however is what the effects are when such a system is not in operation or operating correctly. 4.1.2. Ventilation performance in dwellings with MVHR systems Focusing particularly on the dwellings with MVHR systems, an analysis of the limited available monitoring data did not produce any significant differentiation between dwellings. Figure 4.1e presents average bedroom levels of CO2 for February, April and August. CO2 levels were generally lowest during the summer season, attributed most likely to a greater prevalence of window opening. Of interest is that peak levels were rarely above 1000ppm in all seasons in the majority of dwellings, but those that were high were significantly higher. Whilst the majority are Passivhaus, there was no clear association between these and lower CO2 (see Table 4.1c and Figure 4.1e), or between houses with higher flow rates. However given the relatively small sample size, there will be other confounding variables, for example room occupancy and flow rate to the room being monitored. Table 4.1c. Average living room CO2 levels (ppm) in Passivhaus and Non-Passivhaus homes Passivhaus (n=12-15) Non-Passivhaus (n=11-12) Peak CO2 Mean CO2 Range of CO2 Peak CO2 Mean CO2 Range of CO2 Feb (mean) 1134 757 599 946 748 372 Apr (mean) 1265 691 795 1138 829 522 Aug (mean) 1157 628 706 758 633 215 10 Sharpe T, Porteous C, Foster J and Shearer D (2014) An assessment of environmental conditions in bedrooms of contemporary low energy houses in Scotland. Indoor and Built Environment 23 (3): 393- 416.
  • 30. Characteristics and Performance of MVHR Systems: A Building Performance Evaluation Meta-Study 27 Figure 4.1e. Average bedroom CO2 levels in dwellings with MVHR * Passivhaus dwellings Whilst these averages were generally lower than 1000ppm the limitations of the data are such that these figures represent average bedroom levels for the whole month and therefore will include significant periods of time when the bedrooms were most likely unoccupied, particularly during the day time; occupied periods may have higher CO2 averages. Figure 4.1f. Peak bedroom CO2 levels in dwellings with MVHR * Passivhaus dwellings * * * * * * * * * * * * * * 0 20 40 60 80 100 120 140 160 180 200 0 500 1000 1500 2000 2500 3000 Floorarea(m2)perperson CarbonDioxide(ppm) February, April and August 2013 Average Bedroom CO2 Levels Feb Mean CO2 Apr Mean CO2 Aug Mean CO2 Floor area (m2) per person * * * * * * * * * * * * * 0 20 40 60 80 100 120 140 160 180 200 0 500 1000 1500 2000 2500 3000 Floorarea(m2)perperson CarbonDioxide(ppm) February, April and August 2013 Peak Bedroom CO2 Levels Feb Peak CO2 Apr Peak CO2 Aug Peak CO2 Floor area (m2) per person
  • 31. Characteristics and Performance of MVHR Systems: A Building Performance Evaluation Meta-Study 28 Peak CO2 levels therefore may be considered a better indicator of bedroom ventilation rates, (see Figure 4.1f). This graph demonstrates that whilst in most bedrooms peak CO2 levels remained relatively low (<1,500 ppm), in a few cases this value was significantly exceeded. Peak CO2 levels exceeded 1,000 ppm in 65% of monitored bedrooms during February, 59% during April and 35% during August. Figure 4.1g. Peak living room CO2 levels in dwellings with MVHR * Passivhaus dwellings In the monitored MVHR living rooms, levels peaked above 1000ppm in 45% of homes during February, 55% of homes during April and 23% of homes during August, as illustrated in Figure 4.1g. In the majority of cases (73%) however, peak levels did not exceed 1500ppm. Similar to the bedroom results, living room peak CO2 levels were highest in H17_c1 and H17_d1, suggesting particular problems with ventilation rates in these homes. 4.2. Comparative relative humidity levels One of the potential consequences of ventilation performance is the impact on moisture in the buildings. Ventilation rates set in regulations are primarily designed to control moisture (rather than a more general requirement of IAQ) so a comparison may be made of relative humidity (RH) levels in MVHR and Non-MVHR dwellings. It should be noted that the RH sample size was not identical to the CO2 data since a larger dataset was available for MVHR dwellings compared to Non-MVHR dwellings. The results are summarised in Tables 4.2a and 4.2b. * * * * * * * * * 0 10 20 30 40 50 60 70 80 90 0 500 1000 1500 2000 2500 3000 FloorArea(m2)perperson CarbonDioxide(ppm) February, April and August 2013 Peak Living room CO2 Levels Feb Peak CO2 Apr Peak CO2 Aug Peak CO2 Floor area (m2) per person
  • 32. Characteristics and Performance of MVHR Systems: A Building Performance Evaluation Meta-Study 29 Table 4.2a. Living room relative humidity levels (%) MVHR (n=34-36) Non-MVHR (n=15-17) Minimum RH Peak RH Mean RH Range of RH Min RH Peak RH Mean RH Range of RH Feb (mean) 30.9 44.7 37.3 13.8 22.0 48.3 31.7 26.3 Apr (mean) 29.1 47.4 37.9 18.3 20.6 47.6 31.2 26.9 Aug (mean) 42.0 56.8 49.5 14.8 33.8 57.3 44.5 23.5 Table 4.2b. Bedroom relative humidity levels (%) MVHR (n=37-39) Non-MVHR (n=20-24) Min RH Peak RH Mean RH Range of RH Min RH Peak RH Mean RH Range of RH Feb (mean) 30.9 45.5 37.2 14.6 26.8 48.5 36.7 21.7 Apr (mean) 29.1 48.7 38.2 19.6 24.2 49.2 35.0 25.0 Aug (mean) 41.9 57.5 49.1 15.6 38.1 58.5 47.6 20.4 In general RH levels were within reasonable ranges, tending toward the lower end. The average and minimum living room and bedroom RH levels (during February, April and August) were generally higher in dwellings with MVHR systems but were not at unduly extreme levels. However, these relationships are inverted when considering temperature (Figure 4.2a), in general, dwellings with MVHR systems had lower and more stable temperatures, which suggests that the RH is more a function of temperature than ventilation in this data.
  • 33. Characteristics and Performance of MVHR Systems: A Building Performance Evaluation Meta-Study 30 Figure 4.2a. February mean living room temperature and RH% (MVHR and Non MVHR) * Passivhaus dwellings However, a clear difference was in the range of relative humidity levels between MVHR and Non-MVHR dwellings. In general RH levels were more stable during all monitored seasons (see Table 4.2a and 4.2b) in the MVHR houses and this trend was particularly evident during winter (Figures 4.2b and 4.2c). * * * * * * * * * * * * * * 0 20 40 60 80 100 120 140 160 180 0 10 20 30 40 50 60 70 80 90 H3_h H3_e H9_b H3_g F11_a H14_a H17_b H11_d F11_c F11_b H11_a H15_b H14_b H8_b H11_c H6_b F11_d H3_d H19_b H8_a H11_b F1_b H17_d F1_e H15_c F1_d H9_a H16_a H19_a H17_c F19_a H3_b H15_a H6_a F7_b H3_a F4_b F12_a H20_b H20_d F7_c F12_b F7_a H10_a H20_c H20_a Totalfloorarea(m2)perperson RelativeHumidity(%) February Mean Living Room Relative Humidity (MVHR and Non-MVHR) Feb Mean (MVHR) Feb Mean (Non-MVHR) Total floor area (m2) per occupant * * * * * * * * * * * * * * 0 20 40 60 80 100 120 140 160 180 12 14 16 18 20 22 24 26 28 30 H9_a H10_a F12_b H3_a H15_c H5_a F11_b H3_f F4_b H20_c F1_d F7_b F4_a F7_c H3_e F7_a H20_b H3_b F11_d F19_a H8_b H3_d H11_c H15_a H3_h F11_c H11_b H19_a H14_b H20_d F11_a H17_c H16_a F1_b H19_b H17_d F1_e H17_b H11_d H8_a H3_g H15_b H14_a H11_a H6_b H6_a H9_b Floorarea(m2)perperson Temperature(°C) February Mean Living Room Temperature (MVHR and Non-MVHR) Feb Mean Temp (MVHR) Feb Mean Temp (Non-MVHR) Total floor area (m2) per person
  • 34. Characteristics and Performance of MVHR Systems: A Building Performance Evaluation Meta-Study 31 Figure 4.2b. Range of February living room relative humidity levels * Passivhaus dwellings Figure 4.2c. Range of February bedroom relative humidity levels * Passivhaus dwellings * * * * * * * * * * * * * * 0 20 40 60 80 100 120 140 160 180 200 0 5 10 15 20 25 30 35 40 45 50 H20_a H14_a H9_b H10_a H3_b H3_h H3_a H9_a H3_d H17_d H20_c F7_c H16_a H15_c H14_b H3_e H20_b F7_a F1_b F1_e F7_b F19_a H17_b F12_a H8_b H3_g F1_d H17_c H11_d F4_b H15_b H11_b H11_c H15_a F11_c H6_a F11_a H8_a H6_b H11_a F11_b H19_b H19_a H20_d F11_d Floorarea(m2)peroccupant RelativeHumidity(%) February Living Room Relative Humidity Range (MVHR and Non-MVHR) Feb Range (MVHR) Feb Range (Non-MVHR) Total floor area (m2) per occupant * * * * * * * * * * * * * * * * 0 20 40 60 80 100 120 140 160 180 200 0 5 10 15 20 25 30 35 40 45 50 H9_a1 H14_a1 H3_h1 H3_f1 H20_c1 H3_f2 H3_h2 F7_c1 H3_e2 H20_b1 H3_e1 F12_a1 H3_g1 H15_a2 H17_d1 F7_b1 H15_c1 H17_d2 H3_g2 F1_b1 H9_a1 F12_b1 H3_a1 H8_b1 F7_a1 F1_d1 H15_a1 H11_d2 F11_b1 H17_b1 H19_b1 H11_c2 F19_a1 H20_d1 F11_c1 H17_c1 H15_b1 H15_c2 F4_b1 H11_d1 F11_a1 H11_c1 H11_b1 H11_b2 H11_a1 H8_a2 H6_a1 H6_b1 F11_d1 H8_a1 H16_a1 Totalfloorarea(m2)peroccupant RelativeHumidity(%) February Bedroom Relative Humidity Range (MVHR and Non-MVHR) February Range (MVHR) February Range (Non-MVHR) Total floor area (m2) per occupant
  • 35. Characteristics and Performance of MVHR Systems: A Building Performance Evaluation Meta-Study 32 4.2.1. Relative humidity in dwellings with MVHR A more detailed analysis of the dwellings with MVHR systems found average and peak living room levels were generally low (<70%) during February, April and August months, as illustrated in Figure 4.2.d. Living room relative humidity levels were highest during August, with the exception of H20_a, H20_b, H20_c. There does not appear to be any association between Passivhaus and non-Passivhaus certified dwellings, or between systems that were out of balance. Highest RH levels were seen in August with 35% of MVHR dwellings recording peaks > 60% RH. As indicated by the CO2 data this suggests high rates of window opening. Figure 4.2.d. Average and peak living room relative humidity levels in MVHR dwellings * Passivhaus dwellings * * * * * * * * * * * * * * 10 20 30 40 50 60 70 80 RelativeHumidity(%) Average Living Room Relative Humidity Levels in MVHR dwellings Feb Mean April Mean August Mean * * * * * * * * * * * * * * 10 20 30 40 50 60 70 80 RelativeHumidity(%) Peak Living Room Relative Humidity Levels in MVHR dwellings Feb Max April Max August Max
  • 36. Characteristics and Performance of MVHR Systems: A Building Performance Evaluation Meta-Study 33 Figure 4.2e. Minimum living room relative humidity levels in dwellings with MVHR * Passivhaus dwellings Monitored relative humidity levels fell below 30%RH in 48% of living rooms during February and 58% of living rooms during April (see Figure 4.2e). Average humidity levels were below 30% in roughly a quarter of monitored living rooms during February (26%) and April (23%) months. Figure 4.2f. Peak bedroom relative humidity levels in dwellings with MVHR * Passivhaus dwellings In the bedrooms, average humidity levels remained below 70%, with levels peaking above this in 15% of cases (Figure 4.2f). Figure 4.2g shows the percentage of rooms that had average relative humidity levels between 40 and 60%. It is apparent that low RH is common in MVHR dwellings during the heating season. * * * * * * * * * * * * * * 0 10 20 30 40 50 60 70 80 RelativeHumidity(%) Minimum Living Room Relative Humidity Levels in MVHR dwellings Feb Minimum April Minimum August Minimum * * * * * * * * * * * * * * * * 0 10 20 30 40 50 60 70 80 H14_a1 H3_e2 H3_h1 H3_e1 H3_h2 H3_g2 H17_d1 H3_g1 H17_b1 H3_f1 H8_b1 H3_f2 F1_b1 H17_d2 F1_d1 H15_c1 F12_a1 H17_c1 H3_a1 H10_a1 F7_b1 H15_c2 H9_a1 H20_b1 F4_b1 F7_c1 F12_b1 H8_a2 F7_a1 H8_a1 H20_d1 H20_c1 H16_a1 RelativeHumidity(%) Peak Bedroom Relative Humidity Levels in MVHR dwellings February Peak April Peak August Peak
  • 37. Characteristics and Performance of MVHR Systems: A Building Performance Evaluation Meta-Study 34 Figure 4.2g. Average relative humidity levels in dwellings with MVHR 4.3. Comparative indoor temperatures Data on temperature is summarised in Tables 4.3a and 4.3b. An observation of this data is that in general average temperatures were higher in Non-MVHR dwellings during February and April, but higher in MVHR dwellings during summer. These findings may help to explain the higher relative humidity levels observed in MVHR dwellings (compared to Non-MVHR dwellings) during February and April. Table 4.3a. Living room temperature levels (°C) MVHR (n=34-35) Non-MVHR (n=15-17) Min temp Peak temp Mean temp Range of temp Min temp Peak temp Mean temp Range of temp Feb (mean) 18.7 23.3 21.1 4.6 18.2 27.3 22.8 9.1 Apr (mean) 18.7 23.5 21.3 4.8 17.9 28.4 23.0 10.4 Aug (mean) 22.5 26.2 24.2 3.7 20.5 27.7 23.5 7.2 Table 4.3b. Bedroom temperature levels (°C) MVHR (n=42-45) Non-MVHR (n=21-24) Min temp Peak temp Mean temp Range of temp Min temp Peak temp Mean temp Range of temp Feb (mean) 18.0 22.5 20.3 4.4 17.9 24.8 21.6 6.9 Apr (mean) 18.2 22.8 20.7 4.7 18.3 25.7 22.3 7.4 Aug (mean) 22.3 26.1 24.1 3.9 20.2 26.2 23.2 6.0 0% 20% 40% 60% 80% 100% Bedroom Living room Bedroom Living room Bedroom Living room February April August Percentageofmonitoredrooms Average Relative Humidity Levels in MVHR dwellings RH <40% RH >40%, <60% RH >60%
  • 38. Characteristics and Performance of MVHR Systems: A Building Performance Evaluation Meta-Study 35 Correspondingly, an analysis of peak temperatures found higher levels in Non-MVHR dwellings when compared to MVHR dwellings. This trend was most evident in the monitored living rooms during February, (Figure 4.3a). Higher average and peak temperatures during February in Non-MVHR dwellings may be attributed to a number of factors, including oversizing of heating systems in Non-MVHR homes or a lack of awareness of the post heater (where available) in the dwellings with MVHR systems. Average temperatures in MVHR dwellings were closed to the expected norms, so this suggests a tendency for overheating in non-MVHR dwellings. Nevertheless, incidences of high temperatures were also observed in MVHR dwellings. Figure 4.3a. Peak February living room temperatures in MVHR and Non MVHR homes * Passivhaus dwellings As with the data on relative humidity, an apparent trend is for houses with MVHR systems to have greater temperature stability, with a greater dispersion of indoor hygrothermal conditions found in dwellings without MVHR systems. For example, Figures 4.3b and 4.3c present the range of living room temperatures during April and August months. Despite the small sample size and uneven sample numbers, the tendency towards lower temperature ranges in MVHR dwellings is clear. * * * * * * * * * * * * * * 0 20 40 60 80 100 120 140 160 180 200 14 16 18 20 22 24 26 28 30 32 34 H9_a H10_a F12_b H3_a F4_b H3_f F1_d F4_a F7_c H5_a H20_b H20_c F7_a H3_e H3_d H15_c H3_b F7_b H8_b H14_b F1_b H3_h F1_e H16_a H15_a F11_d H14_a F19_a H11_b H3_g H8_a H11_d F11_c H19_a H17_c H19_b H17_d H11_c H9_b H15_b H11_a H6_b H6_a F11_a H20_d H17_b F11_b Totalfloorare(m2)perperson Temperature(°C) February Peak Living Room Temperature (MVHR and Non-MVHR) Feb Peak Temp (MVHR) Feb Peak Temp (Non-MVHR) Total floor area (m2) per person
  • 39. Characteristics and Performance of MVHR Systems: A Building Performance Evaluation Meta-Study 36 Figure 4.3b. Range of April living room temperatures in MVHR and Non MVHR homes * Passivhaus dwellings Figure 4.3c. Range of August living room temperatures in MVHR and Non MVHR homes * Passivhaus dwellings The temperatures observed in the MVHR dwellings were closer to optimal conditions. This may be affected by the prevalence of Passivhaus dwellings in this cohort, but may also be due to poor performance in non-MVHR houses which may have oversized and poorly controlled heating systems. Whilst it may be considered that having stable temperatures close to optimum conditions is beneficial in terms of energy consumption and indoor comfort, a growing body of research suggests that temperature fluctuations may in fact be beneficial for * * * * * * * * * * * * * * 0 20 40 60 80 100 120 140 160 180 200 0 2 4 6 8 10 12 14 16 18 20 F4_a F4_b F7_a F1_d H14_b H8_a H20_b H3_d H3_h F7_c F1_b H9_b H3_b H3_e H8_b H3_f H14_a H6_a H3_g F7_b F12_b H20_c H20_d H10_a F1_e H16_a H6_b H9_a H5_a H15_a F11_d H17_d H17_c H19_a H15_c F19_a H3_a H11_c F11_a H11_b H17_b H15_b H11_a H11_d H19_b F11_c F11_b Totalfloorare(m2)perperson Temperature(°C) April Living Room Temperature Range (MVHR and Non-MVHR) Apr Temp Range (MVHR) Apr Temp Range (Non-MVHR) Total floor area (m2) per person * * * * * * * * * * * * * * 0 20 40 60 80 100 120 140 160 180 200 0 2 4 6 8 10 12 14 16 18 20 F1_d F12_b F7_a F7_c F7_b H8_a F4_a H14_a H16_a H10_a F1_b H3_f H20_c F4_b H3_b H5_a H20_d H3_g H3_h H3_e H20_b F1_e H3_d H14_b H8_b H6_a H15_a H3_a H9_a H9_b H6_b H17_c H15_c H17_d H11_d F19_a H19_a H15_b F11_c F11_b H11_b F11_d H17_b H11_c H19_b F11_a H11_a Totalfloorare(m2)perperson Temperaturerange(°C) August Living Room Temperature Range (MVHR and Non-MVHR) Aug Temp Range (MVHR) Aug Temp Range (Non-MVHR) Total floor area (m2) per person
  • 40. Characteristics and Performance of MVHR Systems: A Building Performance Evaluation Meta-Study 37 health11 and that lack of temperature stimulation indoors may result in thermal monotony12 . This may be particularly problematic during the summer season if occupants are exposed to repeatedly high temperatures indoors. In summer a differentiation between MVHR and non-MVHR was less clear (see appendix B), with some MVHR houses having very high peak temperatures. Whilst the overall trend for MVHR houses is positive, there are outliers where conditions are poorer. 4.3.1. Indoor temperatures in dwellings with MVHR Looking at the MVHR houses only, no obvious trends were apparent in terms of Passivhaus or system balance. Figures 4.3d and 4.3e present average and peak bedroom temperatures in dwellings with MVHR systems. It should be acknowledged that these values are for the whole month, therefore are likely to include significant periods of time where the rooms were unoccupied. Figure 4.3d. Average bedroom temperatures in dwellings with MVHR * Passivhaus dwellings Without detailed occupancy data and external weather data, it may not be applicable to compare measured indoor temperatures with comfort criteria. Nevertheless, it is important to highlight that average temperatures exceeded 25°C (Passivhaus overheating criteria) during August in 18% of MVHR bedrooms, with peak levels exceeding 28°C in 11% (Figure 4.3e). 11 van Marken Lichtenbelt, Wouter D (2015) To Comfort Or Not to Comfort, Keynote Presentation at Healthy Buildings Conference, Eindhoven, 18-20th may, 2015. 12 de Dear, RJ and Brager, GS (2002) Thermal comfort in naturally ventilated buildings: revisions to ASHRAE Standard 55. Energy and Buildings 34(6): 549-561. * * * * * * * * * * * * * * * * * 8 10 12 14 16 18 20 22 24 26 28 30 H8_b1 H10_a1 H15_c1 H3_d1 H14_b1 H14_a1 H3_e2 F4_b1 F12_a1 H3_c2 F7_a1 H3_e1 H16_a1 H3_f1 H15_c2 H3_h1 H3_a1 H3_h2 H3_c1 H3_f2 H3_g1 H20_d1 H3_g2 H17_c1 F7_c1 H9_a1 H8_a1 F12_b1 H20_a1 H20_b1 H17_b1 F7_b1 H8_a2 H17_d1 H17_d2 H20_c1 F1_b1 F1_d1 Temperature(°C) Average Bedroom Temperatures (MVHR dwellings) Feb Mean April Mean August Mean
  • 41. Characteristics and Performance of MVHR Systems: A Building Performance Evaluation Meta-Study 38 Figure 4.3e. Peak bedroom temperatures in dwellings with MVHR * Passivhaus dwellings Figure 4.3f. Average living room temperatures in MVHR dwellings * Passivhaus dwellings Correspondingly, in the monitored living rooms (Figures 4.3f and 4.3g), average temperatures exceeded 25°C in 31% of MVHR dwellings during August, with levels peaking above 28°C in 16%. These results suggest issues with summertime overheating in a number of the MVHR dwellings. This may be attributed to a lack of summer by-pass capabilities in some homes, or systems being disabled in the summer, which is also suggested by the CO2 and RH data. Whilst this may be expected, or indeed planned, it raises questions about the effectiveness of this in certain rooms which may be less tolerant of window opening due to issues of noise or security. It is interesting to note that despite the majority of dwellings demonstrating temperature distinctions between seasons, some dwellings appear to maintain constant temperatures year round, with average February or April temperatures exceeding August temperatures in some cases. * * * * * * * * * * * * * * * * * 8 10 12 14 16 18 20 22 24 26 28 30 H8_b1 H15_c1 F7_a1 H10_a1 F4_b1 F12_a1 H14_b1 H14_a1 H16_a1 H3_e1 H3_c2 H15_c2 H3_h1 H3_d1 F7_c1 H3_e2 F12_b1 H3_g1 H3_h2 H3_g2 H3_f1 F7_b1 H20_d1 H3_f2 H3_c1 H17_c1 H8_a2 H8_a1 H20_b1 H20_a1 F1_d1 H9_a1 H3_a1 F1_b1 H20_c1 H17_d2 H17_b1 H17_d1 Temperature(°C) Peak Bedroom Temperatures (MVHR dwellings) Feb Peak April Peak August Peak * * * * * * * * * * * * * * 8 10 12 14 16 18 20 22 24 26 28 30 H8_b H10_a H3_a H14_b H15_c F4_b H3_e H16_a H3_d H20_d F7_a H17_b H17_c F4_a H14_a H3_f H9_a H3_h H3_g F12_b F7_c H20_b H3_b H17_d F7_b H9_b H5_a H8_a F1_d H20_c F1_b F1_e Temperature(°C) Average Living Room Temperature (MVHR dwellings) Feb Mean April Mean August Mean
  • 42. Characteristics and Performance of MVHR Systems: A Building Performance Evaluation Meta-Study 39 Figure 4.3g. Peak living room temperatures in MVHR dwellings * Passivhaus dwellings 4.4. Comparative vapour pressure levels Given the anomalies with regard to RH and temperature data, this data was used to calculate vapour pressure levels in the dwelling as a means to identify possible risks associated with moisture. Vapour Pressure (VP) levels in the monitored dwellings were calculated using the following equation: 𝑒 𝑜 = 0.6108 𝑒𝑥𝑝 ((17.27 × 𝑇)/(𝑇 + 273.15)) 𝑒 𝑎 = (𝑅𝐻/100) × 𝑒 𝑜 Where: 𝑒 𝑜 = Saturation Vapour Pressure (kPa) 𝑇 = Temperature (° C) 𝑒 𝑎 = Actual Vapour Pressure (kPa) 𝑅𝐻 = Relative Humidity (%) Summary data is shown in Tables 4.4a and 4.4b. There is a noticeable difference between average, peak and range of VP in MVHR and Non-MVHR dwellings (see for example Figure 4.4a), which corresponds to the findings from the temperature and relative humidity analysis. Figure 4.4b illustrates the average VP across MVHR and non-MVHR houses during August. Mean August vapour pressure levels were significantly lower in MVHR dwellings, with some notable exceptions, and the range in VP is also generally smaller in houses with MVHR. This supports the premise that use of an MVHR system may help to provide greater level of stability of hygrothermal conditions indoors, when compared to natural or Mechanical Extract Ventilation strategies. * * * * * * * * * * * * * * 8 10 12 14 16 18 20 22 24 26 28 30 H10_a H8_b H14_b F7_a F4_b H3_a H16_a H14_a F12_b F4_a H3_e H20_d H3_f F7_c H3_d H15_c F7_b H17_c H3_g H3_h F1_d H8_a H3_b H5_a H9_a H20_b H20_c F1_b H17_d H17_b H9_b F1_e Temperature(°C) Peak Living Room Temperature (MVHR dwellings) Feb Peak April Peak August Peak
  • 43. Characteristics and Performance of MVHR Systems: A Building Performance Evaluation Meta-Study 40 Table 4.4a. Living room vapour pressure (kPa) MVHR (n=31-34) Non-MVHR (n=15-17) Min VP Peak VP Mean VP Range of VP Min VP Peak VP Mean VP Range of VP Feb (mean) 0.64 1.25 0.90 0.61 0.47 1.76 0.88 1.29 Apr (mean) 0.61 1.36 0.95 0.74 0.43 1.82 0.88 1.39 Aug (mean) 1.15 1.92 1.49 0.78 0.82 2.12 1.29 1.30 Table 4.4b. Bedroom vapour pressure (kPa) MVHR (n=33-37) Non-MVHR (n=19-22) Min VP Peak VP Mean VP Range of VP Min VP Peak VP Mean VP Range of VP Feb (mean) 0.65 1.29 0.90 0.63 0.52 1.54 0.93 1.02 Apr (mean) 0.61 1.37 0.94 0.76 0.51 1.61 0.94 1.10 Aug (mean) 1.15 1.98 1.49 0.83 0.90 1.98 1.34 1.08 Figure 4.4a. February living room vapour pressure ranges in MVHR and Non-MVHR homes * Passivhaus dwellings * ** *** ** ** ** * * * 0 20 40 60 80 100 120 140 160 180 0.0 0.2 0.4 0.6 0.8 1.0 1.2 1.4 1.6 1.8 2.0 2.2 2.4 F7_c H9_a H3_a H3_d H10_a H14_a H3_b H3_h H9_b H3_e H20_b F7_a H14_b F12_b F1_d F2_a H3_c F4_a F1_b F4_b F12_a H8_b H20_c F2_b F7_b H15_c H16_a F1_e H3_g H5_a H17_a H17_d H11_d F19_a H11_b H15_a H17_b H15_b H17_c F11_c H8_a H11_c H6_a F11_a H6_b H11_a F11_d H19_b H19_a H20_d F11_b Floorarea(m2)perperson Actualvapourpressure(kPa) February Living Room Vapour Pressure Range (MVHR and Non-MVHR) Feb Range (MVHR) Feb Range (Non-MVHR) Floor area (m2) per person
  • 44. Characteristics and Performance of MVHR Systems: A Building Performance Evaluation Meta-Study 41 Figure 4.4b. August mean bedroom vapour pressure in MVHR and Non-MVHR homes * Passivhaus dwellings Vapour pressure levels followed the same trends as temperature and RH data generally – non MVHR houses had lower range of VP levels, but some outliers were observed. Whilst the observation of the RH levels did not indicate conditions that would lead to problems of dampness in general, there is a concern that higher temperatures in thermally efficient dwellings may be masking an underlying moisture problem, particularly in relation to proliferation of dust mite populations. To test this, data was plotted against the Critical Equilibrium Humidity (CEH) levels for Dermatophagoides pteronyssinus and Dermatophagoides farina, common dust mite species of the UK and USA13 . PEH refers to Population Equilibrium Humidity, which is the percentage relative humidity at a given temperature at which house dust mite populations neither propagate nor decline14 . 13 Arlian LG (1992) Water balance and humidity requirements of house dust mites. Experimental & Applied Acarology 16(1-2): 15-35. 14 Crowther D, Wilkinson T, Biddulph P, Oreszczyn T, Pretlove S and Ridley I (2006) A simple model for predicting the effect of hygrothermal conditions on populations of house dust mite Dermatophagoides pteronyssinus (Acari: Pyroglyphidae). Experimental & Applied Acarology 39(2): 127-148 * * ** * ** **** ***** 0 20 40 60 80 100 120 140 160 180 0.4 0.6 0.8 1.0 1.2 1.4 1.6 1.8 2.0 2.2 F11_a1 H14_a1 F11_b1 H3_e2 H11_d2 H3_h1 H3_h2 H11_c2 H3_e1 H11_c1 H3_f1 H6_a1 H11_d1 H11_b1 H3_f2 H11_a1 H3_g1 H6_b1 H15_c1 H15_b1 H3_g2 H16_a1 H19_b1 F11_d1 F19_a1 H15_a2 H15_c2 H17_d1 H15_a1 H10_a1 H9_a1 F11_c1 H17_b1 H17_c1 H11_b2 H17_d2 H8_b1 H8_a2 H8_a1 H3_a1 F12_a1 F7_a1 F7_b1 F7_c1 F12_b1 H20_b1 H20_d1 F4_b1 F1_b1 F1_d1 H20_c1 Floorarea(m2)perperson ActualVapourPressure(kPa) August Mean Bedroom Vapour Pressure (MVHR and Non-MVHR) August Mean (MVHR) August Mean (Non- MVHR) Floor area (m2) per person
  • 45. Characteristics and Performance of MVHR Systems: A Building Performance Evaluation Meta-Study 42 Figure 4.4c. February master bedroom mean temperature and relative humidity levels Figure 4.4d. April master bedroom mean temperature and relative humidity levels F7_a F7_c H20_c H20_d H6_b 20 30 40 50 60 70 80 15 17 19 21 23 25 27 29 31 RelativeHumidity(%) Temperature (°C) February Mean Master Bedroom Temperature & RH Conditions 7g/kg / 1.13kPa CEH min (DF2) CEH min (DP2) PEH MVHR Non-MVHR H20_c H20_d 20 30 40 50 60 70 80 15 17 19 21 23 25 27 29 31 RelativeHumidity(%) Temperature (°C) April Mean Master Bedroom Temperature & RH Conditions 7g/kg / 1.13kPa CEH min (DF2) CEH min (DP2) PEH MVHR Non-MVHR