The Enhanced Oil Recovery (EOR) Market 2013-2023
•
2 gostaram•937 visualizações

For more information on this report please contact ediz.ibrahim@visiongain.com (+44 (0)20 7549 9976) or refer to our website http://www.visiongain.com/Report/1035/The-Enhanced-Oil-Recovery-(EOR)-Market-2013-2023

Recomendados
Recomendados
Mais conteúdo relacionado
Último
Último (20)
Destaque
Destaque (20)
The Enhanced Oil Recovery (EOR) Market 2013-2023
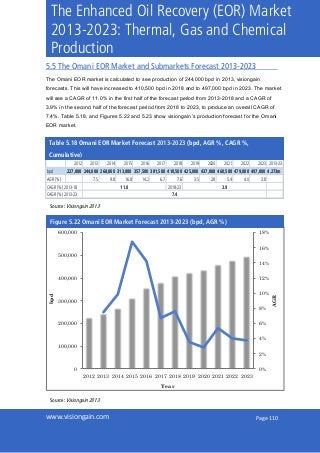
- 1. Page 110www.visiongain.com The Enhanced Oil Recovery (EOR) Market 2013-2023: Thermal, Gas and Chemical Production 5.5 The Omani EOR Market and Submarkets Forecast 2013-2023 The Omani EOR market is calculated to see production of 244,000 bpd in 2013, visiongain forecasts. This will have increased to 410,500 bpd in 2018 and to 497,000 bpd in 2023. The market will see a CAGR of 11.0% in the first half of the forecast period from 2013-2018 and a CAGR of 3.9% in the second half of the forecast period from 2018 to 2023, to produce an overall CAGR of 7.4%. Table 5.18, and Figures 5.22 and 5.23 show visiongain’s production forecast for the Omani EOR market. 2012 2013 2014 2015 2016 2017 2018 2019 2020 2021 2022 2023 2013-23 bpd 227,000 244,000 268,000 313,000 357,500 381,500 410,500 425,000 437,000 460,500 479,000 497,000 4.273m AGR (%) 7.5 9.8 16.8 14.2 6.7 7.6 3.5 2.8 5.4 4.0 3.8 2018-23 3.9 7.4 11.0CAGR (%) 2013-18 CAGR (%) 2013-23 0% 2% 4% 6% 8% 10% 12% 14% 16% 18% 0 100,000 200,000 300,000 400,000 500,000 600,000 2012 2013 2014 2015 2016 2017 2018 2019 2020 2021 2022 2023 AGR bpd Year Source: Visiongain 2013 Table 5.18 Omani EOR Market Forecast 2013-2023 (bpd, AGR %, CAGR %, Cumulative) Source: Visiongain 2013 Figure 5.22 Omani EOR Market Forecast 2013-2023 (bpd, AGR %)
- 2. Page 126www.visiongain.com The Enhanced Oil Recovery (EOR) Market 2013-2023: Thermal, Gas and Chemical Production 2013 2018 2023 Table 5.28, Table 5.29 and Figure 5.33 show visiongain’s production forecast for the Mexican EOR submarkets over the next ten years. Thermal Year 2012 2013 2014 2015 2016 2017 2018 2019 2020 2021 2022 2023 Production (bpd) 100 100 100 150 150 700 700 2,000 2,000 3,000 3,500 3,500 AGR (%) 0.0 0.0 50.0 0.0 366.7 0.0 185.7 0.0 50.0 16.7 0.0 Gas Year 2012 2013 2014 2015 2016 2017 2018 2019 2020 2021 2022 2023 Production (bpd) 40,000 40,000 42,000 42,000 42,500 44,000 42,000 41,500 39,500 37,000 36,000 33,500 AGR (%) 0.0 5.0 0.0 1.2 3.5 -4.5 -1.2 -4.8 -6.3 -2.7 -6.9 Chemical Year 2012 2013 2014 2015 2016 2017 2018 2019 2020 2021 2022 2023 Production (bpd) 50 70 70 85 125 500 1,250 1,850 2,300 3,600 3,800 4,000 AGR (%) 0.0 0.0 21.4 47.1 300.0 150.0 48.0 24.3 56.5 5.6 5.3 2013-2023 2013-2018 2018-2023 Thermal 42.7 47.6 38.0 Gas -1.8 1.0 -4.4 Chemical 49.9 78.0 26.2 1.4 % 1.0 % 0.7 % Source: Visiongain 2013 Figure 5.32 Mexican EOR Market Share Forecast 2013, 2018 and 2023 (% Share) Table 5.29 Mexican EOR Submarkets CAGR (%) Forecast (Thermal, Gas and Chemical) 2013-2013, 2013-2018 and 2018-2023 Source: Visiongain 2013 Source: Visiongain 2013 Table 5.28 Mexican EOR Submarket Forecast (Thermal, Gas and Chemical) 2013-2023 (bpd, AGR %)
- 3. Page 175www.visiongain.com The Enhanced Oil Recovery (EOR) Market 2013-2023: Thermal, Gas and Chemical Production 7. Expert Opinion 7.1 Solvay David Sorin is Vice President of EOR at chemical company Solvay. Together with FP Energies nouvelles and Beicip-Franlab, Solvay is a member of the Chemical EOR Alliance, which delivers integrated chemical EOR solutions. Visiongain spoke to Mr. Sorin in April 2013 and thanks him for his contribution to the report. 7.1.1 Solvay’s Involvement in the EOR Market Visiongain: How is Solvay involved in the EOR market? David Sorin: Solvay’s involvement in the enhanced oil recovery market is primarily through its Novecare Global Business Unit, which specialises in surfactants and specialty polymers. Solvay has pioneered the use of robotics to formulate optimised chemicals for EOR applications: these unique capabilities have led to the development of differentiated surfactant technologies for harsh reservoir conditions, notably carbonate and high temperature / high salinity reservoirs. In 2010, we created the “Chemical EOR Alliance”, a partnership with the French Institute of Petroleum (now IFP Energies nouvelles) and its subsidiary Beicip-Franlab, to promote and deliver integrated chemical EOR projects. This Alliance relies on a team of about 60 dedicated engineers, scientists and technicians to deliver a full suite of services, encompassing laboratory design, reservoir engineering, numerical simulation, on-site support as well as chemicals scale-up and logistics. Visiongain: Which companies have you worked with thus far? David Sorin: Most projects are covered by Non-Disclosure Agreements. However, there have been public mentions of our work at GDF Suez in Germany, Maurel & Prom in Gabon, Pluspetrol in Argentina, PDO in Oman and Petronas in Malaysia. In the past 20 years, the member companies of the Chemical EOR Alliance have conducted over 30 chemical EOR studies and pilots around the world.
- 4. Page 180www.visiongain.com The Enhanced Oil Recovery (EOR) Market 2013-2023: Thermal, Gas and Chemical Production 7.2 Enhance Energy Susan Cole is President and CEO of Enhance Energy, the Canadian company behind the development of the largest carbon capture project for use in enhanced oil operations in the world. The Alberta Carbon Trunk Line (ACTL) project has been uniquely designed to take advantage of the considerable CO₂ emissions from the oil sands and other Albertan industries, using this to boost the production of oil from maturing fields in the south, greatly reducing the carbon footprint of the oil sands industry. Visiongain spoke with Susan Cole in April 2013 and is very grateful for her insightful comments. 7.2.1 Enhance Energy’s Involvement in the EOR Market Visiongain: Can you tell us a little bit about Enhance Energy and your involvement in the EOR market? Susan Cole: Enhance Energy is a company focused on both enhanced oil recovery and CO2 storage. We were formed back in 2006, coming off of my own role as manager of the Weyburn CO2 miscible flood in Saskatchewan. We started Enhance Energy with the mindset that there was a huge opportunity in Alberta for enhanced oil recovery linked to the environmental aspect of storing CO2. 7.2.2 The Rationale Behind the Alberta Carbon Trunk Line Project Visiongain: You are involved with the Alberta Carbon Trunk Line (ACTL) project. What were the main factors behind the decision to go ahead with the project? Susan Cole: We have the experience of the Weyburn project in our past and are ready for the opportunity to take what we have done in Saskatchewan to Alberta, and the opportunity there is actually far greater in terms of the potential for enhanced oil recovery. The only reason we haven’t seen more EOR in Alberta is because there is a lack of CO2. So when we started the ACTL project, really our impetus came from our background of doing enhanced oil recovery. We saw the potential of taking CO2 from where it is being produced in Alberta and moving it to where we can actually use it. So when we first started the project it wasn’t necessarily about reducing emissions, but more about using CO2, which can be seen as a waste product, and giving it a value. ACTL is one of two projects being supported by the Alberta government and by the Canadian government to build large carbon capture and storage projects. The ACTL will have the capacity to transport and store close to 15 megatonnes of CO2 per year.
- 5. Page 192www.visiongain.com The Enhanced Oil Recovery (EOR) Market 2013-2023: Thermal, Gas and Chemical Production Thermal, 93.1% Gas, 6.9% Source: Visiongain 2013 Source: Visiongain 2013 Figure 8.4 Location, Type and Production (bpd) of Chevron Corporation’s EOR Operations Figure 8.5 Chevron Corporation’s EOR Production Split (%) Thermal and Gas