SlideShare uma empresa Scribd logo
1 de 3
Baixar para ler offline
SECTORS
Economic & Political Weekly EPW september 26, 2009 vol xliv no 39 99
Table1:SeatsWonbytheUPAin2009and
Changefrom2004
Total SeatsWonby Change
UPA–2009 since2004
Villages 342 147 +15
Towns/Cities 144 81 +19
Big Cities 57 34 +7
Average 543 262 +41
Source: CSDS Data Unit.
Urban Patterns of Voting and
Party Choices
Vanita Leah Falcao
A perusal of urban voting trends
in the NES 2009 survey hints at
the weakening of the urban voter
base of the Bharatiya Janata
Party. Many among the urban
poor prefer the Congress-led
United Progressive Alliance, while
the BJP has lost support even
among the urban middle classes.
T
wo points are often made with re-
gard to the urban experience of
elections in India: one, that urban
voters are less enthusiastic about voting
and also about politics generally; and two,
that they vote more for the Bharatiya Ja-
nata Party (BJP) giving the BJP an identity
of being a party of urban interests. As one
glances through newspaper reports dur-
ing the 15th Lok Sabha election or the ar-
chives of the electronic media, one theme
that keeps recurring is the spectre of ur-
ban apathy. A large number of advertise-
ments were inserted and public campaigns
undertaken by the civil society actors to
push the urban voter to the polling booth.
As India’s urban population grows, the
concern always is about non-voting by the
urban voter. The latest election to the Lok
Sabha also provided us with a more com-
plex urban situation than one would have
expected. The election took place at a time
when India was experiencing the effects
of the economic slowdown. In urban India
job cuts were widespread. Terrorism and
a sense of insecurity were apparently
heightened against the backdrop of a
series of very high profile terrorist strikes.
How did this affect the urban voter? And
how different was the urban voter from
her/his rural counterpart? Was the BJP’s
defeat partly due to the apathy of urban
voters? How does one make sense of the
fact that many large urban centres wit-
nessed the victory of the Congress and its
allies? Again, did this mean that the BJP
lost due to the apathy of the urban middle
class? Or, has there been some indication
of shift in the urban vote?
Throughout the five phases of the gen-
eral election, concerns were raised re-
garding the “urban voter apathy”. These
concerns, however, seem unfounded if
one were to look at the turnout figures,
which show that the difference between
the voter turnout in the villages and the
urban areas is not that significant. How-
ever, if one looks beyond the simple dual
categorisation of localities into urban-ru-
ral and further categorises the urban ar-
eas into semi-urban areas and largely ur-
ban,1 we find stark differences. It is true
that the metros witnessed far less turn-
out than the turnout among semi-urban
areas. The difference was almost 10%.
Interestingly, the semi-urban areas re-
corded a turnout even greater than the
turnout in rural areas. Thus, a non-dif-
ferentiated argument about urban apathy
is not upheld by the data. Urban centres
manifest both low turnouts (in metros)
and high turnout (in small towns and
cities). But does the urban voter vote
distinctly from the rural voter?
Again, aggregate data supports this
argument. In the parliamentary constitu-
encies (PCs) in the big cities2 Congress
won 23 seats and 11 seats were secured by
its allies. Thus, the Congress-led United
Progressive Alliance (UPA) won 60% of
the seats in this category, with the Con-
gress alone winning 40% (Table 1). As
noted above, the UPA also swept all the
seats in four metros i e, Delhi (7 seats),
Mumbai (6 seats), Kolkata (4 seats) and
Chennai (3 seats). In the towns/cities the
Congress captured 67 seats while its allies
won 14 seats taking the success rate to
56% for the UPA and 47% for the Congress.
Thus, in the urban constituencies, the
Table2:Party-WiseVoteSharein2009andChangesince2004(in %)
Congress Change Congress Change BJP Change BJPAllies Change
since2004 since2004 since2004 since2004
Rural 26.9 3 7.1 -3.2 17.7 -3.8 5.9 -6.8
Towns/cities 31.7 0.8 7.5 0 19.1 -2.1 4.9 -11.4
Big Cities 29.8 0.8 12.2 2.9 24.8 -3.4 3.1 -9.7
Total 28.6 2.2 7.8 -1.6 18.8 -3.4 5.3 -8.4
Source: ECI Data.
Vanita Leah Falcao (vanita.lokniti@gmail.
com) is with Lokniti, Centre for the Study of
Developing Societies, Delhi.
SECTORS
september 26, 2009 vol xliv no 39 EPW Economic & Political Weekly100
success ratio of the Congress and its allies
was much better than in rural areas. In
terms of vote share, Table 2 (p 99) shows
that while the UPA did not gain much in
urban areas over its vote share in 2004,
the NDA lost heavily – with the BJP allies
losing much more in cities than in rural
areas. The rise in the urban vote share of
the Congress, however, is much lower
than the average rise in its vote share
nationally. Also, the rise in vote share of
Congress is much more in rural areas –
thus, while in comparison to 2004, Con-
gress gained in cities, it did not gain much
in real terms if we look at its overall per-
formance this time.
State Level Outcomes
Within respective states (refer to Table 3)
the Congress lost a considerable percent-
age of its vote share across urban
constituencies of Andhra Pradesh (AP),
Maharashtra and West Bengal (WB) as
compared to the last general election.
Semi-urban areas of Orissa also wit-
nessed a similar decline in support for
the Congress. The nationwide urban pat-
terns of declining support for the BJP
were also reflected at the state level. In
semi-urban PCs a rise in BJP vote share
was recorded only in Karnataka, Orissa
and West Bengal. In the largely urban
PCs too, the decline is seen except
in some states such as Jharkhand and
Karnataka.3
While exploring the outcome with re-
gard to specific state parties, changes
from the previous round of general elec-
tions in terms of urban support bases or
seats won warrant a mention (refer to
Table 4). In the semi-urban PCs of some
states of north and central India a signi-
ficant loss of vote share or seats secured
were seen. The Indian National Lok Dal
of Haryana which lost a total of 15.67% of
its vote share in 5 PCs as compared to
2004 is a case in point. In Uttar Pradesh
the Samajwadi Party (SP) registered a
drop in vote share of 3.23% which caused
a loss of 4 seats, and the Shiromani Akali
Dal in Punjab saw its vote share reduced
by 1.06% and a loss of two seats in com-
parison to the previous term.
In semi-urban constituencies of WB
major losses for the Left Front (LF) were
Table3:SeatShareandVoteShareofCongressandBJPinUrbanandSemi-UrbanConstituencies:SelectStates
Semi-Urban LargelyUrban
INC BJP INC BJP
Total Seats Since Vote% Since Seats Since Vote% Since Total Seats Since Vote% Since Seats Since Vote% Change
States Seats Won 2004 2004 Won 2004 2004 Seats Won 2004 2004 Won 2004 Since2004
AP 14 14 1 39.87 -10.63 0 0 3.30 -7.27 4 3 0 31.24 -14.57 0 0 10.66 -6.54
Assam 2 1 0 35.23 -3.10 1 0 15.80 -5.66 1 0 -1 43.67 3.61 1 1 44.74 11.61
Bihar 0 - - - - - - - - 1 0 0 11.10 11.10 1 1 57.30 13.46
Chhattisgarh 4 1 1 38.66 1.28 3 -1 40.78 -9.06 - - - - - - - -
Delhi 0 - - - - - - - - 7 7 1 57.11 2.30 0 -1 35.23 -5.44
Gujarat 9 5 0 44.24 1.58 4 0 45.34 -1.43 5 0 0 40.15 -0.80 5 0 54.63 -0.05
Haryana 5 5 5 46.97 4.99 0 -1 22.34 -1.02 0 - - - - - - - -
Jharkhand 0 - - - - - - - - 3 0 -1 17.99 2.94 3 3 33.61 4.50
Karnataka 13 3 -1 39.53 2.68 9 0 45.06 4.94 3 0 0 39.84 2.56 3 0 44.65 1.37
Kerala 8 8 8 47.98 15.01 0 0 5.73 -4.15 1 1 1 46.03 7.64 0 0 7.11 -2.10
MP 5 2 1 42.15 3.57 3 -1 48.24 -3.42 2 0 0 44.49 11.23 2 0 49.76 -12.69
Maharashtra 15 4 -1 18.22 -5.56 4 -1 16.86 -2.52 11 10 +2 38.71 -10.24 0 0 17.61 -2.50
Orissa 3 1 1 28.76 -10.57 0 -1 19.16 5.17 0 - - - - - - - -
Punjab 8 5 3 45.48 5.48 1 -1 11.49 -0.67 1 1 1 53.08 18.63 0 0 0 0
Rajasthan 6 4 4 49.67 7.12 2 -4 41.37 -8.47 1 1 1 48.89 6.49 0 -1 46.91 -7.65
Tamil Nadu 22 6 -2 20.94 0 0 0 2.68 -0.46 6 0 0 5.77 5.77 0 0 2.36 -11.25
Uttar Pradesh 17 4 0 18.14 3.79 4 1 20.93 -3.12 3 1 0 27.03 14.77 2 1 34.62 -4.29
Uttrakhand 3 3 2 43.14 6.99 0 -1 30.49 -6.27 0 - - - - - - - -
West Bengal 8 0 -1 7.54 -4.11 1 1 9.26 4.88 6 0 0 0 -1.97 0 0 4.47 -5.91
Source: CSDS Data Unit.
Table4:SeatShareandVoteShareofSpecificPartiesWithinStates–SelectStates
Semi-Urban LargelyUrban
State Party/Alliance Total Seats Change Vote% Change Total Seats Change Vote% Change
Seats Won Since2004 Since2004 Seats Won Since2004 Since2004
AP TDP/TRS/Left 14 0 -1 33.49 0.03 4 0 0 22.23 1.26
Praja Rajyam 0 0 16.04 16.04 0 0 17.22 17.22
Assam AGP 2 0 0 14.50 -9.12 1 0 0 0 -20.51
Bihar JD(U) 0 - - - - 1 0 0 0 0
RJD - - - - 0 -1 27.11 -21.01
Haryana INLD 5 0 0 3.62 -15.67 0 - - - -
Jharkhand JMM 0 - - - - 3 0 0 6.53 0
JVM - - - - 0 0 9.13 0
Karnataka JDS 13 1 1 9.52 -7.56 3 0 0 11.01 -5.50
Kerala LDF 8 0 -7 42.28 -3.92 1 0 -1 44.44 -4.58
Maharashtra Shiv Sena 15 4 -1 18.00 -6.94 11 1 -2 13.74 -9.33
Orissa BJD 3 2 0 37.91 -0.94 0 - - - -
Punjab SAD 8 2 -2 32.24 -1.06 1 0 -1 39.65 1.80
Tamil Nadu AIADMK 22 7 7 27.27 -5.14 6 1 1 12.72 -9.86
DMK 7 0 20.10 1.03 4 0 36.90 -3.91
Uttar Pradesh BSP 17 5 2 27.71 2.70 3 0 0 21.56 7.66
SP 3 -4 19.07 -3.23 0 -1 13.63 -14.02
West Bengal TC 8 6 6 38.66 7.03 6 5 4 49.27 21.98
Left Front 1 -5 40.58 -5.06 1 -4 42.68 -7.13
Source: CSDS Data Unit.
SECTORS
Economic & Political Weekly EPW september 26, 2009 vol xliv no 39 101
witnessed. The Trinamool Congress (TC)
on the other hand increased its vote share
by over 7% and its seats by six. With re-
gard to southern India, electoral outcomes
saw a drop in vote share for almost all
major state parties and alliances in semi-
urban constituencies such as the Janata
Dal (Secular) – JDS in Karnataka, the Left
Democratic Front in Kerela and the All
India Anna Dravida Munnetra Kazhagam
(AIADMK) in Tamil Nadu. However, for
the AIADMK and the JDS this reduction in
vote share was not reflected in the seats
it won.
The urban PCs in West Bengal largely
followed the same trend as that of the
semi-urban PCs, i e, losses for the LF and
gains for the TC in both vote share and
seats. The Shiv Sena in Maharashtra suf-
fered a setback in its support amongst the
urban voters losing 9.33% in its vote share
in largely urban PCs and 6.94% in semi-
urban PCs. The newly established party
Praja Rajyam headed by Chiranjeevi in AP
managed to pocket
16.04% in semi-urban
areas and 17.22% in
largely urban areas. It,
however, failed to se-
cure any seats for itself.
Satisfaction with
the UPA
While the foregoing
discussion is based pri-
marily on official data
on turnout, survey data
helps us understand
the dynamics of elec-
toral competition in ur-
ban4 areas. In fact, the
voter in large cities was
much less satisfied with
the UPA government
than the rural voter:
only 42% voters in the
big cities were satisfied
with the UPA govern-
ment as against 64 in rural areas. And yet,
they voted in large numbers for the UPA.
This suggests that the voter in big cities
did not think that National Democratic
Alliance was a reliable alternative. Sec-
ondly, satisfaction level of the voters in
towns and small cities was not different
from the rural voters – in fact slightly
higher (65%). These details caution us
against following the intuitive common
sense that urban voters are anti-Congress
and that they vote for alternatives.
Besides, we need also to see if knowledge
of certain issues made any difference to
the choice of the voters. Tables 5 and 6
show the choice of party by voters
who had heard of different issues that
would typically appeal to the urban
voter and who said their vote choice was
affected by the awareness of these
issues. It seems that this aspect too, does
not make much difference. Having heard
of these issues, voters still chose to vote
for the Congress and its allies. Does this
mean that despite the issues being im-
portant, the voters did not have the confi-
dence that the BJP was the right choice
for handling these issues?
This note must finally draw attention
to an even more striking feature of urban
vote. It is not only that the urban voter
voted more for the Congress and its
allies. Among urban poor, Congress and
its allies had a huge advantage as seen
from Table 7. What would perhaps sur-
prise one the most is the BJP’s deficit
among the urban middle class. If this
trend continues, it will probably force a
rewriting of the political sociology of
contemporary India: a party that
began as a typically urban party goes on
to lose support amongst precisely that
section; and a party that is often
suspected of being a middle class party
now trails behind the Congress with
regard to support from that class, cer-
tainly requires much more examination
than is possible within the scope of this
note. But one thing is certain: a develop-
ment of this nature should certainly serve
as a wakeup call for the BJP, which will
have to get their act together in the years
to come.
Notes
1 Parliamentary constituencies (PCs) were catego-
rised based on the proportion of urban population
as given by the Election Commission of India. PCs
with over 75% urban population were labelled
Largely Urban. Those which had an urban popu-
lation between 25 and 75% were labelled Semi-
Urban and those which had less than 25% urban
population were categorised as Rural.
2 The classification of PCs into Big Cities, City/
Town and Villages is as per the Census of India
2001 classification.
3 While analysing changes in vote share there is a
need to pay close attention to the number of PCs.
Often a decline or increase in vote share may ap-
pear to be of greater significance than it actually
is, owing to the low number of largely urban con-
stituencies.
4 Urban refers to both the semi-urban and the
largely urban samples.
Table5:VotebyIssueAwareness:UrbanVoters
Congress Congress BJP BJP Others
Allies Allies
Indo-US nuclear deal 21 9 16 4 49
Ram Setu controversy 21 9 18 3 48
Prices of everyday goods 23 9 15 4 49
Terrorist attacks 23 9 16 4 49
Reservations for OBCs 23 9 15 4 50
Livelihood/employment opportunities 23 9 15 4 49
The total number of urban respondents (n) in the NES 2009 on which the data in tables 5, 6
and 7 is based is 10,373.
Source: NES 2009.
Q: Now I will ask you about some of the issues in the elections. Please tell me if you have
heard about them.
Table6:VoteChoiceamongThoseAffectedbyIssue-Awareness
Congress Congress BJP BJP Others
Allies Allies
Indo-US nuclear deal 22 9 17 3 49
Ram Setu controversy 21 8 20 3 48
Prices of everyday goods 23 8 15 4 50
Terrorist attacks 22 8 17 4 49
Reservations for OBCs 23 8 14 3 52
Livelihood/employment opportunities 22 8 15 4 50
Source: NES 2009
Q: Now I will ask you about some of the issues in the elections. Please tell me if you have
heard about them. (If yes) For each of them, please tell me how it affected your decision of
whom to vote for – not very much, a lot or almost entirely.
Table7:VotebyClass(urban voters)
Congress Congress BJP BJP Others
Allies Allies
Rich 23 8 20 3 45
Middle Class 23 8 16 3 50
Lower Class 22 9 11 5 52
Poor 24 15 7 5 49
Very Poor 18 18 12 5 47
Source: NES 2009.
For the Attention of Subscribers and
Subscription Agencies Outside India
It has come to our notice that a large number of subscriptions to the EPW from outside the country together
with the subscription payments sent to supposed subscription agents in India have not been forwarded to us.
We wish to point out to subscribers and subscription agencies outside India that all foreign subscriptions,together
with the appropriate remittances, must be forwarded to us and not to unauthorised third parties in India.
We take no responsibility whatsoever in respect of subscriptions not registered with us.
MANAGER

Mais conteúdo relacionado

Destaque

INTEGRATED FINANCIAL MANAGEMENT INFORMATION SYSTEM AND FINANCIAL REPORTING EF...
INTEGRATED FINANCIAL MANAGEMENT INFORMATION SYSTEM AND FINANCIAL REPORTING EF...INTEGRATED FINANCIAL MANAGEMENT INFORMATION SYSTEM AND FINANCIAL REPORTING EF...
INTEGRATED FINANCIAL MANAGEMENT INFORMATION SYSTEM AND FINANCIAL REPORTING EF...Kyambogo University, Kampala-Uganda
 
Клуб бухгалтеров НКО: Обзорный вебинар П.Ю. Гамольского 25.02.2015
Клуб бухгалтеров НКО: Обзорный вебинар П.Ю. Гамольского 25.02.2015Клуб бухгалтеров НКО: Обзорный вебинар П.Ю. Гамольского 25.02.2015
Клуб бухгалтеров НКО: Обзорный вебинар П.Ю. Гамольского 25.02.2015Pavel Gamolskiy
 
XDC Indonesia Company Profile 2014
XDC Indonesia Company Profile 2014XDC Indonesia Company Profile 2014
XDC Indonesia Company Profile 2014Stefanny Octavia
 
The Importance of Staying Active after a Cancer Diagnosis | Dr Anna Campbell
The Importance of Staying Active after a Cancer Diagnosis | Dr Anna CampbellThe Importance of Staying Active after a Cancer Diagnosis | Dr Anna Campbell
The Importance of Staying Active after a Cancer Diagnosis | Dr Anna CampbellScottish Cancer Prevention Network
 
Maternity-Entitlement-Report_CES_29.05
Maternity-Entitlement-Report_CES_29.05Maternity-Entitlement-Report_CES_29.05
Maternity-Entitlement-Report_CES_29.05Vanita Leah Falcao
 
The Promotion of Physical Activity - Everyone's Responsibility | Susan Moag
The Promotion of Physical Activity - Everyone's Responsibility | Susan MoagThe Promotion of Physical Activity - Everyone's Responsibility | Susan Moag
The Promotion of Physical Activity - Everyone's Responsibility | Susan MoagScottish Cancer Prevention Network
 
Visa modeller och mönster (samtala)
Visa modeller och mönster (samtala)Visa modeller och mönster (samtala)
Visa modeller och mönster (samtala)skrivlyft
 
NEW SIZE EDDM BACK11914
NEW SIZE EDDM BACK11914NEW SIZE EDDM BACK11914
NEW SIZE EDDM BACK11914Jay S. Draper
 
Promoting Health and Wellbeing - Vision, Practice and Reality | Dr Neil Hamlet
Promoting Health and Wellbeing - Vision, Practice and Reality | Dr Neil HamletPromoting Health and Wellbeing - Vision, Practice and Reality | Dr Neil Hamlet
Promoting Health and Wellbeing - Vision, Practice and Reality | Dr Neil HamletScottish Cancer Prevention Network
 
Promoting Health and Well-being for Cancer Prevention | Sylvia Mudie
Promoting Health and Well-being for Cancer Prevention | Sylvia MudiePromoting Health and Well-being for Cancer Prevention | Sylvia Mudie
Promoting Health and Well-being for Cancer Prevention | Sylvia MudieScottish Cancer Prevention Network
 
Ralph Nebbioso - Enterprise Risk Management Specialist
Ralph Nebbioso - Enterprise Risk Management SpecialistRalph Nebbioso - Enterprise Risk Management Specialist
Ralph Nebbioso - Enterprise Risk Management SpecialistRalph Nebbioso
 
INTEGRATED FINANCIAL MANAGEMENT INFORMATION SYSTEM AND FINANCIAL REPORTING EF...
INTEGRATED FINANCIAL MANAGEMENT INFORMATION SYSTEM AND FINANCIAL REPORTING EF...INTEGRATED FINANCIAL MANAGEMENT INFORMATION SYSTEM AND FINANCIAL REPORTING EF...
INTEGRATED FINANCIAL MANAGEMENT INFORMATION SYSTEM AND FINANCIAL REPORTING EF...Kyambogo University, Kampala-Uganda
 
Клуб бухгалтеров НКО: юрист Толмасова Ответственность 10.02.2015
Клуб бухгалтеров НКО: юрист Толмасова Ответственность 10.02.2015Клуб бухгалтеров НКО: юрист Толмасова Ответственность 10.02.2015
Клуб бухгалтеров НКО: юрист Толмасова Ответственность 10.02.2015Pavel Gamolskiy
 
Värdet av strukturerade och meningsfulla sammanhang
Värdet av strukturerade och meningsfulla sammanhangVärdet av strukturerade och meningsfulla sammanhang
Värdet av strukturerade och meningsfulla sammanhangskrivlyft
 
Can ho-the-krista-capitaland
Can ho-the-krista-capitalandCan ho-the-krista-capitaland
Can ho-the-krista-capitalandBình An Pearl
 

Destaque (19)

INTEGRATED FINANCIAL MANAGEMENT INFORMATION SYSTEM AND FINANCIAL REPORTING EF...
INTEGRATED FINANCIAL MANAGEMENT INFORMATION SYSTEM AND FINANCIAL REPORTING EF...INTEGRATED FINANCIAL MANAGEMENT INFORMATION SYSTEM AND FINANCIAL REPORTING EF...
INTEGRATED FINANCIAL MANAGEMENT INFORMATION SYSTEM AND FINANCIAL REPORTING EF...
 
Клуб бухгалтеров НКО: Обзорный вебинар П.Ю. Гамольского 25.02.2015
Клуб бухгалтеров НКО: Обзорный вебинар П.Ю. Гамольского 25.02.2015Клуб бухгалтеров НКО: Обзорный вебинар П.Ю. Гамольского 25.02.2015
Клуб бухгалтеров НКО: Обзорный вебинар П.Ю. Гамольского 25.02.2015
 
Kkf manual arabic
Kkf manual arabicKkf manual arabic
Kkf manual arabic
 
XDC Indonesia Company Profile 2014
XDC Indonesia Company Profile 2014XDC Indonesia Company Profile 2014
XDC Indonesia Company Profile 2014
 
The Importance of Staying Active after a Cancer Diagnosis | Dr Anna Campbell
The Importance of Staying Active after a Cancer Diagnosis | Dr Anna CampbellThe Importance of Staying Active after a Cancer Diagnosis | Dr Anna Campbell
The Importance of Staying Active after a Cancer Diagnosis | Dr Anna Campbell
 
Maternity-Entitlement-Report_CES_29.05
Maternity-Entitlement-Report_CES_29.05Maternity-Entitlement-Report_CES_29.05
Maternity-Entitlement-Report_CES_29.05
 
The Promotion of Physical Activity - Everyone's Responsibility | Susan Moag
The Promotion of Physical Activity - Everyone's Responsibility | Susan MoagThe Promotion of Physical Activity - Everyone's Responsibility | Susan Moag
The Promotion of Physical Activity - Everyone's Responsibility | Susan Moag
 
Visa modeller och mönster (samtala)
Visa modeller och mönster (samtala)Visa modeller och mönster (samtala)
Visa modeller och mönster (samtala)
 
NEW SIZE EDDM BACK11914
NEW SIZE EDDM BACK11914NEW SIZE EDDM BACK11914
NEW SIZE EDDM BACK11914
 
Promoting Health and Wellbeing - Vision, Practice and Reality | Dr Neil Hamlet
Promoting Health and Wellbeing - Vision, Practice and Reality | Dr Neil HamletPromoting Health and Wellbeing - Vision, Practice and Reality | Dr Neil Hamlet
Promoting Health and Wellbeing - Vision, Practice and Reality | Dr Neil Hamlet
 
D-MINE MT
D-MINE MTD-MINE MT
D-MINE MT
 
Promoting Health and Well-being for Cancer Prevention | Sylvia Mudie
Promoting Health and Well-being for Cancer Prevention | Sylvia MudiePromoting Health and Well-being for Cancer Prevention | Sylvia Mudie
Promoting Health and Well-being for Cancer Prevention | Sylvia Mudie
 
Ralph Nebbioso - Enterprise Risk Management Specialist
Ralph Nebbioso - Enterprise Risk Management SpecialistRalph Nebbioso - Enterprise Risk Management Specialist
Ralph Nebbioso - Enterprise Risk Management Specialist
 
INTEGRATED FINANCIAL MANAGEMENT INFORMATION SYSTEM AND FINANCIAL REPORTING EF...
INTEGRATED FINANCIAL MANAGEMENT INFORMATION SYSTEM AND FINANCIAL REPORTING EF...INTEGRATED FINANCIAL MANAGEMENT INFORMATION SYSTEM AND FINANCIAL REPORTING EF...
INTEGRATED FINANCIAL MANAGEMENT INFORMATION SYSTEM AND FINANCIAL REPORTING EF...
 
Клуб бухгалтеров НКО: юрист Толмасова Ответственность 10.02.2015
Клуб бухгалтеров НКО: юрист Толмасова Ответственность 10.02.2015Клуб бухгалтеров НКО: юрист Толмасова Ответственность 10.02.2015
Клуб бухгалтеров НКО: юрист Толмасова Ответственность 10.02.2015
 
Värdet av strukturerade och meningsfulla sammanhang
Värdet av strukturerade och meningsfulla sammanhangVärdet av strukturerade och meningsfulla sammanhang
Värdet av strukturerade och meningsfulla sammanhang
 
Everyday Actions | Prof Nanette Mutrie MBE
Everyday Actions | Prof Nanette Mutrie MBEEveryday Actions | Prof Nanette Mutrie MBE
Everyday Actions | Prof Nanette Mutrie MBE
 
Weight Management...Broaching the Topic
Weight Management...Broaching the TopicWeight Management...Broaching the Topic
Weight Management...Broaching the Topic
 
Can ho-the-krista-capitaland
Can ho-the-krista-capitalandCan ho-the-krista-capitaland
Can ho-the-krista-capitaland
 

Semelhante a Writing Sample2_Urban Patterns of Voting

Uttar_Pradesh_Assembly_Elections_2022_Analysis_of_Vote_Share_and_Margin_of_Vi...
Uttar_Pradesh_Assembly_Elections_2022_Analysis_of_Vote_Share_and_Margin_of_Vi...Uttar_Pradesh_Assembly_Elections_2022_Analysis_of_Vote_Share_and_Margin_of_Vi...
Uttar_Pradesh_Assembly_Elections_2022_Analysis_of_Vote_Share_and_Margin_of_Vi...sabrangsabrang
 
PPT- Yearly Plan- MLZS.pptx
PPT- Yearly Plan- MLZS.pptxPPT- Yearly Plan- MLZS.pptx
PPT- Yearly Plan- MLZS.pptxssuser7b5372
 
Powerful Legislative Reforms - To Give Cities their Rightful Share of Lok Sab...
Powerful Legislative Reforms - To Give Cities their Rightful Share of Lok Sab...Powerful Legislative Reforms - To Give Cities their Rightful Share of Lok Sab...
Powerful Legislative Reforms - To Give Cities their Rightful Share of Lok Sab...arish rajan
 
Astha sharmapgcmrda229 project_report
Astha sharmapgcmrda229 project_reportAstha sharmapgcmrda229 project_report
Astha sharmapgcmrda229 project_reportAstha Sharma
 
AndersonFall2012_geog591
AndersonFall2012_geog591AndersonFall2012_geog591
AndersonFall2012_geog591Lauren Anderson
 
The results of sociopolitical monitoring "Zaporizhzhia: 4 months after election"
The results of sociopolitical monitoring "Zaporizhzhia: 4 months after election"The results of sociopolitical monitoring "Zaporizhzhia: 4 months after election"
The results of sociopolitical monitoring "Zaporizhzhia: 4 months after election"MLS group
 

Semelhante a Writing Sample2_Urban Patterns of Voting (7)

Gendeer gap rakesh
Gendeer gap rakeshGendeer gap rakesh
Gendeer gap rakesh
 
Uttar_Pradesh_Assembly_Elections_2022_Analysis_of_Vote_Share_and_Margin_of_Vi...
Uttar_Pradesh_Assembly_Elections_2022_Analysis_of_Vote_Share_and_Margin_of_Vi...Uttar_Pradesh_Assembly_Elections_2022_Analysis_of_Vote_Share_and_Margin_of_Vi...
Uttar_Pradesh_Assembly_Elections_2022_Analysis_of_Vote_Share_and_Margin_of_Vi...
 
PPT- Yearly Plan- MLZS.pptx
PPT- Yearly Plan- MLZS.pptxPPT- Yearly Plan- MLZS.pptx
PPT- Yearly Plan- MLZS.pptx
 
Powerful Legislative Reforms - To Give Cities their Rightful Share of Lok Sab...
Powerful Legislative Reforms - To Give Cities their Rightful Share of Lok Sab...Powerful Legislative Reforms - To Give Cities their Rightful Share of Lok Sab...
Powerful Legislative Reforms - To Give Cities their Rightful Share of Lok Sab...
 
Astha sharmapgcmrda229 project_report
Astha sharmapgcmrda229 project_reportAstha sharmapgcmrda229 project_report
Astha sharmapgcmrda229 project_report
 
AndersonFall2012_geog591
AndersonFall2012_geog591AndersonFall2012_geog591
AndersonFall2012_geog591
 
The results of sociopolitical monitoring "Zaporizhzhia: 4 months after election"
The results of sociopolitical monitoring "Zaporizhzhia: 4 months after election"The results of sociopolitical monitoring "Zaporizhzhia: 4 months after election"
The results of sociopolitical monitoring "Zaporizhzhia: 4 months after election"
 

Writing Sample2_Urban Patterns of Voting

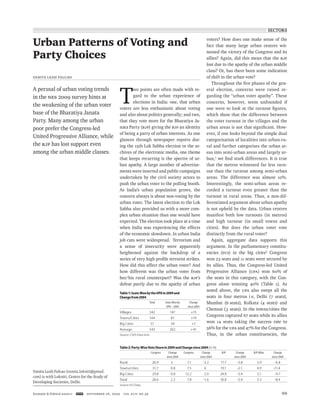
  • 1. SECTORS Economic & Political Weekly EPW september 26, 2009 vol xliv no 39 99 Table1:SeatsWonbytheUPAin2009and Changefrom2004 Total SeatsWonby Change UPA–2009 since2004 Villages 342 147 +15 Towns/Cities 144 81 +19 Big Cities 57 34 +7 Average 543 262 +41 Source: CSDS Data Unit. Urban Patterns of Voting and Party Choices Vanita Leah Falcao A perusal of urban voting trends in the NES 2009 survey hints at the weakening of the urban voter base of the Bharatiya Janata Party. Many among the urban poor prefer the Congress-led United Progressive Alliance, while the BJP has lost support even among the urban middle classes. T wo points are often made with re- gard to the urban experience of elections in India: one, that urban voters are less enthusiastic about voting and also about politics generally; and two, that they vote more for the Bharatiya Ja- nata Party (BJP) giving the BJP an identity of being a party of urban interests. As one glances through newspaper reports dur- ing the 15th Lok Sabha election or the ar- chives of the electronic media, one theme that keeps recurring is the spectre of ur- ban apathy. A large number of advertise- ments were inserted and public campaigns undertaken by the civil society actors to push the urban voter to the polling booth. As India’s urban population grows, the concern always is about non-voting by the urban voter. The latest election to the Lok Sabha also provided us with a more com- plex urban situation than one would have expected. The election took place at a time when India was experiencing the effects of the economic slowdown. In urban India job cuts were widespread. Terrorism and a sense of insecurity were apparently heightened against the backdrop of a series of very high profile terrorist strikes. How did this affect the urban voter? And how different was the urban voter from her/his rural counterpart? Was the BJP’s defeat partly due to the apathy of urban voters? How does one make sense of the fact that many large urban centres wit- nessed the victory of the Congress and its allies? Again, did this mean that the BJP lost due to the apathy of the urban middle class? Or, has there been some indication of shift in the urban vote? Throughout the five phases of the gen- eral election, concerns were raised re- garding the “urban voter apathy”. These concerns, however, seem unfounded if one were to look at the turnout figures, which show that the difference between the voter turnout in the villages and the urban areas is not that significant. How- ever, if one looks beyond the simple dual categorisation of localities into urban-ru- ral and further categorises the urban ar- eas into semi-urban areas and largely ur- ban,1 we find stark differences. It is true that the metros witnessed far less turn- out than the turnout among semi-urban areas. The difference was almost 10%. Interestingly, the semi-urban areas re- corded a turnout even greater than the turnout in rural areas. Thus, a non-dif- ferentiated argument about urban apathy is not upheld by the data. Urban centres manifest both low turnouts (in metros) and high turnout (in small towns and cities). But does the urban voter vote distinctly from the rural voter? Again, aggregate data supports this argument. In the parliamentary constitu- encies (PCs) in the big cities2 Congress won 23 seats and 11 seats were secured by its allies. Thus, the Congress-led United Progressive Alliance (UPA) won 60% of the seats in this category, with the Con- gress alone winning 40% (Table 1). As noted above, the UPA also swept all the seats in four metros i e, Delhi (7 seats), Mumbai (6 seats), Kolkata (4 seats) and Chennai (3 seats). In the towns/cities the Congress captured 67 seats while its allies won 14 seats taking the success rate to 56% for the UPA and 47% for the Congress. Thus, in the urban constituencies, the Table2:Party-WiseVoteSharein2009andChangesince2004(in %) Congress Change Congress Change BJP Change BJPAllies Change since2004 since2004 since2004 since2004 Rural 26.9 3 7.1 -3.2 17.7 -3.8 5.9 -6.8 Towns/cities 31.7 0.8 7.5 0 19.1 -2.1 4.9 -11.4 Big Cities 29.8 0.8 12.2 2.9 24.8 -3.4 3.1 -9.7 Total 28.6 2.2 7.8 -1.6 18.8 -3.4 5.3 -8.4 Source: ECI Data. Vanita Leah Falcao (vanita.lokniti@gmail. com) is with Lokniti, Centre for the Study of Developing Societies, Delhi.
  • 2. SECTORS september 26, 2009 vol xliv no 39 EPW Economic & Political Weekly100 success ratio of the Congress and its allies was much better than in rural areas. In terms of vote share, Table 2 (p 99) shows that while the UPA did not gain much in urban areas over its vote share in 2004, the NDA lost heavily – with the BJP allies losing much more in cities than in rural areas. The rise in the urban vote share of the Congress, however, is much lower than the average rise in its vote share nationally. Also, the rise in vote share of Congress is much more in rural areas – thus, while in comparison to 2004, Con- gress gained in cities, it did not gain much in real terms if we look at its overall per- formance this time. State Level Outcomes Within respective states (refer to Table 3) the Congress lost a considerable percent- age of its vote share across urban constituencies of Andhra Pradesh (AP), Maharashtra and West Bengal (WB) as compared to the last general election. Semi-urban areas of Orissa also wit- nessed a similar decline in support for the Congress. The nationwide urban pat- terns of declining support for the BJP were also reflected at the state level. In semi-urban PCs a rise in BJP vote share was recorded only in Karnataka, Orissa and West Bengal. In the largely urban PCs too, the decline is seen except in some states such as Jharkhand and Karnataka.3 While exploring the outcome with re- gard to specific state parties, changes from the previous round of general elec- tions in terms of urban support bases or seats won warrant a mention (refer to Table 4). In the semi-urban PCs of some states of north and central India a signi- ficant loss of vote share or seats secured were seen. The Indian National Lok Dal of Haryana which lost a total of 15.67% of its vote share in 5 PCs as compared to 2004 is a case in point. In Uttar Pradesh the Samajwadi Party (SP) registered a drop in vote share of 3.23% which caused a loss of 4 seats, and the Shiromani Akali Dal in Punjab saw its vote share reduced by 1.06% and a loss of two seats in com- parison to the previous term. In semi-urban constituencies of WB major losses for the Left Front (LF) were Table3:SeatShareandVoteShareofCongressandBJPinUrbanandSemi-UrbanConstituencies:SelectStates Semi-Urban LargelyUrban INC BJP INC BJP Total Seats Since Vote% Since Seats Since Vote% Since Total Seats Since Vote% Since Seats Since Vote% Change States Seats Won 2004 2004 Won 2004 2004 Seats Won 2004 2004 Won 2004 Since2004 AP 14 14 1 39.87 -10.63 0 0 3.30 -7.27 4 3 0 31.24 -14.57 0 0 10.66 -6.54 Assam 2 1 0 35.23 -3.10 1 0 15.80 -5.66 1 0 -1 43.67 3.61 1 1 44.74 11.61 Bihar 0 - - - - - - - - 1 0 0 11.10 11.10 1 1 57.30 13.46 Chhattisgarh 4 1 1 38.66 1.28 3 -1 40.78 -9.06 - - - - - - - - Delhi 0 - - - - - - - - 7 7 1 57.11 2.30 0 -1 35.23 -5.44 Gujarat 9 5 0 44.24 1.58 4 0 45.34 -1.43 5 0 0 40.15 -0.80 5 0 54.63 -0.05 Haryana 5 5 5 46.97 4.99 0 -1 22.34 -1.02 0 - - - - - - - - Jharkhand 0 - - - - - - - - 3 0 -1 17.99 2.94 3 3 33.61 4.50 Karnataka 13 3 -1 39.53 2.68 9 0 45.06 4.94 3 0 0 39.84 2.56 3 0 44.65 1.37 Kerala 8 8 8 47.98 15.01 0 0 5.73 -4.15 1 1 1 46.03 7.64 0 0 7.11 -2.10 MP 5 2 1 42.15 3.57 3 -1 48.24 -3.42 2 0 0 44.49 11.23 2 0 49.76 -12.69 Maharashtra 15 4 -1 18.22 -5.56 4 -1 16.86 -2.52 11 10 +2 38.71 -10.24 0 0 17.61 -2.50 Orissa 3 1 1 28.76 -10.57 0 -1 19.16 5.17 0 - - - - - - - - Punjab 8 5 3 45.48 5.48 1 -1 11.49 -0.67 1 1 1 53.08 18.63 0 0 0 0 Rajasthan 6 4 4 49.67 7.12 2 -4 41.37 -8.47 1 1 1 48.89 6.49 0 -1 46.91 -7.65 Tamil Nadu 22 6 -2 20.94 0 0 0 2.68 -0.46 6 0 0 5.77 5.77 0 0 2.36 -11.25 Uttar Pradesh 17 4 0 18.14 3.79 4 1 20.93 -3.12 3 1 0 27.03 14.77 2 1 34.62 -4.29 Uttrakhand 3 3 2 43.14 6.99 0 -1 30.49 -6.27 0 - - - - - - - - West Bengal 8 0 -1 7.54 -4.11 1 1 9.26 4.88 6 0 0 0 -1.97 0 0 4.47 -5.91 Source: CSDS Data Unit. Table4:SeatShareandVoteShareofSpecificPartiesWithinStates–SelectStates Semi-Urban LargelyUrban State Party/Alliance Total Seats Change Vote% Change Total Seats Change Vote% Change Seats Won Since2004 Since2004 Seats Won Since2004 Since2004 AP TDP/TRS/Left 14 0 -1 33.49 0.03 4 0 0 22.23 1.26 Praja Rajyam 0 0 16.04 16.04 0 0 17.22 17.22 Assam AGP 2 0 0 14.50 -9.12 1 0 0 0 -20.51 Bihar JD(U) 0 - - - - 1 0 0 0 0 RJD - - - - 0 -1 27.11 -21.01 Haryana INLD 5 0 0 3.62 -15.67 0 - - - - Jharkhand JMM 0 - - - - 3 0 0 6.53 0 JVM - - - - 0 0 9.13 0 Karnataka JDS 13 1 1 9.52 -7.56 3 0 0 11.01 -5.50 Kerala LDF 8 0 -7 42.28 -3.92 1 0 -1 44.44 -4.58 Maharashtra Shiv Sena 15 4 -1 18.00 -6.94 11 1 -2 13.74 -9.33 Orissa BJD 3 2 0 37.91 -0.94 0 - - - - Punjab SAD 8 2 -2 32.24 -1.06 1 0 -1 39.65 1.80 Tamil Nadu AIADMK 22 7 7 27.27 -5.14 6 1 1 12.72 -9.86 DMK 7 0 20.10 1.03 4 0 36.90 -3.91 Uttar Pradesh BSP 17 5 2 27.71 2.70 3 0 0 21.56 7.66 SP 3 -4 19.07 -3.23 0 -1 13.63 -14.02 West Bengal TC 8 6 6 38.66 7.03 6 5 4 49.27 21.98 Left Front 1 -5 40.58 -5.06 1 -4 42.68 -7.13 Source: CSDS Data Unit.
  • 3. SECTORS Economic & Political Weekly EPW september 26, 2009 vol xliv no 39 101 witnessed. The Trinamool Congress (TC) on the other hand increased its vote share by over 7% and its seats by six. With re- gard to southern India, electoral outcomes saw a drop in vote share for almost all major state parties and alliances in semi- urban constituencies such as the Janata Dal (Secular) – JDS in Karnataka, the Left Democratic Front in Kerela and the All India Anna Dravida Munnetra Kazhagam (AIADMK) in Tamil Nadu. However, for the AIADMK and the JDS this reduction in vote share was not reflected in the seats it won. The urban PCs in West Bengal largely followed the same trend as that of the semi-urban PCs, i e, losses for the LF and gains for the TC in both vote share and seats. The Shiv Sena in Maharashtra suf- fered a setback in its support amongst the urban voters losing 9.33% in its vote share in largely urban PCs and 6.94% in semi- urban PCs. The newly established party Praja Rajyam headed by Chiranjeevi in AP managed to pocket 16.04% in semi-urban areas and 17.22% in largely urban areas. It, however, failed to se- cure any seats for itself. Satisfaction with the UPA While the foregoing discussion is based pri- marily on official data on turnout, survey data helps us understand the dynamics of elec- toral competition in ur- ban4 areas. In fact, the voter in large cities was much less satisfied with the UPA government than the rural voter: only 42% voters in the big cities were satisfied with the UPA govern- ment as against 64 in rural areas. And yet, they voted in large numbers for the UPA. This suggests that the voter in big cities did not think that National Democratic Alliance was a reliable alternative. Sec- ondly, satisfaction level of the voters in towns and small cities was not different from the rural voters – in fact slightly higher (65%). These details caution us against following the intuitive common sense that urban voters are anti-Congress and that they vote for alternatives. Besides, we need also to see if knowledge of certain issues made any difference to the choice of the voters. Tables 5 and 6 show the choice of party by voters who had heard of different issues that would typically appeal to the urban voter and who said their vote choice was affected by the awareness of these issues. It seems that this aspect too, does not make much difference. Having heard of these issues, voters still chose to vote for the Congress and its allies. Does this mean that despite the issues being im- portant, the voters did not have the confi- dence that the BJP was the right choice for handling these issues? This note must finally draw attention to an even more striking feature of urban vote. It is not only that the urban voter voted more for the Congress and its allies. Among urban poor, Congress and its allies had a huge advantage as seen from Table 7. What would perhaps sur- prise one the most is the BJP’s deficit among the urban middle class. If this trend continues, it will probably force a rewriting of the political sociology of contemporary India: a party that began as a typically urban party goes on to lose support amongst precisely that section; and a party that is often suspected of being a middle class party now trails behind the Congress with regard to support from that class, cer- tainly requires much more examination than is possible within the scope of this note. But one thing is certain: a develop- ment of this nature should certainly serve as a wakeup call for the BJP, which will have to get their act together in the years to come. Notes 1 Parliamentary constituencies (PCs) were catego- rised based on the proportion of urban population as given by the Election Commission of India. PCs with over 75% urban population were labelled Largely Urban. Those which had an urban popu- lation between 25 and 75% were labelled Semi- Urban and those which had less than 25% urban population were categorised as Rural. 2 The classification of PCs into Big Cities, City/ Town and Villages is as per the Census of India 2001 classification. 3 While analysing changes in vote share there is a need to pay close attention to the number of PCs. Often a decline or increase in vote share may ap- pear to be of greater significance than it actually is, owing to the low number of largely urban con- stituencies. 4 Urban refers to both the semi-urban and the largely urban samples. Table5:VotebyIssueAwareness:UrbanVoters Congress Congress BJP BJP Others Allies Allies Indo-US nuclear deal 21 9 16 4 49 Ram Setu controversy 21 9 18 3 48 Prices of everyday goods 23 9 15 4 49 Terrorist attacks 23 9 16 4 49 Reservations for OBCs 23 9 15 4 50 Livelihood/employment opportunities 23 9 15 4 49 The total number of urban respondents (n) in the NES 2009 on which the data in tables 5, 6 and 7 is based is 10,373. Source: NES 2009. Q: Now I will ask you about some of the issues in the elections. Please tell me if you have heard about them. Table6:VoteChoiceamongThoseAffectedbyIssue-Awareness Congress Congress BJP BJP Others Allies Allies Indo-US nuclear deal 22 9 17 3 49 Ram Setu controversy 21 8 20 3 48 Prices of everyday goods 23 8 15 4 50 Terrorist attacks 22 8 17 4 49 Reservations for OBCs 23 8 14 3 52 Livelihood/employment opportunities 22 8 15 4 50 Source: NES 2009 Q: Now I will ask you about some of the issues in the elections. Please tell me if you have heard about them. (If yes) For each of them, please tell me how it affected your decision of whom to vote for – not very much, a lot or almost entirely. Table7:VotebyClass(urban voters) Congress Congress BJP BJP Others Allies Allies Rich 23 8 20 3 45 Middle Class 23 8 16 3 50 Lower Class 22 9 11 5 52 Poor 24 15 7 5 49 Very Poor 18 18 12 5 47 Source: NES 2009. For the Attention of Subscribers and Subscription Agencies Outside India It has come to our notice that a large number of subscriptions to the EPW from outside the country together with the subscription payments sent to supposed subscription agents in India have not been forwarded to us. We wish to point out to subscribers and subscription agencies outside India that all foreign subscriptions,together with the appropriate remittances, must be forwarded to us and not to unauthorised third parties in India. We take no responsibility whatsoever in respect of subscriptions not registered with us. MANAGER