SlideShare uma empresa Scribd logo
1 de 2
Baixar para ler offline
Chain#:1
File: /var/www/html/Services/ERRAT/DATA/3945942.pdb
Overall quality factor**: 87.147
Program: ERRAT2
Residue # (window center)
95%
99%
*On the error axis, two lines are drawn to indicate the confidence with
which it is possible to reject regions that exceed that error value.
**Expressed as the percentage of the protein for which the calculated
error value falls below the 95% rejection limit. Good high resolution
structures generally produce values around 95% or higher. For lower
resolutions (2.5 to 3A) the average overall quality factor is around 91%.
Errorvalue*
20 40 60 80 100 120 140 160 180 200 220 240 260 280 300
Chain#:1
File: /var/www/html/Services/ERRAT/DATA/3945942.pdb
Overall quality factor**: 87.147
Program: ERRAT2
Residue # (window center)
95%
99%
*On the error axis, two lines are drawn to indicate the confidence with
which it is possible to reject regions that exceed that error value.
**Expressed as the percentage of the protein for which the calculated
error value falls below the 95% rejection limit. Good high resolution
structures generally produce values around 95% or higher. For lower
resolutions (2.5 to 3A) the average overall quality factor is around 91%.
Errorvalue*
320 340 360 380

Mais conteúdo relacionado

Mais de USD Bioinformatics

Clinical Application of RNA Sequencing - Bladder Cancer
Clinical Application of RNA Sequencing - Bladder CancerClinical Application of RNA Sequencing - Bladder Cancer
Clinical Application of RNA Sequencing - Bladder CancerUSD Bioinformatics
 
Small Molecule Real Time Sequencing
Small Molecule Real Time SequencingSmall Molecule Real Time Sequencing
Small Molecule Real Time SequencingUSD Bioinformatics
 
Next Generation Sequencing - the basics
Next Generation Sequencing - the basicsNext Generation Sequencing - the basics
Next Generation Sequencing - the basicsUSD Bioinformatics
 
Session ii g3 overview epidemiology modeling mmc
Session ii g3 overview epidemiology modeling mmcSession ii g3 overview epidemiology modeling mmc
Session ii g3 overview epidemiology modeling mmcUSD Bioinformatics
 
Session ii g3 overview behavior science mmc
Session ii g3 overview behavior science mmcSession ii g3 overview behavior science mmc
Session ii g3 overview behavior science mmcUSD Bioinformatics
 
Session ii g3 lab behavior science mmc
Session ii g3 lab behavior science mmcSession ii g3 lab behavior science mmc
Session ii g3 lab behavior science mmcUSD Bioinformatics
 
Session ii g2 overview protein modeling mmc
Session ii g2 overview protein modeling mmcSession ii g2 overview protein modeling mmc
Session ii g2 overview protein modeling mmcUSD Bioinformatics
 
Session ii g2 overview metabolic network modeling mcc
Session ii g2 overview metabolic network modeling mccSession ii g2 overview metabolic network modeling mcc
Session ii g2 overview metabolic network modeling mccUSD Bioinformatics
 
Session ii g2 overview chemical modeling mmc
Session ii g2 overview chemical modeling mmcSession ii g2 overview chemical modeling mmc
Session ii g2 overview chemical modeling mmcUSD Bioinformatics
 

Mais de USD Bioinformatics (20)

Visualization Tools
Visualization ToolsVisualization Tools
Visualization Tools
 
Clinical Application of RNA Sequencing - Bladder Cancer
Clinical Application of RNA Sequencing - Bladder CancerClinical Application of RNA Sequencing - Bladder Cancer
Clinical Application of RNA Sequencing - Bladder Cancer
 
Clinical Application 1.0
Clinical Application 1.0Clinical Application 1.0
Clinical Application 1.0
 
Clinical Application 2.0
Clinical Application 2.0Clinical Application 2.0
Clinical Application 2.0
 
Bridge Amplification Part 2
Bridge Amplification Part 2Bridge Amplification Part 2
Bridge Amplification Part 2
 
Bridge Amplification Part 1
Bridge Amplification Part 1Bridge Amplification Part 1
Bridge Amplification Part 1
 
Basic Steps of the NGS Method
Basic Steps of the NGS MethodBasic Steps of the NGS Method
Basic Steps of the NGS Method
 
True Single Molecule Sequencing
True Single Molecule SequencingTrue Single Molecule Sequencing
True Single Molecule Sequencing
 
Small Molecule Real Time Sequencing
Small Molecule Real Time SequencingSmall Molecule Real Time Sequencing
Small Molecule Real Time Sequencing
 
Sanger Dideoxy Method
Sanger Dideoxy MethodSanger Dideoxy Method
Sanger Dideoxy Method
 
Pyrosequencing 454
Pyrosequencing 454Pyrosequencing 454
Pyrosequencing 454
 
Ion Torrent Sequencing
Ion Torrent SequencingIon Torrent Sequencing
Ion Torrent Sequencing
 
Next Generation Sequencing - the basics
Next Generation Sequencing - the basicsNext Generation Sequencing - the basics
Next Generation Sequencing - the basics
 
Illumina Sequencing
Illumina SequencingIllumina Sequencing
Illumina Sequencing
 
Session ii g3 overview epidemiology modeling mmc
Session ii g3 overview epidemiology modeling mmcSession ii g3 overview epidemiology modeling mmc
Session ii g3 overview epidemiology modeling mmc
 
Session ii g3 overview behavior science mmc
Session ii g3 overview behavior science mmcSession ii g3 overview behavior science mmc
Session ii g3 overview behavior science mmc
 
Session ii g3 lab behavior science mmc
Session ii g3 lab behavior science mmcSession ii g3 lab behavior science mmc
Session ii g3 lab behavior science mmc
 
Session ii g2 overview protein modeling mmc
Session ii g2 overview protein modeling mmcSession ii g2 overview protein modeling mmc
Session ii g2 overview protein modeling mmc
 
Session ii g2 overview metabolic network modeling mcc
Session ii g2 overview metabolic network modeling mccSession ii g2 overview metabolic network modeling mcc
Session ii g2 overview metabolic network modeling mcc
 
Session ii g2 overview chemical modeling mmc
Session ii g2 overview chemical modeling mmcSession ii g2 overview chemical modeling mmc
Session ii g2 overview chemical modeling mmc
 

Swiss model evaluation

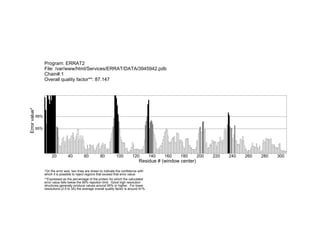
  • 1. Chain#:1 File: /var/www/html/Services/ERRAT/DATA/3945942.pdb Overall quality factor**: 87.147 Program: ERRAT2 Residue # (window center) 95% 99% *On the error axis, two lines are drawn to indicate the confidence with which it is possible to reject regions that exceed that error value. **Expressed as the percentage of the protein for which the calculated error value falls below the 95% rejection limit. Good high resolution structures generally produce values around 95% or higher. For lower resolutions (2.5 to 3A) the average overall quality factor is around 91%. Errorvalue* 20 40 60 80 100 120 140 160 180 200 220 240 260 280 300
  • 2. Chain#:1 File: /var/www/html/Services/ERRAT/DATA/3945942.pdb Overall quality factor**: 87.147 Program: ERRAT2 Residue # (window center) 95% 99% *On the error axis, two lines are drawn to indicate the confidence with which it is possible to reject regions that exceed that error value. **Expressed as the percentage of the protein for which the calculated error value falls below the 95% rejection limit. Good high resolution structures generally produce values around 95% or higher. For lower resolutions (2.5 to 3A) the average overall quality factor is around 91%. Errorvalue* 320 340 360 380