2014 ULI/Butcher Multifamily Housing Forum--Drew Ades
•Transferir como PPTX, PDF•
0 gostou•588 visualizações

Drew Ades, President and CEO, Housing Partnership Equity Trust

Recomendados
Recomendados
Mais conteúdo relacionado
Destaque
Destaque (20)
Mais de ULI Terwilliger Center for Housing
Mais de ULI Terwilliger Center for Housing (11)
Último
Último (20)
2014 ULI/Butcher Multifamily Housing Forum--Drew Ades
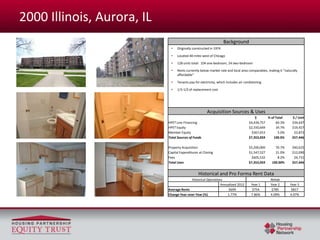
- 1. 2000 Illinois, Aurora, IL Background • Originally constructed in 1974 • Located 40 miles west of Chicago • 128 units total: 104 one-bedroom, 24 two-bedroom • Rents currently below market rate and local area comparables, making it “naturally affordable” • Tenants pay for electricity, which includes air conditioning • 1/3-1/2 of replacement cost Acquisition Sources & Uses HPET Line Financing HPET Equity Member Equity Total Sources of Funds $ % of Total $4,434,757 60.3% $2,550,649 34.7% $367,653 5.0% $7,353,059 100.0% $ / Unit $34,647 $19,927 $2,872 $57,446 Property Acquisition Capital Expenditures at Closing Fees Total Uses $5,200,000 $1,547,527 $605,532 $7,353,059 $40,625 $12,090 $4,731 $57,446 70.7% 21.0% 8.2% 100.00% Historical and Pro Forma Rent Data Historical Operations Annualized 2012 Average Rents $699 Change Year-over-Year (%) 1.77% Year 1 $754 7.86% Rehab Year 2 $785 4.09% Year 3 $817 4.07%
- 2. Woodside Court, Fairfield, CA Background • Originally constructed in 1985 • Located 40 miles northeast of San Francisco and 35 miles southwest of Sacramento • 129 units total: 25 one-bedroom, 104 two- bedroom • Rents restricted by the 60% AMI tax credit levels • Tenant pays all utilities except water, sewer and trash • 1/3-1/2 of replacement cost Acquisition Sources & Uses Existing Debt HPET Equity Member Equity Total Sources of Funds $ % of Total $8,858,000 68.48% $3,431,279 26.52% $646,804 5.00% $12,936,083 100.00% $ / Unit $68,667 $26,599 $5,014 $100,280 Property Acquisition Capital Expenditures at Closing Fees Total Uses $12,000,000 $294,000 $642,083 $12,936,083 $93,023 $2,279 $4,977 $100,280 92.76% 2.27% 4.96% 100.00% Historical and Pro Forma Rent Data Historical Operations Annualized 2012 Average Rents $903 Change Year-over-Year (%) 2.13% Year 1 $926 1.93% Year 2 $944 1.67% Year 3 $960 1.98%
- 3. Woodmere Trace, Norfolk, VA Background • Originally constructed in 1974 • Located in the central portion of the City of Norfolk, 15-20 minutes from downtown Norfolk, Virginia Beach and the Virginia Peninsula • 300 units total: 124 one-bedroom and 176 two-bedroom • Tenant pays for electricity, water is rubbed currently but will be changed to a direct bill • 1/2 of replacement cost Acquisition Sources & Uses HPET Line Financing HPET Equity Member Equity Total Sources of Funds $ % of Total $12,791,970 61.75% $6,887,984 33.25% $1,035,787 5.00% $20,715,741 100.00% $ / Unit $42,640 $22,960 $3,453 $69,052 Property Acquisition Capital Expenditures at Closing Fees Total Uses $15,250,000 $3,993,090 $1,472,650 $20,715,741 $50,833 $13,310 $4,909 $69,052 73.62% 19.28% 7.11% 100.00% Historical and Pro Forma Rent Data Historical Operations Annualized 2012 Average Rents $779 Change Year-over-Year (%) 1.77% Rehab Year 1 $803 7.86% Stabilzation Year 2 Year 3 $829 $817 4.09% 4.07%