1. Investment Focus
As this edition concerns logistics and transport within Asia
I thought I would spend some time discussing a shipping
indicator, and what many people also believe can predict
economic activity (and potential investment returns) - The Baltic
Dry Index.
In 1998 the Baltic Dry Index (BDI) was created by the UK-based
Company Baltic Exchange Ltd with the ambition of offering a reli-able
measure of the changes in cost of raw material sea transporta-tion.
The BDI is a composite of the Baltic Capesize, Panamax,
Handysize and Supramax indices. It is an assessment of the aver-age
price to ship raw materials (such as coal, iron ore, cement and
grains) on a number of shipping routes (about 50) and by ship
size. It is thus an indicator of the cost paid to ship raw materials
on global markets and an important component of input costs. As
such, the index can be considered to be a forward indicator of eco-nomic
activity. Put simply, if there is a high demand to ship goods
globally you would expect high shipping costs and high economic
activity in the future as the goods are delivered, received and
processed. Equally the inverse theoretically should be true, if there
is a lower demand to ship goods globally you would expect ship-ping
costs to drop and economic activity to be lower in the future
as there would be fewer goods in the chain.
This theoretical environment was highly favorable to the use of
the BDI as one of the most respected leading macroeconomic
indicators by many leading economists and institutions. Indeed
it proved to be reliable for a while as it worked during the 2000
and 2008 crisis. Since 2009 however the correlation has diverged
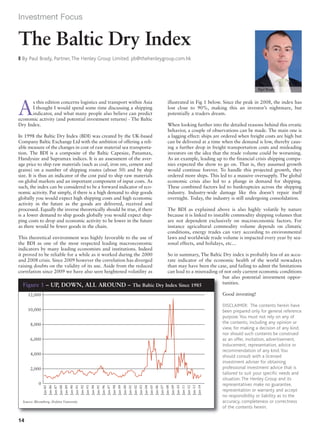
raising doubts on the validity of its use. Aside from the reduced
correlation since 2009 we have also seen heightened volatility as
illustrated in Fig 1 below. Since the peak in 2008, the index has
lost close to 90%, making this an investor’s nightmare, but
potentially a traders dream.
When looking further into the detailed reasons behind this erratic
behavior, a couple of observations can be made. The main one is
a lagging effect: ships are ordered when freight costs are high but
can be delivered at a time when the demand is low, thereby caus-ing
a further drop in freight transportation costs and misleading
investors on the idea that the trade volume could be worsening.
As an example, leading up to the financial crisis shipping compa-nies
expected the show to go on. That is, they assumed growth
would continue forever. To handle this projected growth, they
ordered more ships. This led to a massive oversupply. The global
economic crisis also led to a plunge in demand for shipping.
These combined factors led to bankruptcies across the shipping
industry. Industry-wide damage like this doesn’t repair itself
overnight. Today, the industry is still undergoing consolidation.
The BDI as explained above is also highly volatile by nature
because it is linked to instable commodity shipping volumes that
are not dependent exclusively on macroeconomic factors. For
instance agricultural commodity volume depends on climatic
conditions, energy trades can vary according to environmental
laws and worldwide trade volume is impacted every year by sea-sonal
effects, and holidays, etc…
So in summary, The Baltic Dry index is probably less of an accu-rate
indicator of the economic health of the world nowadays
than may have been the case, and failing to admit the limitations
can lead to a misreading of not only current economic conditions
but also potential investment oppor-tunities.
Good investing!
DISCLAIMER: The contents herein have
been prepared only for general reference
purpose. You must not rely on any of
the contents, including any opinion or
view, for making a decision of any kind,
nor should such contents be construed
as an offer, invitation, advertisement,
inducement, representation, advice or
recommendation of any kind. You
should consult with a licensed
investment adviser for obtaining
professional investment advice that is
tailored to suit your specific needs and
situation. The Henley Group and its
representatives make no guarantee,
representation or warranty and accept
no responsibility or liability as to the
accuracy, completeness or correctness
of the contents herein.
The Baltic Dry Index
z By Paul Brady, Partner, The Henley Group Limited. pb@thehenleygroup.com.hk
Paul Brady
Figure 1 – UP, DOWN, ALL AROUND – The Baltic Dry Index Since 1985
12,000
10,000
8,000
6,000
4,000
0
Jan-85
Jan-86
Jan-87
Jan-88
Jan-89
Jan-90
Jan-91
Jan-92
Jan-93
Jan-94
Jan-95
Jan-96
Jan-97
Jan-98
Jan-99
Jan-00
Jan-01
Jan-02
Jan-03
Jan-04
Jan-05
Jan-06
Jan-07
Jan-08
Jan-09
Jan-10
Jan-11
Jan-12
Jan-13
Jan-14
2,000
Source: Bloomberg, Hofstra University
14
Investment Focus #170, the July/August 2014 issue