AI presentation and introduction - Retrieval Augmented Generation RAG 101
1 Fundamentals Of Sound
1. Fundamentals of Sound
Introduction
In this experiment I learnt more about what sound is, what it looks like and how it is measured. I discovered
that sound is vibrations in the air; they go through the air as sound waves. By using the signal generator and
an oscilloscope I could see these sound waves and learn how to measure them. We learnt about amplitude,
cycles, periods and frequency of sound waves as well as phasing and noise and how this can affect the
sound we hear.
Experiment
Sine Waves
The sine wave can be used to make any sound. It is a pure tone so the waveform is very basic as you can
see below:
http://library.thinkquest.org/06aug/02101/images/Waveforms.png
A sine wave can be created using a signal generator. By connecting the signal generator to the mixing desk I
could listen to the sound of a sine wave.
By splitting the signal from the signal generator, one side to the mixing desk and one side to the oscilloscope,
I was able to see a graphic display of the wave form. Adjusting the Volts/Div dial and the Time/Div dial
allowed me to create a clear looking sine wave.
Signal generator Oscilloscope
http://www.indiamart.com/crownelectronicsystem/pcat- http://www.testequipmentconnection.com/images/prod
gifs/products-small/digital-function-generator.jpg ucts/BK_PRECISION_5105B.JPG
Cycles
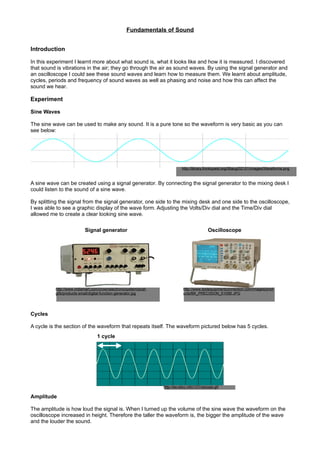
A cycle is the section of the waveform that repeats itself. The waveform pictured below has 5 cycles.
1 cycle
http://ee.stlcc.info/131/oscope.gif
Amplitude
The amplitude is how loud the signal is. When I turned up the volume of the sine wave the waveform on the
oscilloscope increased in height. Therefore the taller the waveform is, the bigger the amplitude of the wave
and the louder the sound.
2. The display screen on the oscilloscope has grid markings on, which are called divisions. Once positioning
the waveform in the middle of the display screen I was able to count the divisions to find out measurements
of the sine wave.
To find out the amplitude of the waveform I counted the divisions from the centre line to the point where the
waveform is at its peak.
Peak
Amplitude
Centre Line
Trough
http://ee.stlcc.info/131/oscope.gif
My waveform came to 1.1 divisions. This number then has to be multiplied by the value that appears on the
Volts/Div dial. This was 5 so the amplitude of my waveform was 5.5 volts.
Frequency
Frequency is similar to the pitch of sound. It is a measurement of how high or low a sound is.
To measure the frequency of the sine wave I have created, I first needed to measure the period of the sound.
The period is the time it takes to do one cycle (from the centre point of the wave past the peak and trough
and back to the next centre point)
Period
Centre Line
http://ee.stlcc.info/131/oscope.gif
To measure the period I had to count the divisions again, but this time horizontally between two adjacent
centre points. The period of the sine wave was 5 divisions. To get the measurement this had to be multiplied
by the reading on the Time/Div dial. This was 1 millisecond so the period is 5 milliseconds.
The frequency of a wave is the number of cycles in a second. The frequency can be worked out by doing 1
divided by the period in seconds. This expression is often written as ƒ = 1/T (T being the period).
The period of my sine wave was 5 milliseconds so in seconds this would be 0.005 seconds.
1 / 0.005 = 200.
This number is measure in hertz so the frequency of the sine wave i created was 200Hz. This is correct as
the frequency is displayed on the signal generator.
Phase
By activating the dual button on the oscilloscope I was able to have two sign waves displayed. This allowed
me to experiment with phase. Phasing is when:
“Two travelling waves which exist in the same medium will interfere with each other. If their amplitudes add,
the interference is said to be constructive interference, and destructive interference if they are "out of phase"
and subtract.” [1]
Once I had the two waves in phase I could move them out of phase by changing the EQ of each sine wave
via the mixing desk. The difference between two waveforms is known as phase shift and this is measured in
degrees. 0 ° are when the two waves are in phase, 180° is when they are out of phase and 360° is when
they are back in phase again.
Phase cannot be heard but it is important not to have waves phasing as when adding two waveforms it can
cause problems.
3. By generating a sine wave in Audacity it became clear what happens when two sine waves are added
together.
These two sign waves are 180° out of When the two waves are combined
phase. they cancel each other out.
Due to this the two frequencies go in
These two sign waves are both at and out of phase repeatedly when
different frequencies. combined
Noise
By turning off the signal generator I created a jagged looking waveform like below:
www.neighbournoise.com/images/oscilloscope.jpg
This is called noise but the graphic on the screen wasn’t just noise. There was a waveform underneath with
regular cycles just like the sine waves. After measuring the frequency of this wave in the same way I had
done previously I found the wave was at the frequency of 50Hz.
“Mains electricity is an A.C. supply. In the UK it has a frequency of 50 cycles per second (50 hertz)” [2]
After research on the internet I found that this wave was actually the frequency of mains electricity and
although we could not hear it, it was still appearing on the oscilloscope.
Conclusion
Learning about the fundamentals of sound is very important if I wish to work in the music industry.
Being a sound engineer or producer it is important to know about how sound works when recording sound in
the studio. Mix downs in the studio could be of poor quality if you don’t know what sound is and how it is
affected. An example could be phasing. If parts of your recordings are out of phase destructive interference
may occur and the mix will be ruined.
4. References
1. Hyper physics. Interference of Sound [Online]
Available at: http://hyperphysics.phy-astr.gsu.edu/Hbase/sound/interf.html
[Accessed 30th November 2008].
2. Antonine Education. What is mains electricity and how can it be used safely? (Topic 7).
[Online]
Available at: http://www.antonine-education.co.uk/physics_gcse/Unit_2/Topic_7/topic__7.htm
[Accessed 30th November 2008].
Rossing, Moore & Wheeler (2002) The Science of sound third edition, San Francisco, Addison
Wesley, p.46
Sciencescope, Frequency of a wave [Online]
Available at: http://www.sciencescope.co.uk/frequency_of_a_wave.htm
[Accessed 30th November 2008]
Hyper text book, Periodic Waves [Online]
Available at: http://hypertextbook.com/physics/waves/periodic/
[Accessed 30th November 2008]
![The display screen on the oscilloscope has grid markings on, which are called divisions. Once positioning
the waveform in the middle of the display screen I was able to count the divisions to find out measurements
of the sine wave.
To find out the amplitude of the waveform I counted the divisions from the centre line to the point where the
waveform is at its peak.
Peak
Amplitude
Centre Line
Trough
http://ee.stlcc.info/131/oscope.gif
My waveform came to 1.1 divisions. This number then has to be multiplied by the value that appears on the
Volts/Div dial. This was 5 so the amplitude of my waveform was 5.5 volts.
Frequency
Frequency is similar to the pitch of sound. It is a measurement of how high or low a sound is.
To measure the frequency of the sine wave I have created, I first needed to measure the period of the sound.
The period is the time it takes to do one cycle (from the centre point of the wave past the peak and trough
and back to the next centre point)
Period
Centre Line
http://ee.stlcc.info/131/oscope.gif
To measure the period I had to count the divisions again, but this time horizontally between two adjacent
centre points. The period of the sine wave was 5 divisions. To get the measurement this had to be multiplied
by the reading on the Time/Div dial. This was 1 millisecond so the period is 5 milliseconds.
The frequency of a wave is the number of cycles in a second. The frequency can be worked out by doing 1
divided by the period in seconds. This expression is often written as ƒ = 1/T (T being the period).
The period of my sine wave was 5 milliseconds so in seconds this would be 0.005 seconds.
1 / 0.005 = 200.
This number is measure in hertz so the frequency of the sine wave i created was 200Hz. This is correct as
the frequency is displayed on the signal generator.
Phase
By activating the dual button on the oscilloscope I was able to have two sign waves displayed. This allowed
me to experiment with phase. Phasing is when:
“Two travelling waves which exist in the same medium will interfere with each other. If their amplitudes add,
the interference is said to be constructive interference, and destructive interference if they are "out of phase"
and subtract.” [1]
Once I had the two waves in phase I could move them out of phase by changing the EQ of each sine wave
via the mixing desk. The difference between two waveforms is known as phase shift and this is measured in
degrees. 0 ° are when the two waves are in phase, 180° is when they are out of phase and 360° is when
they are back in phase again.
Phase cannot be heard but it is important not to have waves phasing as when adding two waveforms it can
cause problems.](data:image/gif;base64,R0lGODlhAQABAIAAAAAAAP///yH5BAEAAAAALAAAAAABAAEAAAIBRAA7)