SlideShare uma empresa Scribd logo
1 de 7
Baixar para ler offline
March 2010 - Real Estate Market Statistics

Denver Southeast - DSE

                                                                            Closed Residential
               Category                        Mar-09           Mar-10           % Change                                                2009      2 0 10
 #Of Closed Sales - Month                         164              191              16.5%             350
                                                                                                      300
 #Of Closed Sales - YTD                           397              439              10.6%
                                                                                                      250
 Avg. Days On Market                              132               98             -25.8%             200
 # Of Active Listings                            1,465            1,378             -5.9%             150
                                                                                                      100
 # Of NEW Listings                                768              857              11.6%
                                                                                                       50
 Absorption Rate (in months)                      8.3               6.5            -21.8%                0
                                                                                                              Jan Feb M ar A pr M ay Jun Jul           A ug Sep Oct No v Dec
 Average Price (Sold)                          428,805           404,714            -5.6%


                                                                                Closed Condo
               Category                        Mar-09           Mar-10           % Change                                                2009      2 0 10
 #Of Closed Sales - Month                         117              142              21.4%             250

 #Of Closed Sales - YTD                           327              342               4.6%             200

 Avg. Days On Market                              116              108              -6.9%             150

 # Of Active Listings                            1,145            1,248              9.0%             100

 # Of NEW Listings                                488              582              19.3%              50
 Absorption Rate (in months)                       9.               8.5             -6.2%                0
                                                                                                              Jan Feb M ar A pr M ay Jun Jul           A ug Sep Oct No v Dec
 Average Price (Sold)                          162,536           188,015            15.7%


                        Land Title Guarantee Company
                                                                  http://www.ltgc.com
 Based on Information from Metrolist, Inc. for the period Jan 2007 through present.Note: This representation is based in whole or in part on data supplied by Metrolist, Inc. Metrolist,
             Inc. does not guarantee nor is in any way resposible for its accuracy. Data maintained by metrolist, Inc. may not reflect all real estate activity in the market.
March 2010 - Real Estate Market Statistics

South Suburban Central - SSC

                                                                            Closed Residential
               Category                        Mar-09           Mar-10           % Change                                                2009      2 0 10
 #Of Closed Sales - Month                          77              115              49.4%             160
                                                                                                      140
 #Of Closed Sales - YTD                           190              254              33.7%
                                                                                                      120
 Avg. Days On Market                               94               83             -11.7%             100
                                                                                                       80
 # Of Active Listings                             540              532              -1.5%              60
 # Of NEW Listings                                288              342              18.8%              40
                                                                                                       20
 Absorption Rate (in months)                      6.6               4.4            -33.2%               0
                                                                                                              Jan Feb M ar A pr M ay Jun Jul           A ug Sep Oct No v Dec
 Average Price (Sold)                          307,761           312,793             1.6%


                                                                                Closed Condo
               Category                        Mar-09           Mar-10           % Change                                               2009      2 0 10
 #Of Closed Sales - Month                          24               45              87.5%             50

 #Of Closed Sales - YTD                            67               81              20.9%             40

 Avg. Days On Market                               50               76              52.0%             30

 # Of Active Listings                             168              179               6.5%             20

 # Of NEW Listings                                 81              112              38.3%             10
 Absorption Rate (in months)                      6.5               3.7            -42.2%              0
                                                                                                            Jan Feb M ar A pr M ay Jun           Jul   A ug Sep Oct No v Dec
 Average Price (Sold)                          166,731           174,465             4.6%


                        Land Title Guarantee Company
                                                                  http://www.ltgc.com
 Based on Information from Metrolist, Inc. for the period Jan 2007 through present.Note: This representation is based in whole or in part on data supplied by Metrolist, Inc. Metrolist,
             Inc. does not guarantee nor is in any way resposible for its accuracy. Data maintained by metrolist, Inc. may not reflect all real estate activity in the market.
March 2010 - Real Estate Market Statistics

South Suburban East - SSE

                                                                            Closed Residential
               Category                        Mar-09           Mar-10           % Change                                                2009      2 0 10
 #Of Closed Sales - Month                          74               95              28.4%             140
                                                                                                      120
 #Of Closed Sales - YTD                           193              223              15.5%
                                                                                                      100
 Avg. Days On Market                              133               99             -25.6%              80
 # Of Active Listings                             733              669              -8.7%              60
                                                                                                       40
 # Of NEW Listings                                346              326              -5.8%
                                                                                                       20
 Absorption Rate (in months)                       9.               6.4            -28.8%                  0
                                                                                                               Jan Feb M ar A pr M ay Jun Jul          A ug Sep Oct No v Dec
 Average Price (Sold)                          450,887           482,597             7.0%


                                                                                Closed Condo
               Category                        Mar-09           Mar-10           % Change                                               2009      2 0 10
 #Of Closed Sales - Month                          25               43              72.0%             60

 #Of Closed Sales - YTD                            71               95              33.8%             50
                                                                                                      40
 Avg. Days On Market                               82              108              31.7%
                                                                                                      30
 # Of Active Listings                             248              281              13.3%
                                                                                                      20
 # Of NEW Listings                                 94              134              42.6%
                                                                                                      10
 Absorption Rate (in months)                      9.4               6.3            -33.2%              0
                                                                                                               Jan Feb M ar A pr M ay Jun        Jul   A ug Sep Oct No v Dec
 Average Price (Sold)                          206,034           183,700           -10.8%


                        Land Title Guarantee Company
                                                                  http://www.ltgc.com
 Based on Information from Metrolist, Inc. for the period Jan 2007 through present.Note: This representation is based in whole or in part on data supplied by Metrolist, Inc. Metrolist,
             Inc. does not guarantee nor is in any way resposible for its accuracy. Data maintained by metrolist, Inc. may not reflect all real estate activity in the market.
March 2010 - Real Estate Market Statistics

Aurora South - AUS

                                                                            Closed Residential
               Category                        Mar-09           Mar-10           % Change                                                2009      2 0 10
 #Of Closed Sales - Month                         255              231              -9.4%             350
                                                                                                      300
 #Of Closed Sales - YTD                           641              523             -18.4%
                                                                                                      250
 Avg. Days On Market                               88               69             -21.6%             200
 # Of Active Listings                             782              894              14.3%             150
                                                                                                      100
 # Of NEW Listings                                408              652              59.8%
                                                                                                       50
 Absorption Rate (in months)                      3.2               3.7             16.3%                0
                                                                                                              Jan Feb M ar A pr M ay Jun Jul           A ug Sep Oct No v Dec
 Average Price (Sold)                          180,556           206,237            14.2%


                                                                                Closed Condo
               Category                        Mar-09           Mar-10           % Change                                                2009      2 0 10
 #Of Closed Sales - Month                         106              135              27.4%             160
                                                                                                      140
 #Of Closed Sales - YTD                           263              282               7.2%
                                                                                                      120
 Avg. Days On Market                              101               66             -34.7%             100
                                                                                                       80
 # Of Active Listings                             444              485               9.2%              60
 # Of NEW Listings                                190              293              54.2%              40
                                                                                                       20
 Absorption Rate (in months)                      4.3               3.6            -17.7%               0
                                                                                                              Jan Feb M ar A pr M ay Jun Jul           A ug Sep Oct No v Dec
 Average Price (Sold)                           91,125           95,278              4.6%


                        Land Title Guarantee Company
                                                                  http://www.ltgc.com
 Based on Information from Metrolist, Inc. for the period Jan 2007 through present.Note: This representation is based in whole or in part on data supplied by Metrolist, Inc. Metrolist,
             Inc. does not guarantee nor is in any way resposible for its accuracy. Data maintained by metrolist, Inc. may not reflect all real estate activity in the market.
March 2010 - Real Estate Market Statistics

Douglas Highlands Ranch Lone Tree - DHL
Includes - Highlands Ranch, Lone Tree
                                                                            Closed Residential
               Category                        Mar-09           Mar-10           % Change                                                2009      2 0 10
 #Of Closed Sales - Month                         121              137              13.2%             200

 #Of Closed Sales - YTD                           231              304              31.6%
                                                                                                      150
 Avg. Days On Market                               94              102               8.5%
                                                                                                      100
 # Of Active Listings                             667              667               0.0%

 # Of NEW Listings                                418              425               1.7%              50

 Absorption Rate (in months)                       5.               4.5            -11.2%                  0
                                                                                                               Jan Feb M ar A pr M ay Jun Jul          A ug Sep Oct No v Dec
 Average Price (Sold)                          349,459           353,646             1.2%


                                                                                Closed Condo
               Category                        Mar-09           Mar-10           % Change                                               2009      2 0 10
 #Of Closed Sales - Month                          13               16              23.1%             35
                                                                                                      30
 #Of Closed Sales - YTD                            40               49              22.5%
                                                                                                      25
 Avg. Days On Market                              174              121             -30.5%             20
 # Of Active Listings                             120              146              21.7%             15
                                                                                                      10
 # Of NEW Listings                                 40               78              95.0%
                                                                                                       5
 Absorption Rate (in months)                      9.2               8.9             -3.2%              0
                                                                                                               Jan Feb M ar A pr M ay Jun        Jul   A ug Sep Oct No v Dec
 Average Price (Sold)                          225,842           214,948            -4.8%


                        Land Title Guarantee Company
                                                                  http://www.ltgc.com
 Based on Information from Metrolist, Inc. for the period Jan 2007 through present.Note: This representation is based in whole or in part on data supplied by Metrolist, Inc. Metrolist,
             Inc. does not guarantee nor is in any way resposible for its accuracy. Data maintained by metrolist, Inc. may not reflect all real estate activity in the market.
March 2010 - Real Estate Market Statistics

Douglas County West - DCW
Includes - Castle Rock, Larkspur, Sedalia, Palmer Lake, part of Littleton
                                                                            Closed Residential
               Category                        Mar-09           Mar-10           % Change                                                2009      2 0 10
 #Of Closed Sales - Month                         106              130              22.6%             200

 #Of Closed Sales - YTD                           229              305              33.2%
                                                                                                      150
 Avg. Days On Market                              175              123             -29.7%
                                                                                                      100
 # Of Active Listings                            1,399            1,145            -18.2%

 # Of NEW Listings                                480              450              -6.3%              50

 Absorption Rate (in months)                      12.5              8.3            -34.1%                  0
                                                                                                               Jan Feb M ar A pr M ay Jun Jul          A ug Sep Oct No v Dec
 Average Price (Sold)                          491,779           397,106           -19.3%


                                                                                Closed Condo
               Category                        Mar-09           Mar-10           % Change                                               2009      2 0 10
 #Of Closed Sales - Month                          15               17              13.3%             30

 #Of Closed Sales - YTD                            33               39              18.2%             25
                                                                                                      20
 Avg. Days On Market                              116              125               7.8%
                                                                                                      15
 # Of Active Listings                             123              101             -17.9%
                                                                                                      10
 # Of NEW Listings                                 41               31             -24.4%
                                                                                                       5
 Absorption Rate (in months)                      7.5               6.2            -17.2%              0
                                                                                                               Jan Feb M ar A pr M ay Jun        Jul   A ug Sep Oct No v Dec
 Average Price (Sold)                          156,310           164,426             5.2%


                        Land Title Guarantee Company
                                                                  http://www.ltgc.com
 Based on Information from Metrolist, Inc. for the period Jan 2007 through present.Note: This representation is based in whole or in part on data supplied by Metrolist, Inc. Metrolist,
             Inc. does not guarantee nor is in any way resposible for its accuracy. Data maintained by metrolist, Inc. may not reflect all real estate activity in the market.
March 2010 - Real Estate Market Statistics

Douglas Elbert Parker - DEP
Includes - Parker, Elizabeth, Franktown, Kiowa, Elbert, Deer Trail, Simla
                                                                            Closed Residential
               Category                        Mar-09           Mar-10           % Change                                                2009      2 0 10
 #Of Closed Sales - Month                         106              144              35.8%             200

 #Of Closed Sales - YTD                           279              315              12.9%
                                                                                                      150
 Avg. Days On Market                              137               99             -27.7%
                                                                                                      100
 # Of Active Listings                            1,093            1,044             -4.5%

 # Of NEW Listings                                412              484              17.5%              50

 Absorption Rate (in months)                      9.8               6.8            -30.9%                  0
                                                                                                               Jan Feb M ar A pr M ay Jun Jul          A ug Sep Oct No v Dec
 Average Price (Sold)                          339,063           319,767            -5.7%


                                                                                Closed Condo
               Category                        Mar-09           Mar-10           % Change                                               2009      2 0 10
 #Of Closed Sales - Month                          16               21              31.3%             35
                                                                                                      30
 #Of Closed Sales - YTD                            43               56              30.2%
                                                                                                      25
 Avg. Days On Market                               72               71              -1.4%             20
 # Of Active Listings                             128              113             -11.7%             15
                                                                                                      10
 # Of NEW Listings                                 46               53              15.2%
                                                                                                       5
 Absorption Rate (in months)                      7.3               4.8            -33.7%              0
                                                                                                               Jan Feb M ar A pr M ay Jun        Jul   A ug Sep Oct No v Dec
 Average Price (Sold)                          146,846           119,881           -18.4%


                        Land Title Guarantee Company
                                                                  http://www.ltgc.com
 Based on Information from Metrolist, Inc. for the period Jan 2007 through present.Note: This representation is based in whole or in part on data supplied by Metrolist, Inc. Metrolist,
             Inc. does not guarantee nor is in any way resposible for its accuracy. Data maintained by metrolist, Inc. may not reflect all real estate activity in the market.

Mais conteúdo relacionado

Mais de Tom Cryer

Residential Price Trends Feeding into Cherry Creek High School 2010
Residential Price Trends Feeding into Cherry Creek High School 2010Residential Price Trends Feeding into Cherry Creek High School 2010
Residential Price Trends Feeding into Cherry Creek High School 2010Tom Cryer
 
MyTownCryer Mid Year 2010 Analysis
MyTownCryer Mid Year 2010 AnalysisMyTownCryer Mid Year 2010 Analysis
MyTownCryer Mid Year 2010 AnalysisTom Cryer
 
MyTownCryer July, 2010
MyTownCryer July, 2010MyTownCryer July, 2010
MyTownCryer July, 2010Tom Cryer
 
MyTownCryer June, 2010
MyTownCryer June, 2010MyTownCryer June, 2010
MyTownCryer June, 2010Tom Cryer
 
A Three Year Sales History for Foxfield, Colorado 80016
A Three Year Sales History for Foxfield, Colorado 80016A Three Year Sales History for Foxfield, Colorado 80016
A Three Year Sales History for Foxfield, Colorado 80016Tom Cryer
 
AVERAGE PRICE AND TRANSACTION COUNT FOR HIGHLANDS RANCH COLORADO 2010
AVERAGE PRICE AND TRANSACTION COUNT FOR HIGHLANDS RANCH COLORADO 2010AVERAGE PRICE AND TRANSACTION COUNT FOR HIGHLANDS RANCH COLORADO 2010
AVERAGE PRICE AND TRANSACTION COUNT FOR HIGHLANDS RANCH COLORADO 2010Tom Cryer
 
The Social Benefits Of Stable Housing
The Social Benefits Of Stable HousingThe Social Benefits Of Stable Housing
The Social Benefits Of Stable HousingTom Cryer
 
Mother\'s Day Denver 2010
Mother\'s Day Denver 2010Mother\'s Day Denver 2010
Mother\'s Day Denver 2010Tom Cryer
 
AVERAGE PRICE HISTORY LAST THREE YEARS IN GREENWOOD VILLAGE, COLORADO
AVERAGE PRICE HISTORY LAST THREE YEARS IN GREENWOOD VILLAGE, COLORADOAVERAGE PRICE HISTORY LAST THREE YEARS IN GREENWOOD VILLAGE, COLORADO
AVERAGE PRICE HISTORY LAST THREE YEARS IN GREENWOOD VILLAGE, COLORADOTom Cryer
 
Denver, Colorado Monthly Mls Stats 2010
Denver, Colorado Monthly Mls Stats 2010Denver, Colorado Monthly Mls Stats 2010
Denver, Colorado Monthly Mls Stats 2010Tom Cryer
 
Weekly Economic Financial Commentary March 26, 2010
Weekly Economic Financial Commentary March 26, 2010Weekly Economic Financial Commentary March 26, 2010
Weekly Economic Financial Commentary March 26, 2010Tom Cryer
 
It Pays to Buy Now!
It Pays to Buy Now!It Pays to Buy Now!
It Pays to Buy Now!Tom Cryer
 
DENVER MARKET WATCH YEAR END 2009
DENVER MARKET WATCH YEAR END 2009DENVER MARKET WATCH YEAR END 2009
DENVER MARKET WATCH YEAR END 2009Tom Cryer
 
February Foreclosure List for Denver, Colorado
February Foreclosure List for Denver, ColoradoFebruary Foreclosure List for Denver, Colorado
February Foreclosure List for Denver, ColoradoTom Cryer
 
Wells Fargo 2010 Annual Outlook
Wells Fargo 2010 Annual OutlookWells Fargo 2010 Annual Outlook
Wells Fargo 2010 Annual OutlookTom Cryer
 
University Hills Denver, CO Real Estate Report
University Hills Denver, CO Real Estate ReportUniversity Hills Denver, CO Real Estate Report
University Hills Denver, CO Real Estate ReportTom Cryer
 
2009 Us Corporate Relocation Benchmarking Survey
2009 Us Corporate Relocation Benchmarking Survey2009 Us Corporate Relocation Benchmarking Survey
2009 Us Corporate Relocation Benchmarking SurveyTom Cryer
 
University of Denver Community Residential Real Estate Trends
University of Denver Community Residential Real Estate TrendsUniversity of Denver Community Residential Real Estate Trends
University of Denver Community Residential Real Estate TrendsTom Cryer
 
Mortgage Brokers Association Data
Mortgage Brokers Association DataMortgage Brokers Association Data
Mortgage Brokers Association DataTom Cryer
 
Economic Summary September, 2009
Economic Summary September, 2009Economic Summary September, 2009
Economic Summary September, 2009Tom Cryer
 

Mais de Tom Cryer (20)

Residential Price Trends Feeding into Cherry Creek High School 2010
Residential Price Trends Feeding into Cherry Creek High School 2010Residential Price Trends Feeding into Cherry Creek High School 2010
Residential Price Trends Feeding into Cherry Creek High School 2010
 
MyTownCryer Mid Year 2010 Analysis
MyTownCryer Mid Year 2010 AnalysisMyTownCryer Mid Year 2010 Analysis
MyTownCryer Mid Year 2010 Analysis
 
MyTownCryer July, 2010
MyTownCryer July, 2010MyTownCryer July, 2010
MyTownCryer July, 2010
 
MyTownCryer June, 2010
MyTownCryer June, 2010MyTownCryer June, 2010
MyTownCryer June, 2010
 
A Three Year Sales History for Foxfield, Colorado 80016
A Three Year Sales History for Foxfield, Colorado 80016A Three Year Sales History for Foxfield, Colorado 80016
A Three Year Sales History for Foxfield, Colorado 80016
 
AVERAGE PRICE AND TRANSACTION COUNT FOR HIGHLANDS RANCH COLORADO 2010
AVERAGE PRICE AND TRANSACTION COUNT FOR HIGHLANDS RANCH COLORADO 2010AVERAGE PRICE AND TRANSACTION COUNT FOR HIGHLANDS RANCH COLORADO 2010
AVERAGE PRICE AND TRANSACTION COUNT FOR HIGHLANDS RANCH COLORADO 2010
 
The Social Benefits Of Stable Housing
The Social Benefits Of Stable HousingThe Social Benefits Of Stable Housing
The Social Benefits Of Stable Housing
 
Mother\'s Day Denver 2010
Mother\'s Day Denver 2010Mother\'s Day Denver 2010
Mother\'s Day Denver 2010
 
AVERAGE PRICE HISTORY LAST THREE YEARS IN GREENWOOD VILLAGE, COLORADO
AVERAGE PRICE HISTORY LAST THREE YEARS IN GREENWOOD VILLAGE, COLORADOAVERAGE PRICE HISTORY LAST THREE YEARS IN GREENWOOD VILLAGE, COLORADO
AVERAGE PRICE HISTORY LAST THREE YEARS IN GREENWOOD VILLAGE, COLORADO
 
Denver, Colorado Monthly Mls Stats 2010
Denver, Colorado Monthly Mls Stats 2010Denver, Colorado Monthly Mls Stats 2010
Denver, Colorado Monthly Mls Stats 2010
 
Weekly Economic Financial Commentary March 26, 2010
Weekly Economic Financial Commentary March 26, 2010Weekly Economic Financial Commentary March 26, 2010
Weekly Economic Financial Commentary March 26, 2010
 
It Pays to Buy Now!
It Pays to Buy Now!It Pays to Buy Now!
It Pays to Buy Now!
 
DENVER MARKET WATCH YEAR END 2009
DENVER MARKET WATCH YEAR END 2009DENVER MARKET WATCH YEAR END 2009
DENVER MARKET WATCH YEAR END 2009
 
February Foreclosure List for Denver, Colorado
February Foreclosure List for Denver, ColoradoFebruary Foreclosure List for Denver, Colorado
February Foreclosure List for Denver, Colorado
 
Wells Fargo 2010 Annual Outlook
Wells Fargo 2010 Annual OutlookWells Fargo 2010 Annual Outlook
Wells Fargo 2010 Annual Outlook
 
University Hills Denver, CO Real Estate Report
University Hills Denver, CO Real Estate ReportUniversity Hills Denver, CO Real Estate Report
University Hills Denver, CO Real Estate Report
 
2009 Us Corporate Relocation Benchmarking Survey
2009 Us Corporate Relocation Benchmarking Survey2009 Us Corporate Relocation Benchmarking Survey
2009 Us Corporate Relocation Benchmarking Survey
 
University of Denver Community Residential Real Estate Trends
University of Denver Community Residential Real Estate TrendsUniversity of Denver Community Residential Real Estate Trends
University of Denver Community Residential Real Estate Trends
 
Mortgage Brokers Association Data
Mortgage Brokers Association DataMortgage Brokers Association Data
Mortgage Brokers Association Data
 
Economic Summary September, 2009
Economic Summary September, 2009Economic Summary September, 2009
Economic Summary September, 2009
 

1st Quarter 2010 Denver Metro Residential Real Estate Market Trends

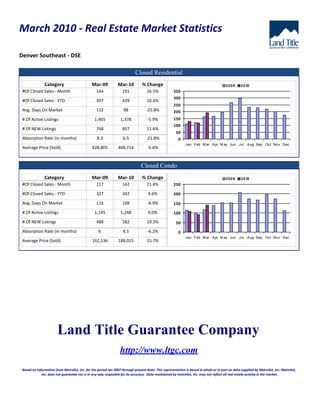
  • 1. March 2010 - Real Estate Market Statistics Denver Southeast - DSE Closed Residential Category Mar-09 Mar-10 % Change 2009 2 0 10 #Of Closed Sales - Month 164 191 16.5% 350 300 #Of Closed Sales - YTD 397 439 10.6% 250 Avg. Days On Market 132 98 -25.8% 200 # Of Active Listings 1,465 1,378 -5.9% 150 100 # Of NEW Listings 768 857 11.6% 50 Absorption Rate (in months) 8.3 6.5 -21.8% 0 Jan Feb M ar A pr M ay Jun Jul A ug Sep Oct No v Dec Average Price (Sold) 428,805 404,714 -5.6% Closed Condo Category Mar-09 Mar-10 % Change 2009 2 0 10 #Of Closed Sales - Month 117 142 21.4% 250 #Of Closed Sales - YTD 327 342 4.6% 200 Avg. Days On Market 116 108 -6.9% 150 # Of Active Listings 1,145 1,248 9.0% 100 # Of NEW Listings 488 582 19.3% 50 Absorption Rate (in months) 9. 8.5 -6.2% 0 Jan Feb M ar A pr M ay Jun Jul A ug Sep Oct No v Dec Average Price (Sold) 162,536 188,015 15.7% Land Title Guarantee Company http://www.ltgc.com Based on Information from Metrolist, Inc. for the period Jan 2007 through present.Note: This representation is based in whole or in part on data supplied by Metrolist, Inc. Metrolist, Inc. does not guarantee nor is in any way resposible for its accuracy. Data maintained by metrolist, Inc. may not reflect all real estate activity in the market.
  • 2. March 2010 - Real Estate Market Statistics South Suburban Central - SSC Closed Residential Category Mar-09 Mar-10 % Change 2009 2 0 10 #Of Closed Sales - Month 77 115 49.4% 160 140 #Of Closed Sales - YTD 190 254 33.7% 120 Avg. Days On Market 94 83 -11.7% 100 80 # Of Active Listings 540 532 -1.5% 60 # Of NEW Listings 288 342 18.8% 40 20 Absorption Rate (in months) 6.6 4.4 -33.2% 0 Jan Feb M ar A pr M ay Jun Jul A ug Sep Oct No v Dec Average Price (Sold) 307,761 312,793 1.6% Closed Condo Category Mar-09 Mar-10 % Change 2009 2 0 10 #Of Closed Sales - Month 24 45 87.5% 50 #Of Closed Sales - YTD 67 81 20.9% 40 Avg. Days On Market 50 76 52.0% 30 # Of Active Listings 168 179 6.5% 20 # Of NEW Listings 81 112 38.3% 10 Absorption Rate (in months) 6.5 3.7 -42.2% 0 Jan Feb M ar A pr M ay Jun Jul A ug Sep Oct No v Dec Average Price (Sold) 166,731 174,465 4.6% Land Title Guarantee Company http://www.ltgc.com Based on Information from Metrolist, Inc. for the period Jan 2007 through present.Note: This representation is based in whole or in part on data supplied by Metrolist, Inc. Metrolist, Inc. does not guarantee nor is in any way resposible for its accuracy. Data maintained by metrolist, Inc. may not reflect all real estate activity in the market.
  • 3. March 2010 - Real Estate Market Statistics South Suburban East - SSE Closed Residential Category Mar-09 Mar-10 % Change 2009 2 0 10 #Of Closed Sales - Month 74 95 28.4% 140 120 #Of Closed Sales - YTD 193 223 15.5% 100 Avg. Days On Market 133 99 -25.6% 80 # Of Active Listings 733 669 -8.7% 60 40 # Of NEW Listings 346 326 -5.8% 20 Absorption Rate (in months) 9. 6.4 -28.8% 0 Jan Feb M ar A pr M ay Jun Jul A ug Sep Oct No v Dec Average Price (Sold) 450,887 482,597 7.0% Closed Condo Category Mar-09 Mar-10 % Change 2009 2 0 10 #Of Closed Sales - Month 25 43 72.0% 60 #Of Closed Sales - YTD 71 95 33.8% 50 40 Avg. Days On Market 82 108 31.7% 30 # Of Active Listings 248 281 13.3% 20 # Of NEW Listings 94 134 42.6% 10 Absorption Rate (in months) 9.4 6.3 -33.2% 0 Jan Feb M ar A pr M ay Jun Jul A ug Sep Oct No v Dec Average Price (Sold) 206,034 183,700 -10.8% Land Title Guarantee Company http://www.ltgc.com Based on Information from Metrolist, Inc. for the period Jan 2007 through present.Note: This representation is based in whole or in part on data supplied by Metrolist, Inc. Metrolist, Inc. does not guarantee nor is in any way resposible for its accuracy. Data maintained by metrolist, Inc. may not reflect all real estate activity in the market.
  • 4. March 2010 - Real Estate Market Statistics Aurora South - AUS Closed Residential Category Mar-09 Mar-10 % Change 2009 2 0 10 #Of Closed Sales - Month 255 231 -9.4% 350 300 #Of Closed Sales - YTD 641 523 -18.4% 250 Avg. Days On Market 88 69 -21.6% 200 # Of Active Listings 782 894 14.3% 150 100 # Of NEW Listings 408 652 59.8% 50 Absorption Rate (in months) 3.2 3.7 16.3% 0 Jan Feb M ar A pr M ay Jun Jul A ug Sep Oct No v Dec Average Price (Sold) 180,556 206,237 14.2% Closed Condo Category Mar-09 Mar-10 % Change 2009 2 0 10 #Of Closed Sales - Month 106 135 27.4% 160 140 #Of Closed Sales - YTD 263 282 7.2% 120 Avg. Days On Market 101 66 -34.7% 100 80 # Of Active Listings 444 485 9.2% 60 # Of NEW Listings 190 293 54.2% 40 20 Absorption Rate (in months) 4.3 3.6 -17.7% 0 Jan Feb M ar A pr M ay Jun Jul A ug Sep Oct No v Dec Average Price (Sold) 91,125 95,278 4.6% Land Title Guarantee Company http://www.ltgc.com Based on Information from Metrolist, Inc. for the period Jan 2007 through present.Note: This representation is based in whole or in part on data supplied by Metrolist, Inc. Metrolist, Inc. does not guarantee nor is in any way resposible for its accuracy. Data maintained by metrolist, Inc. may not reflect all real estate activity in the market.
  • 5. March 2010 - Real Estate Market Statistics Douglas Highlands Ranch Lone Tree - DHL Includes - Highlands Ranch, Lone Tree Closed Residential Category Mar-09 Mar-10 % Change 2009 2 0 10 #Of Closed Sales - Month 121 137 13.2% 200 #Of Closed Sales - YTD 231 304 31.6% 150 Avg. Days On Market 94 102 8.5% 100 # Of Active Listings 667 667 0.0% # Of NEW Listings 418 425 1.7% 50 Absorption Rate (in months) 5. 4.5 -11.2% 0 Jan Feb M ar A pr M ay Jun Jul A ug Sep Oct No v Dec Average Price (Sold) 349,459 353,646 1.2% Closed Condo Category Mar-09 Mar-10 % Change 2009 2 0 10 #Of Closed Sales - Month 13 16 23.1% 35 30 #Of Closed Sales - YTD 40 49 22.5% 25 Avg. Days On Market 174 121 -30.5% 20 # Of Active Listings 120 146 21.7% 15 10 # Of NEW Listings 40 78 95.0% 5 Absorption Rate (in months) 9.2 8.9 -3.2% 0 Jan Feb M ar A pr M ay Jun Jul A ug Sep Oct No v Dec Average Price (Sold) 225,842 214,948 -4.8% Land Title Guarantee Company http://www.ltgc.com Based on Information from Metrolist, Inc. for the period Jan 2007 through present.Note: This representation is based in whole or in part on data supplied by Metrolist, Inc. Metrolist, Inc. does not guarantee nor is in any way resposible for its accuracy. Data maintained by metrolist, Inc. may not reflect all real estate activity in the market.
  • 6. March 2010 - Real Estate Market Statistics Douglas County West - DCW Includes - Castle Rock, Larkspur, Sedalia, Palmer Lake, part of Littleton Closed Residential Category Mar-09 Mar-10 % Change 2009 2 0 10 #Of Closed Sales - Month 106 130 22.6% 200 #Of Closed Sales - YTD 229 305 33.2% 150 Avg. Days On Market 175 123 -29.7% 100 # Of Active Listings 1,399 1,145 -18.2% # Of NEW Listings 480 450 -6.3% 50 Absorption Rate (in months) 12.5 8.3 -34.1% 0 Jan Feb M ar A pr M ay Jun Jul A ug Sep Oct No v Dec Average Price (Sold) 491,779 397,106 -19.3% Closed Condo Category Mar-09 Mar-10 % Change 2009 2 0 10 #Of Closed Sales - Month 15 17 13.3% 30 #Of Closed Sales - YTD 33 39 18.2% 25 20 Avg. Days On Market 116 125 7.8% 15 # Of Active Listings 123 101 -17.9% 10 # Of NEW Listings 41 31 -24.4% 5 Absorption Rate (in months) 7.5 6.2 -17.2% 0 Jan Feb M ar A pr M ay Jun Jul A ug Sep Oct No v Dec Average Price (Sold) 156,310 164,426 5.2% Land Title Guarantee Company http://www.ltgc.com Based on Information from Metrolist, Inc. for the period Jan 2007 through present.Note: This representation is based in whole or in part on data supplied by Metrolist, Inc. Metrolist, Inc. does not guarantee nor is in any way resposible for its accuracy. Data maintained by metrolist, Inc. may not reflect all real estate activity in the market.
  • 7. March 2010 - Real Estate Market Statistics Douglas Elbert Parker - DEP Includes - Parker, Elizabeth, Franktown, Kiowa, Elbert, Deer Trail, Simla Closed Residential Category Mar-09 Mar-10 % Change 2009 2 0 10 #Of Closed Sales - Month 106 144 35.8% 200 #Of Closed Sales - YTD 279 315 12.9% 150 Avg. Days On Market 137 99 -27.7% 100 # Of Active Listings 1,093 1,044 -4.5% # Of NEW Listings 412 484 17.5% 50 Absorption Rate (in months) 9.8 6.8 -30.9% 0 Jan Feb M ar A pr M ay Jun Jul A ug Sep Oct No v Dec Average Price (Sold) 339,063 319,767 -5.7% Closed Condo Category Mar-09 Mar-10 % Change 2009 2 0 10 #Of Closed Sales - Month 16 21 31.3% 35 30 #Of Closed Sales - YTD 43 56 30.2% 25 Avg. Days On Market 72 71 -1.4% 20 # Of Active Listings 128 113 -11.7% 15 10 # Of NEW Listings 46 53 15.2% 5 Absorption Rate (in months) 7.3 4.8 -33.7% 0 Jan Feb M ar A pr M ay Jun Jul A ug Sep Oct No v Dec Average Price (Sold) 146,846 119,881 -18.4% Land Title Guarantee Company http://www.ltgc.com Based on Information from Metrolist, Inc. for the period Jan 2007 through present.Note: This representation is based in whole or in part on data supplied by Metrolist, Inc. Metrolist, Inc. does not guarantee nor is in any way resposible for its accuracy. Data maintained by metrolist, Inc. may not reflect all real estate activity in the market.