SlideShare uma empresa Scribd logo
1 de 29
Baixar para ler offline
In Situ X-Ray Diffraction: Growth and Stability of Platinum
Silicide Films at High Temperature
Timothy Blier
Advisor: Dr. Robert Lad
Department of Physics and Astronomy,
University of Maine, Orono, Maine 04469 USA
(Dated: May 9, 2016)
Abstract
In situ x-ray diffraction (XRD) was performed at high temperatures (up to 1000°C) on 100
nm thick Pt films deposited on Si(100) substrates in order to observe the kinetics of PtSi phase
formation via solid - solid reaction at the Pt - Si interface. The in situ XRD measurements were
facilitated by subjecting the as-deposited Pt/Si(100) films to high temperature environments. This
was accomplished by using an Anton Paar 1100 Domed Hot stage (DHS) instrumented to a PAN-
alytical X’Pert Pro XRD system. The PtSi films were also exposed to a 1000°C environment for
approximately 10 hours, and the structural changes were observed via in situ XRD. The results
indicate the formation of various crystallographic orientations of a PtSi phase without any evidence
for Pt2Si phase formation. During vacuum anneal, the consumption of Pt, indicated by the de-
crease in area of the Pt(111) diffraction peak at 39.76°, begins at approximately 125°C and reaches
completion at approximately 300°C. PtSi phase formation is observed to begin at approximately
225°C and halts at approximately 300°C. Annealing in air results in a Pt(111) diffraction peak
coexisting with the silicide (PtSi) peaks indicating that the Pt(111) oriented grain did not com-
pletely react to form the PtSi phase. The only silicide peaks that persisted during heat treatments
were PtSi(101) and PtSi(002). These observations suggest that an amorphous SiO2 diffusion bar-
rier may have formed at the Pt - Si interface to impede the diffusion of Pt when annealed in air,
whereas, the lack of a SiO2 phase formation during vacuum annealing allowed the PtSi reaction to
reach completion.
1
Contents
I. Introduction 3
II. Experimental 4
A. Overview of X - Ray Diffraction 4
B. Methods 5
C. Film Preparation 8
III. Results and Discussion 9
A. Thermal Expansion of Pt Film 9
B. In Situ Measurements of Platinum Silicide Formation During Annealing from
25°C to 1000°C in Vacuum 11
C. In Situ Measurements of Platinum Silicide Formation During Annealing from
25°C to 1000°C in air 16
IV. Conclusions 20
V. Suggestions for Further Research 21
Acknowledgments 22
References 23
VI. Appendix 25
2
I. INTRODUCTION
Pt - silicide thin films are widely used in silicon integrated circuit technologies and play
an important role in many microelectronic device applications. Silicides of Pt, and other
transition metals, including Pd, Ti, and Ni, are widely favorable due to their thermal sta-
bility, chemical inertness, high thermal and electrical conductivity, and high hardness [1, 2].
A major application for transition metal silicide films includes complementary metal-oxide-
semiconductor (CMOS) devices, where they act as Ohmic contacts between metal intercon-
nects and source, gate, and drain transistors [3].
Platinum silicide (PtSi) films have found an important role as either Ohmic contacts or
Schottky barrier contacts in large scale integrated circuits and infrared detectors [4]. PtSi
is an ideal candidate for many microelectronics applications due to its low Schottky barrier
to p-type Si of about 0.3 eV [5], and its high thermal stability up to 160°C [6]. It has also
been shown that PtSi allows for the formation of silicide/Si contacts with specific contact
resitivity as low as 0.1 ohms/mm2
which is interesting for p-type MOSFETs [7] as well as
several other microelectronic sensors and devices [8–10]. For n-type semicondictors, PtSi
shows a high Schottky barrier and has the potential to be used on devices such as Schottky
barrier MOSFETs [11], or power MOSFETs [12].
This paper reports on results of experiments observing the formation of Pt - silicide films,
in particular PtSi, via solid - solid reaction. The objective of this work is to examine the
kinetics of PtSi formation and stability of the PtSi phase in high temperature environments.
This project required learning how to operate a PANalytical X’Pert Pro XRD system and
an Anton Paar 1100 Domed Hot Stage (DHS), as well as developing the methodology to
measure and analyze XRD data in situ up to 1000°C. As a means to gain familiarity with the
XRD system and data analysis, several types of thin film samples were analyzed, including
Pt-ZrO2 and Pt-Al2O3 architectures; these data are not reported in this paper. The main
focus of this paper is Pt - Si films and the rate of PtSi phase formation in high tempera-
ture environments. In the PtSi system, changes in the film structure and morphology are
important to understand in order create films that remain electrically conductive after high
temperature treatments.
This study was performed using facilities within the Laboratory for Surface Science and
Technology (LASST), and under the support of NSF grant, DMR - 1309983: SusChEM:
3
”Ceramic Based Nanocomposite Films and Sensors for Life Cycle Monitoring of Materials
in High Temperature Harsh Environments”. Other researchers funded by this grant are de-
veloping nanocomposite, multi-layer thin film structures that remain architecturally stable in
high temperature harsh environments. The usefulness of Pt - silicide films notwithstanding,
these films are often plagued by agglomeration effects within high temperature environ-
ments. These effects destroy the electrical conductivity of the films rendering them useless
in microelectronic devices. Solving this agglomeration problem will enable the use of reliable
sensor devices to monitor the life cycle of machinery in high temperature environments asso-
ciated with industry: turbine engines, petrochemical processing plants, combustion burners,
power plant boilers, oil/gas drilling as well as metals smelting and refining. Many of these
industrial processes rely on large, sophisticated pieces of machinery that require regular
maintenance in order to evaluate the condition of internal components. This maintenance
results in high costs due to its inefficient nature. Cost savings can be achieved by optimiz-
ing the maintenance of machinery by utilizing miniature sensors within these environments.
However, in order to achieve a stable sensor, the thin film materials used must remain stable
in order to maintain normal operation even within harsh environments. This paper focuses
specifically on Pt - silicide films as a candidate thin film material in this regard.
II. EXPERIMENTAL
A. Overview of X - Ray Diffraction
Diffraction was the phenomenon that first brought the wave nature of matter and light
into the view of scientists. In 1914, it was discovered that diffraction had another, very
useful application. Max von Laue discovered that a crystalline structure with a periodic
arrangement of atoms acts as a 3-dimensional diffraction grating. W.H. Bragg then expanded
this theory in 1915 to analyze the atomic structure of crystalline materials using XRD. The
rules developed by Bragg (Bragg’s law) allow for the examination of the distance between
atoms in a crystalline material to a precision of ±0.001 ˚A.
4
FIG. 1: Incident x-rays being scattered from atomic planes. Intensity of scattered x-rays
is maximum when the extra path-length traveled by adjacent scattered x-rays is equal to
2dsin(θ)
X - ray diffraction is a powerful and non - destructive technique that allows for the precise
structural characterization of crystalline materials. When an x-ray beam is incident on a
crystal plane of an atomic lattice, a portion of the beam will be scattered by the atoms and
a portion will be scattered by an adjacent, parallel crystalline plane(Fig. 1). The scattered
wave fronts created by the adjacent crystalline planes will have a phase lag because the
scattered x - rays must travel an additional path length 2dsin(θ), where d is the atomic
spacing. If this difference in path length is an integer number of wavelengths of the incident
light, then constructive interference occurs and the intensity of the scattered x - rays is
maximum. This analysis results in the well-known Bragg’s law (1) for diffraction from an
atomic lattice. X - ray diffraction has many useful application. Within the realm of thin
films x - ray diffraction can be used for phase identification, stress and strain analysis, film
quality and dislocation density, measuring roughness and thickness, as well as determining
film quality and grain orientation.
λ = 2dhklsin(θ) (1)
B. Methods
Characterization of thin film crystalline structures during annealing in air and vacuum
up to 1000°C was performed in situ using an Anton Paar 1100 Domed Hot Stage (DHS)
mounted to a PANalytical X’Pert Pro XRD system. A schematic diagram of the geometry
5
used for XRD scans is shown in Fig 2. Incident optics included a Cu - Kα radiation source,
1/2° divergent slit and parabolic x - ray mirror. Receiving optics included a 0.18 parallel
plate collimator, 0.02 soller slit and a proportional Xe detector. These optics were chosen
to make the incident and receiving x - rays beams as parallel as possible; this eliminates
variances in XRD spectra due to changes in sample thickness and changes in the XRD
alignment at high temperatures caused by thermal expansion. The application of these
optics inside the PANalytical X’Pert Pro XRD is shown in Fig. 3.
FIG. 2: Parallel beam geometry of the x-ray diffraction experiment showing the x-ray source,
incident beam optics, sample, diffracted beam optics, and detector.
FIG. 3: Image showing the inside of the PANalytical X’Pert Pro XRD system. Incident
optics are to the far right, sample stage and goniometer are center-most, and the diffracted,
or receiving optics are to the far left.
6
Samples were mounted on the DHS (Fig. 4a) which was attached to a PANalytical X’Pert
Pro XRD system (Fig. 4b). This novel sample heating stage includes an AlN heater that can
reach 1100°C, inconel sample clips to hold the thin film sample, and a carbon dome which
acts to contain the heat to a small volume while remaining x - ray transparent (although x -
rays enter and exit through the dome, there is only a slight attenuation of the x - ray beam).
The dome also allows for the sample to be subjected to pressures ranging from atmosphere
to 10−4
Torr.
(a) 1100 Anton Paar Domed Hot Stage: (1)
Carbon, x-ray transparent dome (2) AlN
heater stage (3) Inconel sample clips (4) con-
nection for ingas/vacuum and temperature
control
(b) PANalytical X’Pert Pro XRD system lo-
cated in the Laboratory for Surface Science and
Technology at the University of Maine
FIG. 4:
Annealing of the Pt/Si(100) film samples was carried out in either atmospheric pressuer
(760 Torr) or 10−4
Torr. XRD spectra were continuously recorded using Bragg - Brentano
7
geometry(Fig. 5). For experiments conducted in this study, samples underwent two types
of heat treatment: increasing temperature steps and isothermal holds. After an initial
room temperature (25°C) scan, the sample temperature was increased to 130°C and then
increased in 10°C steps thereafter. During each step, the temperature was held constant
while an XRD spectrum was recorded. Isothermal treatments were conducted at 1000°C
with XRD spectra being acquired approximately every 10 minutes. Due to time constraints,
only the air annealed sample was allowed to dwell at 1000°C.
FIG. 5: Angle of incidence(ω) is between the x-ray source and the sample. The diffracted
beam angle(2θ) is between the incident beam and the detector. Using this geometry the
source remains fixed while the sample rotates by the angle θ and the detector rotates by the
angle 2θ
C. Film Preparation
A 100 nm thick Platinum thin film was grown on an n-type Si(100) wafer using DC
sputtering in the LASST clean room by graduate student Robert Fryer. Si(100) wafer was
treated by buffered-oxide-etch in order to obtain a clean, oxide free Si surface prior to Pt
deposition. Sputter deposition of the Pt film was conducted using 300 W power, 3 mTorr of
Ar gas and a 99.999% pure platinum target. Following deposition, the Pt/Si sample was cut
into a size of approximately 5mmx20mm; these sample dimensions eliminated interference
by the sample stage during XRD characterization.
8
III. RESULTS AND DISCUSSION
A. Thermal Expansion of Pt Film
In situ XRD is an ideal tool for measuring thermal expansion of materials because 2θ
peak position can be directly correlated to crystal lattice spacing, which allows for the
examination of the response of materials to an increase in temperature. When a material
is heated, the energy of the crystal lattice increases which results in increased vibrational
motion of the atoms and a larger than average bond distance due to anharmonic motion.
For isotropic materials, 1-D or linear expansion can be assumed. The average displace-
ment of the atoms in a crystal lattice can be examined using the Boltzmann distribution(2).
x =
+∞
−∞
xe−(U(x)/kT)
+∞
−∞
e−(U(x)/kT)
dx (2)
For temperatures below the melting point of a material, thermal expansion can be
considered to be linear with temperature. The potential energy of the of atoms displaced
from equilibrium can be expressed as:
U(x) = cx2
− gx3
− fx4
(3)
Using this potential energy, equation 2 becomes:
x ∼=
3g
4c2
kT (4)
Therefore, the average displacement of atoms in a crystal lattice increases with temperature.
This linear expansion can be expressed as the fractional change in length:
9
∆L
L0
= α∆T (5)
where the fractional change in length is determined by the 2θ peak position in Bragg’s law
for constructive interference.
The experiments to determine the thermal expansion of a Pt thin film were used as a
learning tool. These experiments were conducted in order to gain experience operating the
XRD system, properly aligning a sample, using the data collection software, and using the
DHS.
Figure 6 shows the results of in situ XRD experiments examining the response of a Pt
(111) peak to annealing. The peak shows a shift in position to a lower angle as temperature
is increased. This shift to a smaller angle correlates to an increasing atomic spacing within
the crystal lattice due to inverse nature of peak position (2θ) and atomic spacing predicted
by Bragg’s law.
FIG. 6: In situ thermal expansion of a Pt thin film deposited on a sapphire substrate.
Shown is a planar view of intensity as a function of both temperature and 2θ degrees.
Relative intensity is indicated by color
Figure 7 displays the fractional change in length determined from the results shown in
10
Figure 6 as a function of temperature. From the linear fit of the data, a coefficient of linear
expansion for the Pt film is determined to be 1.01 × 10⁻⁵
C−1
. The accepted bulk value
for the coefficient of linear expansion of Pt is 9 × 10⁻⁶
C−1
. The cause for the discrepancy
between the calculated value and the accepted value for the coefficient of linear expansion
is most likely due to differences in bond distances near the surface of the Pt film and within
the thin film as compared to the bond distance in bulk, 3-dimensional materials.
FIG. 7: Fractional change in length of a Pt thin film as a function of temperature. The
linear coefficient of thermal expansion, as determined by the slope of the fit, is 1.01 × 10⁻⁵
B. In Situ Measurements of Platinum Silicide Formation During Annealing from
25°C to 1000°C in Vacuum
In order to observe the formation of a PtSi phase due to solid - solid reaction of the
Pt/Si(100) sample, in situ XRD measurements were taken during heat treatment in vac-
uum (10−4
Torr). Figure 8 displays three XRD spectra at different times during the heat
treatment by steps: room temperature before annealing, at 1000°C, and room temperature
after annealing. At 1000°C it is observed that Pt, present before annealing, has been con-
sumed and two silicide grain orientations, PtSi(101) and PtSi(002), have formed. There are
several diffraction peaks (identified by *) present in the 1000°C and after annealing spectra,
that are not present in the as - deposited spectrum. These extra peaks are artifacts due to
the sample shifting during measurement resulting in additional diffraction peaks from the
11
sample stage. The sample shift on the stage occurred at approximately 870°C. Irregard-
less, the PtSi peaks are well defined and Figure 8 shows the Pt phase being almost entirely
consumed from the solid - solid reaction.
FIG. 8: XRD spectra from the Pt/Si(100) sample at (a) room temperature, (b) at 1000°C,
and (c) at room temperature after annealing. Peaks that are starred are due to diffraction
from the AlN sample heater. The AlN heater peaks are only present in (b) and (c) since, in
these cases, the sample shifted on the heater stage at about 870°C
Fig. 9 shows a detailed, 3-D, in situ map of the Pt - Si film during heat treatment
in vacuum(10−4
Torr). This color scale represents the natural log of the peak intensity
as a function of 2θ and temperature using a Matlab script (see Appendix: A). Figure 10
shows a planar view of the same data with the intensity plotted as contour lines, and labels
are displayed for various points of interest in the data: the black lines represent PtxSiy
compounds while the dotted and solid red lines represent artifacts due to the AlN sample
stage and Cu - Kβ peaks. At approximately 240°C, a polycrystalline PtSi phase is observed
to form resulting in the consumption of Pt. Comparing these peak positions to those in
the powder diffraction database [13, 14] gives evidence to the poly-crystalline layer being
composed of PtSi(101), PtSi(200), PtSi(220), Pt(200), PtSi(002), PtSi(112), and PtSi(022)
grain orientations. Higher temperatures result in the disappearance of all PtSi peaks except
12
PtSi(101) and PtSi(002) indicating that these grain continued to grow at the expense of the
other grain orientations. PtSi(002), as well as Pt (111) and PtSi(101) above 750°C, shows
a steady increase in peak intensity. This is most likely an indication of recrystallization
or grain growth. PtSi(002) shows a decrease in intensity between about 350°C and 700°C
with a steady increase in intensity thereafter. The initial decrease may be a result of the
attenuation of the scattered x -rays due to increased thermal motion of the atomic lattice
which is then compensated by subsequent recrystallization or grain growth.
FIG. 9: In situ XRD map of Pt thin film on Si(100) during annealing in vacuum. Shown is
the intensity of diffraction peaks as a function of temperature and 2θ degrees
.
13
FIG. 10: Planar view of in situ XRD map for Pt thin film on Si(100) from 25°C to 1000°C.
Peak intensities are represented by a color scale.
Fig. 11 displays the peak areas of the PtSi(101), PtSi(002), and Pt(111) peaks normalized
to the maximum value of the Pt(111) peak. The left y-axis represents a scale for the
PtSi(101) and PtSi(002) peaks while the right y-axis represents a scale for the Pt(111) peak.
Figure 12 shows the same results as Figure 11 but with a magnified y-axis scale in order
to show more detail in the Pt(111) and PtSi(101) area data at higher temperatures. An
interesting result shown from Figure 12 is that the Pt is not completely consumed. A very
small diffraction peak for Pt(111) persists throughout the treatment after the solid - solid
reaction and silicide formation as observed in Fig. 11. This could be explained by the
presence of a large Pt droplet on the surface. This droplet would have formed during the
DC sputtering film deposition process, which could not be completely react to form a PtSi
phase.
14
FIG. 11: Normalized area of the PtSi(101), Pt(111), and PtSi(002) peaks during annealing
in vacuum. Peak area was normalized to the Pt(111) peak.
From Figure 11, the initial silicide formation is observed at approximately 240°C while
the consumption of Pt begins at approximately 125°C. A cause for the discrepancy in the
temperatures of PtSi formation and Pt consumption is likely due to the initial PtSi grain size
being too small to be distinguishable from the background noise. At 850°C, the normalized
area of PtSi(101) is observed to increase and the normalized area of PtSi(002) is observed
to decrease. This may be an indication of grain growth of PtSi(101). However, this may
also be the result of the sample shifting on the sample stage. Thus, no conclusion should be
drawn from the observed data above 850°C.
15
FIG. 12: Normalized area of of Pt(111) and PtSi(101) peaks. This is the same data presented
in Fig. 10 but with a magnified scale in order to show more detail.
C. In Situ Measurements of Platinum Silicide Formation During Annealing from
25°C to 1000°C in air
The Pt/Si(100) solid state reaction was repeated in air. Figure 13 shows three XRD
spectra: an initial room temperature measurement, a 1000°C measurement, and a room
temperature measurement after annealing. Observed is a strong Pt(111) peak present before
annealing. The in situ measurement at 1000°C shows a Pt(111) peak that has increased
in intensity and that coexists with PtSi(101) and PtSi(002) peaks. These results indicate
some Pt - silicide formation. The persistent Pt(111) peak was unexpected, however. It was
expected that the Pt(111) peak would be fully consumed during the Pt - Si reaction, as it
was during vacuum treatments.
16
FIG. 13: XRD spectra of Pt thin film on Si(100) substrate during three steps of heat
treatment in air. Shown are XRD spectra at (a) room temperature before annealing, (b) at
1000°C, and (c) at room temperature after annealing.
Figure 14 shows the more detailed, 3-D in situ XRD map during annealing by steps. The
natural log of the intensity obtained via XRD is plotted as a function of both 2θ position
and temperature. Figure 15 shows a planar view of the same data with intensity plotted as
contour lines (a) as well as data obtained during isothermal treatment at 1000°C (b) and
displays labels for various points of interests in the data: the black lines represent PtxSiy
compounds while the dotted and solid red lines represent artifacts due to the AlN sample
stage and Cu - Kβ peaks.
From Figures 14 and 15, the decrease in peak intensity is evidence for the consumption
of Pt, and silicide formation is observed at approximately 330°C. At this temperature, the
results indicate formation of a poly-crystalline layer as was the case for heat treatment in
vacuum. At higher temperatures, it is observed that PtSi(101) and PtSi(002) experience
grain growth as indicated by the increase in their respective peak intensities and decrease in
the intensities of all other peaks besides that of Pt(111). From Fig. 15 it is observed that the
PtSi(101), Pt(111), and PtSi(002) peaks endure through both increasing temperature steps
and isothermal heat treatments. During temperature ramping, the PtSi(002) peak shows a
17
steady increase in intensity and the PtSi(101) peak shows a decrease in intensity between
550°C and 750°C with a steady increase thereafter. No major structural or morphological
changes were observed during the isothermal treatment.
FIG. 14: In situ XRD map of Pt thin film on Si(100) during annealing in air. Shown is the
intensity of diffraction peaks as a function of temperature and 2θ degrees
A key feature of both Figures 14 and 15 is that the Pt(111) peak at 39.76° 2θ endures
both the heat treatments. It has been shown that during annealing, Pt will be completely
consumed when treated in this way in vacuum or nitrogen environments. However, only
slight consumption of Pt is observed at approximately 330°C, as indicated by the silicide
formation and decrease in the Pt(111) peak intensity. Because the silicide formation is
facilitated via the simultaneous diffusion of Pt into the Si substrate and vice versa, a likely
18
cause of a sustained Pt phase is the presence of a diffusion barrier. It has been reported
[15] that SiO2 forms when Pt - Si films are annealed in air and the amorphous SiO2 phase
is believed to act as a diffusion barrier. The amorphous Si02 layer does not give an XRD
signal but may be a likely cause of the persistent Pt(111) peak.
FIG. 15: (a) In situ XRD maps in air of a Pt thin film on Si(100) after the heat treatment by
steps from 25°C to 1000°C in air, and (b) during the isothermal heat treatment at 1000°C.
Peak intensity is represented by the color scale.
Fig. 16 displays the peak areas of the PtSi(101), PtSi(002), and Pt(111) normalized to the
maximum value of the Pt(111) peak. The left y-axis represents a scale for the PtSi(101) and
PtSi(002) peaks, while the right y-axis represents a scale for the Pt(111) peak. Initial silicide
formation and Pt consumption is observed at approximately 320°C. Silicide formation and
consumption of Pt is observed to halt at approximately 330°C. Unlike annealing in vacuum,
there is no apparent lag between the temperature of initial Pt consumption and that of
19
the initial PtSi phase formation. The normalized area of the PtSi(002) peak is shown to
increase throughout the treatment, suggesting recrystallization, while the normalized area
of the PtSi(101) peak is shown to remain relatively unchanged after the initial formation.
The Pt(111) peak is observed to increase in area between 650°C and 750°C and is observed
to decrease in area thereafter.
FIG. 16: Normalized areas of the PtSi(101), Pt(111), and PtSi(002) peaks during annealing
in air. Peak areas are normalized to the Pt(111) peak.
IV. CONCLUSIONS
Solid state reaction was successfully used to form a PtSi phase from an as-deposited 100
nm thick Pt film on a clean Si(100) substrate in vacuum and atmospheric conditions. In situ
XRD at high temperatures reveals that vacuum annealing results in the complete consump-
tion of platinum to form a poly-crystalline PtSi layer composed of PtSi(101), PtSi(002),
PtSi(200), PtSi(220), PtSi(112), and PtSi(022) grains at approximately 240°C; PtSi(101)
and PtSi(002) are the preferred orientation that remain after final heat treatments. An-
nealing in air resulted in the solid state reaction of Pt/Si(100) to the PtSi phase being
interrupted by the formation of an amorphous SiO2 layer that acts as a diffusion barrier.
The same PtSi poly-crystalline layer forms as in vacuum, but the reaction goes to comple-
tion at approximately 330°C with PtSi(101) and PtSi(002) being the preferred orientations.
Extended annealing at 1000°C for 10 hours resulted in no morphological change in the PtSi
film.
A large portion of this work was dedicated to developing a technique to acquire in situ
XRD spectra at high temperatures using an Anton Paar 1100 DHS and PANalytical X’Pert
Pro XRD system. This was accomplished by developing a procedure to properly operate
the DHS, select x-ray optics to acquire meaningful and accurate data, as well as developing
Matlab tools for data analysis and visualization, and formatting the report in Latex; this
work was my first introduction to Matlab and Latex.
The major conclusion can be summarized as follows:
• Successfully developed and implemented technique to acquire in situ XRD spectra up
20
to 1000°C using a 1100 Anton Paar Domed Hot Stage and PANalytical X’Pert Pro
XRD system
1. Procedure for operation of DHS
2. Optics to acquire accurate date
3. Matlab tools for data analysis and visualization
• Under vacuum conditions Pt/Si(100) undergoes solid state reaction to form a PtSi
phase
1. PtSi(101), PtSi(200), PtSi(020), PtSi(220), PtSi(002), PtSi(112), and PtSi(022)
initially form a polycrystalline layer at approximately 240°C.
2. PtSi(101) and PtSi(002) are the preferred orientations that develop during heat
treatment.
3. Trace amounts of Pt(111) persist throughout the heat treatment in vacuum.
• In air, the solid state reaction of Pt/Si(100) to the PtSi phase is hindered by an
amorphous SiO2 layer forming and acting as a diffusion barrier
1. The same polycrystalline layer forms as did in vacuum but at at a higher tem-
perature of approximately 330°C.
2. PtSi(101) and PtSi(002) are the preferred orientation observed during the heat
treatment in air.
3. Extended annealing at 1000°C for approximately 10 hours results in no morpho-
logical change in the PtSi film or additional consumption of Pt.
V. SUGGESTIONS FOR FURTHER RESEARCH
1. Perform in situ experiments using different substrates (i.e. Si(100) vs. Si(111)).
2. Perform in situ experiments using different thicknesses of as - deposited Pt films.
3. Purposely grow an SiO2 layer to hinder the diffusion in vacuum and compare results
of the air anneal.
21
4. Perform in situ experiments in different atmospheres using the gas delivery system
being developed by Matthew Curti for his senior project at LASST.
Acknowledgments
This work was performed as a capstone research project for a Bachelors of Science in
Physics at the University of Maine. I would like to thank my research adviser Dr. Robert
Lad, my capstone adviser Dr. James McClymer, LASST research scientist Dr. George
Bernhardt, graduate students Robert Fryer and David Stewart, as well as my undergraduate
colleague, Matthew Curti, for their valuable insights and support. This work was funded
by the National Science Foundation (NSF) under Sustainable Chemistry, Engineering &
Materials (SusChEM) grant #1309983.
22
References
[1] C. Fitz, M. Goldbach, A. Dupont, and S. Schmidbauer. Silicides as contact material for
DRAM applications. Microelectronic Engineering, 82(3-4):460–466, DEC 2005. PT: J; CT:
European Workshop on Materials for Advanced Metallization; CY: MAR 06-09, 2005; CL:
Dresden, GERMANY; SI: SI; UT: WOS:000234236100041.
[2] N. S. Stoloff, C. T. Liu, and S. C. Deevi. Emerging applications of intermetallics. Inter-
metallics, 8(9-11):1313–1320, SEP-NOV 2000 2000. PT: J; SI: SI; CT: International Sym-
posium on Intermetallics for the 3rd Millennium - A Symposium Dedicated to RW Cahn;
CY: NOV 01-04, 1999; CL: CINCINNATI, OHIO; SP: ASM Int, Intermetall Mat Comm Crit
Technol Sector; US DOE; TC: 286; UT: WOS:000165753700039.
[3] Omar Abbes, Khalid Hoummada, Dominique Mangelinck, and Veronique Carron. Formation
of Pt silicide on doped Si: Kinetics and stress. Thin Solid Films, 542:174–179, SEP 2 2013
2013. PT: J; TC: 2; UT: WOS:000323859400029.
[4] P. W. Pellegrini, C. E. Ludington, and M. M. Weeks. The dependence of schottky-barrier po-
tential on substrate orientation in PtSi infrared diodes. Journal of Applied Physics, 67(3):1417–
1420, FEB 1 1990 1990. PT: J; TC: 28; UT: WOS:A1990CL92000044.
[5] Manish K. Niranjan, Stefan Zollner, Leonard Kleinman, and Alexander A. Demkov. Theoreti-
cal investigation of PtSi surface energies and work functions. Physical Review B, 73(19):195332,
MAY 2006 2006. PT: J; TC: 23; UT: WOS:000237950400100.
[6] V. W. L. Chin, M. A. Green, and J. W. V. Storey. Current transport mechanisms studied
by i-v-t and ir photoemission measurements on a p-doped PtSi schottky diode. Solid-State
Electronics, 36(8):1107–1116, AUG 1993 1993. PT: J; TC: 26; UT: WOS:A1993LK58000005.
[7] V. Carron, F. Nemouchi, Y. Morand, T. Poiroux, M. Vinet, S. Bernasconi, O. Louveau,
D. Lafond, V. Delaye, F. Allain, S. Minoret, L. Vandroux, and T. Billon. Platinum Silicide
Metallic Source & Drain Process Optimization for FDSOI pMOSFETs. 2009 2009. PT: B;
CT: IEEE International SOI Conference 2009; CY: OCT 05-08, 2009; CL: Foster City, CA;
SP: IEEE; TC: 0; UT: WOS:000276151400045.
[8] R.T. Fryer, R.J. Lad. Electrical conductivity and thermal stability of Pt3Si, Pt2Si, and PtSi
films grown by e-beam co-evaporation. Journal of Alloys and Compounds, (2016, in press).
23
[9] R.T. Fryer, R.J. Lad. Comparison of PtSi films grown by solid-state reaction and by e-beam
co-evaporation: Thermal stability in air at 1000 C. MRS Advances, (2016, in press).
[10] R.J. Lad, D.M. Stewart, R.T. Fryer, J.C. Sell, D.J. Frankel, G.P. Bernhardt, R.W. Meulenberg.
Electrical conductivity of Pt-Zr-B and Pt-Si thin films for use in high temperature harsh
environments. MRS Advances, (2016, in press).
[11] L. E. Calvet, H. Luebben, M. A. Reed, C. Wang, J. P. Snyder, and J. R. Tucker. Subthreshold
and scaling of PtSi schottky barrier mosfets. Superlattices and Microstructures, 28(5-6):501–
506, NOV-DEC 2000 2000. PT: J; CT: 5th Silicon Nanoelectronics Workshop; CY: JUN
11-12, 2000; CL: HONOLULU, HAWAII; SP: Inst Elect & Electr Engineers; TC: 21; UT:
WOS:000165917400026.
[12] Miroslav Sumega and Vladimir Ac. Study of PtSi/TiW vs PtSi/Ti-TiN contact structures.
Journal of Electrical Engineering-Elektrotechnicky Casopis, 60(5):287–290, SEP-OCT 2009
2009. PT: J; CT: 15th International Conference on Applied Physics of Condesned Matter;
CY: JUN 24-26, 2009; CL: Bystra, SLOVAKIA; TC: 1; UT: WOS:000271846100010.
[13] International Centre for Diffraction Data, Powder Diffraction File, Card No. 04-003-0990.
[14] International Centre for Diffraction Data, Powder Diffraction File, Card No. 00-004-0802.
[15] R. J. Blattner, C. A. Evans, S. S. Lau, J. W. Mayer, and B. M. Ullrich. Effect of oxidiz-
ing ambients on platinum silicide formation .2. Auger and backscattering analyses. Jour-
nal of the Electrochemical Society, 122(12):1732–1736, 1975 1975. PT: J; TC: 47; UT:
WOS:A1975AX54300040.
24
VI. APPENDIX
A: Matlab code to generate surface plots
% Import excel data. Data sets must be converted to .xls using powDLL
x = xlsread('xls file'); % Data
angle = x(:, 1); % Extract angle from spreadsheet
temp = [25, 130:10:1000]; % Define temp range
% Configure data set
% Removes duplicate data and deletes empty columns
r = size(x, 1); % total rows
c = size(x, 2); % total columns
d = 2; % rows in each data set
n = 1; % remove first n columns in each data set
x(:, mod(1:c, d) <= n & mod(1:c, d) > 0) = [];
data = x;
figure(1)
surf(temp, angle, log(data), ...
'FaceColor', 'interp', ...
'EdgeColor', 'none', ...
'FaceLighting', 'gouraud');
% Add axis label
xlabel('Temperature (C)');
ylabel('2theta (deg)');
zlabel('ln(Intensity) (arb)');
% Set axis limits
25
ylim([20, 80]);
set(gca, 'YTick', 20:10:80);
xlim([130, 1000]);
set(gca, 'XTick', 150:200:1000);
% Set colormapping
colormap jet;
% Define viewpoint
az = 90;
el = -90;
view(az, el);
hold on;
h1 = plot([0, 1000], [29.09, 29.09], 'black', 'LineWidth', 1.5);
label(h1, '1', ...
'verticalalignment', 'bottom', ...
'horizontalalignment', 'center', ...
'fontsize', 14);
h4 = plot([0, 1000], [39.76, 39.76], 'black', 'LineWidth', 1.5);
label(h4, '4', ...
'verticalalignment', 'bottom', ...
'horizontalalignment', 'center', ...
'fontsize', 14);
h7 = plot([0, 1000], [50.87, 50.87], 'black', 'LineWidth', 1.5);
label(h7, '7', ...
'verticalalignment', 'bottom', ...
26
'horizontalalignment', 'center', ...
'fontsize', 14);
h2 = plot([0, 1000], [30.19, 30.19], 'black', 'LineWidth', 1.5);
label(h2, '2', ...
'verticalalignment', 'bottom', ...
'horizontalalignment', 'center', ...
'fontsize', 14);
h3 = plot([0, 1000], [32.07, 32.07], 'black', 'LineWidth', 1.5);
label(h3, '3', ...
'verticalalignment', 'bottom', ...
'horizontalalignment', 'center', ...
'fontsize', 14);
h5 = plot([0, 1000], [44.62, 44.62], 'black', 'LineWidth', 1.5);
label(h5, '5', ...
'verticalalignment', 'bottom', ...
'horizontalalignment', 'center', ...
'fontsize', 14);
h6 = plot([0, 1000], [46.24, 46.24], 'black', 'LineWidth', 1.5);
label(h6, '6', ...
'verticalalignment', 'bottom', ...
'horizontalalignment', 'center', ...
'fontsize', 14);
h8 = plot([0, 1000], [56.01, 56.01], 'black', 'LineWidth', 1.5);
label(h8, '8', ...
'verticalalignment', 'bottom', ...
27
'horizontalalignment', 'center', ...
'fontsize', 14);
h9 = plot([0, 1000], [61.5, 61.5], 'black', 'LineWidth', 1.5);
label(h9, '9', ...
'verticalalignment', 'bottom', ...
'horizontalalignment', 'center', ...
'fontsize', 14);
hold on
spec6 = plot([0, 1000], [35.6, 35.6], 'r');
stage7 = plot([0, 1000], [33, 33], '--r');
stage8 = plot([0, 1000], [25.6, 25.6], '--r');
stage9 = plot([0, 1000], [43.6, 43.6], '--r');
stage10 = plot([0, 1000], [45.7, 45.7], '--r');
stage11 = plot([0, 1000], [59.2, 59.2], '--r');
legend([h1, h2, h3, h4, h5, h6, h7, h8, h9, spec6, stage7], {'1: PtSi (101)', ...
'2: PtSi (200)', '3: PtSi (020)', '4: Pt (111)', ...
'5: PtSi (220)', '6: Pt (200)', '7: PtSi (002)', ...
'8: PtSi (112)', '9: PtSi(022)', ...
'Cu - Kbeta', 'Sample Stage'}, ...
'FontSize', 6, 'Position', [.8,.71,.08,.09]);
28
B: Considerations
Economic/Sustainability
Significant cost savings can be made by utilizing stable thin film electrodes and sensor
devices to optimize the servicing of equipment used in high temperature environments. Many
high temperature industrial environments (e.g. turbine engines, power plate boilers, oil
drilling) require regular monitoring in order to determine maintenance needs. By employing
sensors that are stable at high temperatures, industry participants can increase the lifetime
of expensive equipment and increase overall sustainability.
Environmental
By optimizing the maintenance of industrial machinery with wireless sensors, process effi-
ciency and overall energy consumption may be reduced. This could alter the environmental
impact of many industrial processes.
Manufacturability
The films used in this study were produced in The LASST, UHV, thin film deposition
chamber by graduate student Robert Fryer.
Ethical
Standard ethical practices were followed during research to ensure general safety and in
the reporting of the research findings.
Health and Safety
This project required certification in x-ray safety and general lab safety in order to operate
the laboratory equipment needed. Both certification required attending a safety training
course. A seminar in research ethics was also a required in order to receive NSF funding for
this project.
29

Mais conteúdo relacionado

Mais procurados

Synthesis and charaterization of la1 x srxmno3 perovskite nanoparticles
Synthesis and charaterization of  la1 x srxmno3 perovskite nanoparticlesSynthesis and charaterization of  la1 x srxmno3 perovskite nanoparticles
Synthesis and charaterization of la1 x srxmno3 perovskite nanoparticles
Mai Trần
 
Paper id 21201475
Paper id 21201475Paper id 21201475
Paper id 21201475
IJRAT
 
Fabrication and characterization of bismuth ferrite nanofiber by electrospinn...
Fabrication and characterization of bismuth ferrite nanofiber by electrospinn...Fabrication and characterization of bismuth ferrite nanofiber by electrospinn...
Fabrication and characterization of bismuth ferrite nanofiber by electrospinn...
Abthul Hakkeem
 
Self-Assembly of Two-Dimensional Multi-Component Colloidal Lattices at Liqu...
Self-Assembly of Two-Dimensional Multi-Component Colloidal Lattices at Liqu...Self-Assembly of Two-Dimensional Multi-Component Colloidal Lattices at Liqu...
Self-Assembly of Two-Dimensional Multi-Component Colloidal Lattices at Liqu...
huanma
 

Mais procurados (20)

Synthesis and charaterization of la1 x srxmno3 perovskite nanoparticles
Synthesis and charaterization of  la1 x srxmno3 perovskite nanoparticlesSynthesis and charaterization of  la1 x srxmno3 perovskite nanoparticles
Synthesis and charaterization of la1 x srxmno3 perovskite nanoparticles
 
Advanced Characterization of Materials: Relevance and Challenges.
Advanced Characterization of Materials: Relevance and Challenges.Advanced Characterization of Materials: Relevance and Challenges.
Advanced Characterization of Materials: Relevance and Challenges.
 
Paper id 21201475
Paper id 21201475Paper id 21201475
Paper id 21201475
 
Gel Growth and Characterization of New PbHNSO3 Crystals
Gel Growth and Characterization of New PbHNSO3 CrystalsGel Growth and Characterization of New PbHNSO3 Crystals
Gel Growth and Characterization of New PbHNSO3 Crystals
 
Combinatorial approach to materials discovery.
Combinatorial approach to materials discovery.Combinatorial approach to materials discovery.
Combinatorial approach to materials discovery.
 
Optical Properties of Nanostructured Cerium Oxide Thin Films by Pulsed Laser ...
Optical Properties of Nanostructured Cerium Oxide Thin Films by Pulsed Laser ...Optical Properties of Nanostructured Cerium Oxide Thin Films by Pulsed Laser ...
Optical Properties of Nanostructured Cerium Oxide Thin Films by Pulsed Laser ...
 
Luminescent materials for biomedical applications: the example of nanothermom...
Luminescent materials for biomedical applications: the example of nanothermom...Luminescent materials for biomedical applications: the example of nanothermom...
Luminescent materials for biomedical applications: the example of nanothermom...
 
Fabrication and characterization of bismuth ferrite nanofiber by electrospinn...
Fabrication and characterization of bismuth ferrite nanofiber by electrospinn...Fabrication and characterization of bismuth ferrite nanofiber by electrospinn...
Fabrication and characterization of bismuth ferrite nanofiber by electrospinn...
 
Friction Force and its Relationship to the Electrostatic Charges at Interfaces.
Friction Force and its Relationship to the Electrostatic Charges at Interfaces.Friction Force and its Relationship to the Electrostatic Charges at Interfaces.
Friction Force and its Relationship to the Electrostatic Charges at Interfaces.
 
906882
906882906882
906882
 
Structure and band gap energies of nano titanium dioxide doped with the fifth...
Structure and band gap energies of nano titanium dioxide doped with the fifth...Structure and band gap energies of nano titanium dioxide doped with the fifth...
Structure and band gap energies of nano titanium dioxide doped with the fifth...
 
1426777
14267771426777
1426777
 
Microsoft power point dlsu solid state physics laboratory list of researche...
Microsoft power point   dlsu solid state physics laboratory list of researche...Microsoft power point   dlsu solid state physics laboratory list of researche...
Microsoft power point dlsu solid state physics laboratory list of researche...
 
Self-Assembly of Two-Dimensional Multi-Component Colloidal Lattices at Liqu...
Self-Assembly of Two-Dimensional Multi-Component Colloidal Lattices at Liqu...Self-Assembly of Two-Dimensional Multi-Component Colloidal Lattices at Liqu...
Self-Assembly of Two-Dimensional Multi-Component Colloidal Lattices at Liqu...
 
Di36654660
Di36654660Di36654660
Di36654660
 
Sia.6888
Sia.6888Sia.6888
Sia.6888
 
Capitalizing multiferroic properties of BiFeO3 for spintronics
Capitalizing multiferroic properties of BiFeO3 for spintronicsCapitalizing multiferroic properties of BiFeO3 for spintronics
Capitalizing multiferroic properties of BiFeO3 for spintronics
 
Role of Atomic-Scale Modeling in Materials Design Discovery.
Role of Atomic-Scale Modeling in Materials Design Discovery.Role of Atomic-Scale Modeling in Materials Design Discovery.
Role of Atomic-Scale Modeling in Materials Design Discovery.
 
Final_version_expo_2014
Final_version_expo_2014Final_version_expo_2014
Final_version_expo_2014
 
X – Ray Diffraction
X – Ray DiffractionX – Ray Diffraction
X – Ray Diffraction
 

Destaque

Healing hands care coordination - final, web-ready
Healing hands   care coordination - final, web-readyHealing hands   care coordination - final, web-ready
Healing hands care coordination - final, web-ready
skrentz
 
Magazine cover analysis1
Magazine cover analysis1Magazine cover analysis1
Magazine cover analysis1
heatherjanew
 

Destaque (12)

Libro y metodologia
Libro y metodologiaLibro y metodologia
Libro y metodologia
 
Bohyun Han : My Design for Theatre World
Bohyun Han : My Design for Theatre World Bohyun Han : My Design for Theatre World
Bohyun Han : My Design for Theatre World
 
EFL
EFLEFL
EFL
 
Healing hands care coordination - final, web-ready
Healing hands   care coordination - final, web-readyHealing hands   care coordination - final, web-ready
Healing hands care coordination - final, web-ready
 
Traumagram summer 2016
Traumagram summer 2016Traumagram summer 2016
Traumagram summer 2016
 
June 2016 IEP
June 2016 IEPJune 2016 IEP
June 2016 IEP
 
Magazine cover analysis1
Magazine cover analysis1Magazine cover analysis1
Magazine cover analysis1
 
Planning plj 1r
Planning plj 1rPlanning plj 1r
Planning plj 1r
 
Libros de texto 2016/2017
Libros de texto 2016/2017Libros de texto 2016/2017
Libros de texto 2016/2017
 
Nascita e sviluppo dell'area limitrofa a Venezia
Nascita e sviluppo dell'area limitrofa a VeneziaNascita e sviluppo dell'area limitrofa a Venezia
Nascita e sviluppo dell'area limitrofa a Venezia
 
Letrilandia 2
Letrilandia 2 Letrilandia 2
Letrilandia 2
 
Atgriezeniskā saite stundas beigās
Atgriezeniskā saite stundas beigāsAtgriezeniskā saite stundas beigās
Atgriezeniskā saite stundas beigās
 

Semelhante a paper

photoluminesen
photoluminesenphotoluminesen
photoluminesen
ausefi
 
Synthesis Of Nanostructured TiO2 Thin Films By Pulsed Laser Deposition (PLD) ...
Synthesis Of Nanostructured TiO2 Thin Films By Pulsed Laser Deposition (PLD) ...Synthesis Of Nanostructured TiO2 Thin Films By Pulsed Laser Deposition (PLD) ...
Synthesis Of Nanostructured TiO2 Thin Films By Pulsed Laser Deposition (PLD) ...
sarmad
 
Ultra smooth and lattice relaxed zn o thin films [eid]
Ultra smooth and lattice relaxed zn o thin films [eid]Ultra smooth and lattice relaxed zn o thin films [eid]
Ultra smooth and lattice relaxed zn o thin films [eid]
Eid Elsayed
 
High Resolution X-ray Spectroscopy using Iridium-Gold Phase Transition
High Resolution X-ray Spectroscopy using Iridium-Gold Phase TransitionHigh Resolution X-ray Spectroscopy using Iridium-Gold Phase Transition
High Resolution X-ray Spectroscopy using Iridium-Gold Phase Transition
Stefan Pfnuer
 
Vapor Deposition of Semiconducting Phosphorus Allotropes into TiO2 Nanotube A...
Vapor Deposition of Semiconducting Phosphorus Allotropes into TiO2 Nanotube A...Vapor Deposition of Semiconducting Phosphorus Allotropes into TiO2 Nanotube A...
Vapor Deposition of Semiconducting Phosphorus Allotropes into TiO2 Nanotube A...
Pawan Kumar
 
Potential enhancement of thermoelectric energy conversion in cobaltite superl...
Potential enhancement of thermoelectric energy conversion in cobaltite superl...Potential enhancement of thermoelectric energy conversion in cobaltite superl...
Potential enhancement of thermoelectric energy conversion in cobaltite superl...
Anastasios Englezos
 
project report final
project report finalproject report final
project report final
Chris Wilshaw
 

Semelhante a paper (20)

Annealing and Microstructural Characterization of Tin-Oxide Based Thick Film ...
Annealing and Microstructural Characterization of Tin-Oxide Based Thick Film ...Annealing and Microstructural Characterization of Tin-Oxide Based Thick Film ...
Annealing and Microstructural Characterization of Tin-Oxide Based Thick Film ...
 
Non-parabolicity and band gap renormalisation in Si doped ZnO
Non-parabolicity and band gap renormalisation in Si doped ZnONon-parabolicity and band gap renormalisation in Si doped ZnO
Non-parabolicity and band gap renormalisation in Si doped ZnO
 
photoluminesen
photoluminesenphotoluminesen
photoluminesen
 
Optical properties of semiconducting pyrite deposited by aerosol
Optical properties of semiconducting pyrite deposited by aerosolOptical properties of semiconducting pyrite deposited by aerosol
Optical properties of semiconducting pyrite deposited by aerosol
 
Influence of Thickness on Electrical and Structural Properties of Zinc Oxide ...
Influence of Thickness on Electrical and Structural Properties of Zinc Oxide ...Influence of Thickness on Electrical and Structural Properties of Zinc Oxide ...
Influence of Thickness on Electrical and Structural Properties of Zinc Oxide ...
 
Studies on in-Doped Zno Transparent Conducting thin Films
Studies on in-Doped Zno Transparent Conducting thin FilmsStudies on in-Doped Zno Transparent Conducting thin Films
Studies on in-Doped Zno Transparent Conducting thin Films
 
Synthesis Of Nanostructured TiO2 Thin Films By Pulsed Laser Deposition (PLD) ...
Synthesis Of Nanostructured TiO2 Thin Films By Pulsed Laser Deposition (PLD) ...Synthesis Of Nanostructured TiO2 Thin Films By Pulsed Laser Deposition (PLD) ...
Synthesis Of Nanostructured TiO2 Thin Films By Pulsed Laser Deposition (PLD) ...
 
Ultra smooth and lattice relaxed zn o thin films [eid]
Ultra smooth and lattice relaxed zn o thin films [eid]Ultra smooth and lattice relaxed zn o thin films [eid]
Ultra smooth and lattice relaxed zn o thin films [eid]
 
Evaluation of piezoresistivity properties of sputtered ZnO thin films
Evaluation of piezoresistivity properties of sputtered ZnO thin filmsEvaluation of piezoresistivity properties of sputtered ZnO thin films
Evaluation of piezoresistivity properties of sputtered ZnO thin films
 
Heterogeneous Combustion Wave as an X-Ray Source
Heterogeneous Combustion Wave as an X-Ray SourceHeterogeneous Combustion Wave as an X-Ray Source
Heterogeneous Combustion Wave as an X-Ray Source
 
International Refereed Journal of Engineering and Science (IRJES)
International Refereed Journal of Engineering and Science (IRJES)International Refereed Journal of Engineering and Science (IRJES)
International Refereed Journal of Engineering and Science (IRJES)
 
STM Observation of the Si(111) - (7×7) Reconstructed Surface Modified by Exce...
STM Observation of the Si(111) - (7×7) Reconstructed Surface Modified by Exce...STM Observation of the Si(111) - (7×7) Reconstructed Surface Modified by Exce...
STM Observation of the Si(111) - (7×7) Reconstructed Surface Modified by Exce...
 
High Resolution X-ray Spectroscopy using Iridium-Gold Phase Transition
High Resolution X-ray Spectroscopy using Iridium-Gold Phase TransitionHigh Resolution X-ray Spectroscopy using Iridium-Gold Phase Transition
High Resolution X-ray Spectroscopy using Iridium-Gold Phase Transition
 
Vapor Deposition of Semiconducting Phosphorus Allotropes into TiO2 Nanotube A...
Vapor Deposition of Semiconducting Phosphorus Allotropes into TiO2 Nanotube A...Vapor Deposition of Semiconducting Phosphorus Allotropes into TiO2 Nanotube A...
Vapor Deposition of Semiconducting Phosphorus Allotropes into TiO2 Nanotube A...
 
Structural, Dielectric and Optical properties of Sputtered TiO2 nano-films
Structural, Dielectric and Optical properties of Sputtered TiO2 nano-filmsStructural, Dielectric and Optical properties of Sputtered TiO2 nano-films
Structural, Dielectric and Optical properties of Sputtered TiO2 nano-films
 
Potential enhancement of thermoelectric energy conversion in cobaltite superl...
Potential enhancement of thermoelectric energy conversion in cobaltite superl...Potential enhancement of thermoelectric energy conversion in cobaltite superl...
Potential enhancement of thermoelectric energy conversion in cobaltite superl...
 
Thermoelectricity
ThermoelectricityThermoelectricity
Thermoelectricity
 
Do25681686
Do25681686Do25681686
Do25681686
 
project report final
project report finalproject report final
project report final
 
FirstPaper_June2015
FirstPaper_June2015FirstPaper_June2015
FirstPaper_June2015
 

paper

  • 1. In Situ X-Ray Diffraction: Growth and Stability of Platinum Silicide Films at High Temperature Timothy Blier Advisor: Dr. Robert Lad Department of Physics and Astronomy, University of Maine, Orono, Maine 04469 USA (Dated: May 9, 2016) Abstract In situ x-ray diffraction (XRD) was performed at high temperatures (up to 1000°C) on 100 nm thick Pt films deposited on Si(100) substrates in order to observe the kinetics of PtSi phase formation via solid - solid reaction at the Pt - Si interface. The in situ XRD measurements were facilitated by subjecting the as-deposited Pt/Si(100) films to high temperature environments. This was accomplished by using an Anton Paar 1100 Domed Hot stage (DHS) instrumented to a PAN- alytical X’Pert Pro XRD system. The PtSi films were also exposed to a 1000°C environment for approximately 10 hours, and the structural changes were observed via in situ XRD. The results indicate the formation of various crystallographic orientations of a PtSi phase without any evidence for Pt2Si phase formation. During vacuum anneal, the consumption of Pt, indicated by the de- crease in area of the Pt(111) diffraction peak at 39.76°, begins at approximately 125°C and reaches completion at approximately 300°C. PtSi phase formation is observed to begin at approximately 225°C and halts at approximately 300°C. Annealing in air results in a Pt(111) diffraction peak coexisting with the silicide (PtSi) peaks indicating that the Pt(111) oriented grain did not com- pletely react to form the PtSi phase. The only silicide peaks that persisted during heat treatments were PtSi(101) and PtSi(002). These observations suggest that an amorphous SiO2 diffusion bar- rier may have formed at the Pt - Si interface to impede the diffusion of Pt when annealed in air, whereas, the lack of a SiO2 phase formation during vacuum annealing allowed the PtSi reaction to reach completion. 1
  • 2. Contents I. Introduction 3 II. Experimental 4 A. Overview of X - Ray Diffraction 4 B. Methods 5 C. Film Preparation 8 III. Results and Discussion 9 A. Thermal Expansion of Pt Film 9 B. In Situ Measurements of Platinum Silicide Formation During Annealing from 25°C to 1000°C in Vacuum 11 C. In Situ Measurements of Platinum Silicide Formation During Annealing from 25°C to 1000°C in air 16 IV. Conclusions 20 V. Suggestions for Further Research 21 Acknowledgments 22 References 23 VI. Appendix 25 2
  • 3. I. INTRODUCTION Pt - silicide thin films are widely used in silicon integrated circuit technologies and play an important role in many microelectronic device applications. Silicides of Pt, and other transition metals, including Pd, Ti, and Ni, are widely favorable due to their thermal sta- bility, chemical inertness, high thermal and electrical conductivity, and high hardness [1, 2]. A major application for transition metal silicide films includes complementary metal-oxide- semiconductor (CMOS) devices, where they act as Ohmic contacts between metal intercon- nects and source, gate, and drain transistors [3]. Platinum silicide (PtSi) films have found an important role as either Ohmic contacts or Schottky barrier contacts in large scale integrated circuits and infrared detectors [4]. PtSi is an ideal candidate for many microelectronics applications due to its low Schottky barrier to p-type Si of about 0.3 eV [5], and its high thermal stability up to 160°C [6]. It has also been shown that PtSi allows for the formation of silicide/Si contacts with specific contact resitivity as low as 0.1 ohms/mm2 which is interesting for p-type MOSFETs [7] as well as several other microelectronic sensors and devices [8–10]. For n-type semicondictors, PtSi shows a high Schottky barrier and has the potential to be used on devices such as Schottky barrier MOSFETs [11], or power MOSFETs [12]. This paper reports on results of experiments observing the formation of Pt - silicide films, in particular PtSi, via solid - solid reaction. The objective of this work is to examine the kinetics of PtSi formation and stability of the PtSi phase in high temperature environments. This project required learning how to operate a PANalytical X’Pert Pro XRD system and an Anton Paar 1100 Domed Hot Stage (DHS), as well as developing the methodology to measure and analyze XRD data in situ up to 1000°C. As a means to gain familiarity with the XRD system and data analysis, several types of thin film samples were analyzed, including Pt-ZrO2 and Pt-Al2O3 architectures; these data are not reported in this paper. The main focus of this paper is Pt - Si films and the rate of PtSi phase formation in high tempera- ture environments. In the PtSi system, changes in the film structure and morphology are important to understand in order create films that remain electrically conductive after high temperature treatments. This study was performed using facilities within the Laboratory for Surface Science and Technology (LASST), and under the support of NSF grant, DMR - 1309983: SusChEM: 3
  • 4. ”Ceramic Based Nanocomposite Films and Sensors for Life Cycle Monitoring of Materials in High Temperature Harsh Environments”. Other researchers funded by this grant are de- veloping nanocomposite, multi-layer thin film structures that remain architecturally stable in high temperature harsh environments. The usefulness of Pt - silicide films notwithstanding, these films are often plagued by agglomeration effects within high temperature environ- ments. These effects destroy the electrical conductivity of the films rendering them useless in microelectronic devices. Solving this agglomeration problem will enable the use of reliable sensor devices to monitor the life cycle of machinery in high temperature environments asso- ciated with industry: turbine engines, petrochemical processing plants, combustion burners, power plant boilers, oil/gas drilling as well as metals smelting and refining. Many of these industrial processes rely on large, sophisticated pieces of machinery that require regular maintenance in order to evaluate the condition of internal components. This maintenance results in high costs due to its inefficient nature. Cost savings can be achieved by optimiz- ing the maintenance of machinery by utilizing miniature sensors within these environments. However, in order to achieve a stable sensor, the thin film materials used must remain stable in order to maintain normal operation even within harsh environments. This paper focuses specifically on Pt - silicide films as a candidate thin film material in this regard. II. EXPERIMENTAL A. Overview of X - Ray Diffraction Diffraction was the phenomenon that first brought the wave nature of matter and light into the view of scientists. In 1914, it was discovered that diffraction had another, very useful application. Max von Laue discovered that a crystalline structure with a periodic arrangement of atoms acts as a 3-dimensional diffraction grating. W.H. Bragg then expanded this theory in 1915 to analyze the atomic structure of crystalline materials using XRD. The rules developed by Bragg (Bragg’s law) allow for the examination of the distance between atoms in a crystalline material to a precision of ±0.001 ˚A. 4
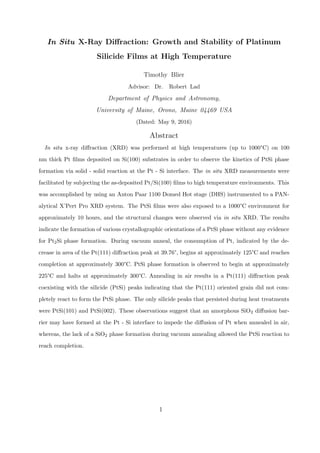
  • 5. FIG. 1: Incident x-rays being scattered from atomic planes. Intensity of scattered x-rays is maximum when the extra path-length traveled by adjacent scattered x-rays is equal to 2dsin(θ) X - ray diffraction is a powerful and non - destructive technique that allows for the precise structural characterization of crystalline materials. When an x-ray beam is incident on a crystal plane of an atomic lattice, a portion of the beam will be scattered by the atoms and a portion will be scattered by an adjacent, parallel crystalline plane(Fig. 1). The scattered wave fronts created by the adjacent crystalline planes will have a phase lag because the scattered x - rays must travel an additional path length 2dsin(θ), where d is the atomic spacing. If this difference in path length is an integer number of wavelengths of the incident light, then constructive interference occurs and the intensity of the scattered x - rays is maximum. This analysis results in the well-known Bragg’s law (1) for diffraction from an atomic lattice. X - ray diffraction has many useful application. Within the realm of thin films x - ray diffraction can be used for phase identification, stress and strain analysis, film quality and dislocation density, measuring roughness and thickness, as well as determining film quality and grain orientation. λ = 2dhklsin(θ) (1) B. Methods Characterization of thin film crystalline structures during annealing in air and vacuum up to 1000°C was performed in situ using an Anton Paar 1100 Domed Hot Stage (DHS) mounted to a PANalytical X’Pert Pro XRD system. A schematic diagram of the geometry 5
  • 6. used for XRD scans is shown in Fig 2. Incident optics included a Cu - Kα radiation source, 1/2° divergent slit and parabolic x - ray mirror. Receiving optics included a 0.18 parallel plate collimator, 0.02 soller slit and a proportional Xe detector. These optics were chosen to make the incident and receiving x - rays beams as parallel as possible; this eliminates variances in XRD spectra due to changes in sample thickness and changes in the XRD alignment at high temperatures caused by thermal expansion. The application of these optics inside the PANalytical X’Pert Pro XRD is shown in Fig. 3. FIG. 2: Parallel beam geometry of the x-ray diffraction experiment showing the x-ray source, incident beam optics, sample, diffracted beam optics, and detector. FIG. 3: Image showing the inside of the PANalytical X’Pert Pro XRD system. Incident optics are to the far right, sample stage and goniometer are center-most, and the diffracted, or receiving optics are to the far left. 6
  • 7. Samples were mounted on the DHS (Fig. 4a) which was attached to a PANalytical X’Pert Pro XRD system (Fig. 4b). This novel sample heating stage includes an AlN heater that can reach 1100°C, inconel sample clips to hold the thin film sample, and a carbon dome which acts to contain the heat to a small volume while remaining x - ray transparent (although x - rays enter and exit through the dome, there is only a slight attenuation of the x - ray beam). The dome also allows for the sample to be subjected to pressures ranging from atmosphere to 10−4 Torr. (a) 1100 Anton Paar Domed Hot Stage: (1) Carbon, x-ray transparent dome (2) AlN heater stage (3) Inconel sample clips (4) con- nection for ingas/vacuum and temperature control (b) PANalytical X’Pert Pro XRD system lo- cated in the Laboratory for Surface Science and Technology at the University of Maine FIG. 4: Annealing of the Pt/Si(100) film samples was carried out in either atmospheric pressuer (760 Torr) or 10−4 Torr. XRD spectra were continuously recorded using Bragg - Brentano 7
  • 8. geometry(Fig. 5). For experiments conducted in this study, samples underwent two types of heat treatment: increasing temperature steps and isothermal holds. After an initial room temperature (25°C) scan, the sample temperature was increased to 130°C and then increased in 10°C steps thereafter. During each step, the temperature was held constant while an XRD spectrum was recorded. Isothermal treatments were conducted at 1000°C with XRD spectra being acquired approximately every 10 minutes. Due to time constraints, only the air annealed sample was allowed to dwell at 1000°C. FIG. 5: Angle of incidence(ω) is between the x-ray source and the sample. The diffracted beam angle(2θ) is between the incident beam and the detector. Using this geometry the source remains fixed while the sample rotates by the angle θ and the detector rotates by the angle 2θ C. Film Preparation A 100 nm thick Platinum thin film was grown on an n-type Si(100) wafer using DC sputtering in the LASST clean room by graduate student Robert Fryer. Si(100) wafer was treated by buffered-oxide-etch in order to obtain a clean, oxide free Si surface prior to Pt deposition. Sputter deposition of the Pt film was conducted using 300 W power, 3 mTorr of Ar gas and a 99.999% pure platinum target. Following deposition, the Pt/Si sample was cut into a size of approximately 5mmx20mm; these sample dimensions eliminated interference by the sample stage during XRD characterization. 8
  • 9. III. RESULTS AND DISCUSSION A. Thermal Expansion of Pt Film In situ XRD is an ideal tool for measuring thermal expansion of materials because 2θ peak position can be directly correlated to crystal lattice spacing, which allows for the examination of the response of materials to an increase in temperature. When a material is heated, the energy of the crystal lattice increases which results in increased vibrational motion of the atoms and a larger than average bond distance due to anharmonic motion. For isotropic materials, 1-D or linear expansion can be assumed. The average displace- ment of the atoms in a crystal lattice can be examined using the Boltzmann distribution(2). x = +∞ −∞ xe−(U(x)/kT) +∞ −∞ e−(U(x)/kT) dx (2) For temperatures below the melting point of a material, thermal expansion can be considered to be linear with temperature. The potential energy of the of atoms displaced from equilibrium can be expressed as: U(x) = cx2 − gx3 − fx4 (3) Using this potential energy, equation 2 becomes: x ∼= 3g 4c2 kT (4) Therefore, the average displacement of atoms in a crystal lattice increases with temperature. This linear expansion can be expressed as the fractional change in length: 9
  • 10. ∆L L0 = α∆T (5) where the fractional change in length is determined by the 2θ peak position in Bragg’s law for constructive interference. The experiments to determine the thermal expansion of a Pt thin film were used as a learning tool. These experiments were conducted in order to gain experience operating the XRD system, properly aligning a sample, using the data collection software, and using the DHS. Figure 6 shows the results of in situ XRD experiments examining the response of a Pt (111) peak to annealing. The peak shows a shift in position to a lower angle as temperature is increased. This shift to a smaller angle correlates to an increasing atomic spacing within the crystal lattice due to inverse nature of peak position (2θ) and atomic spacing predicted by Bragg’s law. FIG. 6: In situ thermal expansion of a Pt thin film deposited on a sapphire substrate. Shown is a planar view of intensity as a function of both temperature and 2θ degrees. Relative intensity is indicated by color Figure 7 displays the fractional change in length determined from the results shown in 10
  • 11. Figure 6 as a function of temperature. From the linear fit of the data, a coefficient of linear expansion for the Pt film is determined to be 1.01 × 10⁻⁵ C−1 . The accepted bulk value for the coefficient of linear expansion of Pt is 9 × 10⁻⁶ C−1 . The cause for the discrepancy between the calculated value and the accepted value for the coefficient of linear expansion is most likely due to differences in bond distances near the surface of the Pt film and within the thin film as compared to the bond distance in bulk, 3-dimensional materials. FIG. 7: Fractional change in length of a Pt thin film as a function of temperature. The linear coefficient of thermal expansion, as determined by the slope of the fit, is 1.01 × 10⁻⁵ B. In Situ Measurements of Platinum Silicide Formation During Annealing from 25°C to 1000°C in Vacuum In order to observe the formation of a PtSi phase due to solid - solid reaction of the Pt/Si(100) sample, in situ XRD measurements were taken during heat treatment in vac- uum (10−4 Torr). Figure 8 displays three XRD spectra at different times during the heat treatment by steps: room temperature before annealing, at 1000°C, and room temperature after annealing. At 1000°C it is observed that Pt, present before annealing, has been con- sumed and two silicide grain orientations, PtSi(101) and PtSi(002), have formed. There are several diffraction peaks (identified by *) present in the 1000°C and after annealing spectra, that are not present in the as - deposited spectrum. These extra peaks are artifacts due to the sample shifting during measurement resulting in additional diffraction peaks from the 11
  • 12. sample stage. The sample shift on the stage occurred at approximately 870°C. Irregard- less, the PtSi peaks are well defined and Figure 8 shows the Pt phase being almost entirely consumed from the solid - solid reaction. FIG. 8: XRD spectra from the Pt/Si(100) sample at (a) room temperature, (b) at 1000°C, and (c) at room temperature after annealing. Peaks that are starred are due to diffraction from the AlN sample heater. The AlN heater peaks are only present in (b) and (c) since, in these cases, the sample shifted on the heater stage at about 870°C Fig. 9 shows a detailed, 3-D, in situ map of the Pt - Si film during heat treatment in vacuum(10−4 Torr). This color scale represents the natural log of the peak intensity as a function of 2θ and temperature using a Matlab script (see Appendix: A). Figure 10 shows a planar view of the same data with the intensity plotted as contour lines, and labels are displayed for various points of interest in the data: the black lines represent PtxSiy compounds while the dotted and solid red lines represent artifacts due to the AlN sample stage and Cu - Kβ peaks. At approximately 240°C, a polycrystalline PtSi phase is observed to form resulting in the consumption of Pt. Comparing these peak positions to those in the powder diffraction database [13, 14] gives evidence to the poly-crystalline layer being composed of PtSi(101), PtSi(200), PtSi(220), Pt(200), PtSi(002), PtSi(112), and PtSi(022) grain orientations. Higher temperatures result in the disappearance of all PtSi peaks except 12
  • 13. PtSi(101) and PtSi(002) indicating that these grain continued to grow at the expense of the other grain orientations. PtSi(002), as well as Pt (111) and PtSi(101) above 750°C, shows a steady increase in peak intensity. This is most likely an indication of recrystallization or grain growth. PtSi(002) shows a decrease in intensity between about 350°C and 700°C with a steady increase in intensity thereafter. The initial decrease may be a result of the attenuation of the scattered x -rays due to increased thermal motion of the atomic lattice which is then compensated by subsequent recrystallization or grain growth. FIG. 9: In situ XRD map of Pt thin film on Si(100) during annealing in vacuum. Shown is the intensity of diffraction peaks as a function of temperature and 2θ degrees . 13
  • 14. FIG. 10: Planar view of in situ XRD map for Pt thin film on Si(100) from 25°C to 1000°C. Peak intensities are represented by a color scale. Fig. 11 displays the peak areas of the PtSi(101), PtSi(002), and Pt(111) peaks normalized to the maximum value of the Pt(111) peak. The left y-axis represents a scale for the PtSi(101) and PtSi(002) peaks while the right y-axis represents a scale for the Pt(111) peak. Figure 12 shows the same results as Figure 11 but with a magnified y-axis scale in order to show more detail in the Pt(111) and PtSi(101) area data at higher temperatures. An interesting result shown from Figure 12 is that the Pt is not completely consumed. A very small diffraction peak for Pt(111) persists throughout the treatment after the solid - solid reaction and silicide formation as observed in Fig. 11. This could be explained by the presence of a large Pt droplet on the surface. This droplet would have formed during the DC sputtering film deposition process, which could not be completely react to form a PtSi phase. 14
  • 15. FIG. 11: Normalized area of the PtSi(101), Pt(111), and PtSi(002) peaks during annealing in vacuum. Peak area was normalized to the Pt(111) peak. From Figure 11, the initial silicide formation is observed at approximately 240°C while the consumption of Pt begins at approximately 125°C. A cause for the discrepancy in the temperatures of PtSi formation and Pt consumption is likely due to the initial PtSi grain size being too small to be distinguishable from the background noise. At 850°C, the normalized area of PtSi(101) is observed to increase and the normalized area of PtSi(002) is observed to decrease. This may be an indication of grain growth of PtSi(101). However, this may also be the result of the sample shifting on the sample stage. Thus, no conclusion should be drawn from the observed data above 850°C. 15
  • 16. FIG. 12: Normalized area of of Pt(111) and PtSi(101) peaks. This is the same data presented in Fig. 10 but with a magnified scale in order to show more detail. C. In Situ Measurements of Platinum Silicide Formation During Annealing from 25°C to 1000°C in air The Pt/Si(100) solid state reaction was repeated in air. Figure 13 shows three XRD spectra: an initial room temperature measurement, a 1000°C measurement, and a room temperature measurement after annealing. Observed is a strong Pt(111) peak present before annealing. The in situ measurement at 1000°C shows a Pt(111) peak that has increased in intensity and that coexists with PtSi(101) and PtSi(002) peaks. These results indicate some Pt - silicide formation. The persistent Pt(111) peak was unexpected, however. It was expected that the Pt(111) peak would be fully consumed during the Pt - Si reaction, as it was during vacuum treatments. 16
  • 17. FIG. 13: XRD spectra of Pt thin film on Si(100) substrate during three steps of heat treatment in air. Shown are XRD spectra at (a) room temperature before annealing, (b) at 1000°C, and (c) at room temperature after annealing. Figure 14 shows the more detailed, 3-D in situ XRD map during annealing by steps. The natural log of the intensity obtained via XRD is plotted as a function of both 2θ position and temperature. Figure 15 shows a planar view of the same data with intensity plotted as contour lines (a) as well as data obtained during isothermal treatment at 1000°C (b) and displays labels for various points of interests in the data: the black lines represent PtxSiy compounds while the dotted and solid red lines represent artifacts due to the AlN sample stage and Cu - Kβ peaks. From Figures 14 and 15, the decrease in peak intensity is evidence for the consumption of Pt, and silicide formation is observed at approximately 330°C. At this temperature, the results indicate formation of a poly-crystalline layer as was the case for heat treatment in vacuum. At higher temperatures, it is observed that PtSi(101) and PtSi(002) experience grain growth as indicated by the increase in their respective peak intensities and decrease in the intensities of all other peaks besides that of Pt(111). From Fig. 15 it is observed that the PtSi(101), Pt(111), and PtSi(002) peaks endure through both increasing temperature steps and isothermal heat treatments. During temperature ramping, the PtSi(002) peak shows a 17
  • 18. steady increase in intensity and the PtSi(101) peak shows a decrease in intensity between 550°C and 750°C with a steady increase thereafter. No major structural or morphological changes were observed during the isothermal treatment. FIG. 14: In situ XRD map of Pt thin film on Si(100) during annealing in air. Shown is the intensity of diffraction peaks as a function of temperature and 2θ degrees A key feature of both Figures 14 and 15 is that the Pt(111) peak at 39.76° 2θ endures both the heat treatments. It has been shown that during annealing, Pt will be completely consumed when treated in this way in vacuum or nitrogen environments. However, only slight consumption of Pt is observed at approximately 330°C, as indicated by the silicide formation and decrease in the Pt(111) peak intensity. Because the silicide formation is facilitated via the simultaneous diffusion of Pt into the Si substrate and vice versa, a likely 18
  • 19. cause of a sustained Pt phase is the presence of a diffusion barrier. It has been reported [15] that SiO2 forms when Pt - Si films are annealed in air and the amorphous SiO2 phase is believed to act as a diffusion barrier. The amorphous Si02 layer does not give an XRD signal but may be a likely cause of the persistent Pt(111) peak. FIG. 15: (a) In situ XRD maps in air of a Pt thin film on Si(100) after the heat treatment by steps from 25°C to 1000°C in air, and (b) during the isothermal heat treatment at 1000°C. Peak intensity is represented by the color scale. Fig. 16 displays the peak areas of the PtSi(101), PtSi(002), and Pt(111) normalized to the maximum value of the Pt(111) peak. The left y-axis represents a scale for the PtSi(101) and PtSi(002) peaks, while the right y-axis represents a scale for the Pt(111) peak. Initial silicide formation and Pt consumption is observed at approximately 320°C. Silicide formation and consumption of Pt is observed to halt at approximately 330°C. Unlike annealing in vacuum, there is no apparent lag between the temperature of initial Pt consumption and that of 19
  • 20. the initial PtSi phase formation. The normalized area of the PtSi(002) peak is shown to increase throughout the treatment, suggesting recrystallization, while the normalized area of the PtSi(101) peak is shown to remain relatively unchanged after the initial formation. The Pt(111) peak is observed to increase in area between 650°C and 750°C and is observed to decrease in area thereafter. FIG. 16: Normalized areas of the PtSi(101), Pt(111), and PtSi(002) peaks during annealing in air. Peak areas are normalized to the Pt(111) peak. IV. CONCLUSIONS Solid state reaction was successfully used to form a PtSi phase from an as-deposited 100 nm thick Pt film on a clean Si(100) substrate in vacuum and atmospheric conditions. In situ XRD at high temperatures reveals that vacuum annealing results in the complete consump- tion of platinum to form a poly-crystalline PtSi layer composed of PtSi(101), PtSi(002), PtSi(200), PtSi(220), PtSi(112), and PtSi(022) grains at approximately 240°C; PtSi(101) and PtSi(002) are the preferred orientation that remain after final heat treatments. An- nealing in air resulted in the solid state reaction of Pt/Si(100) to the PtSi phase being interrupted by the formation of an amorphous SiO2 layer that acts as a diffusion barrier. The same PtSi poly-crystalline layer forms as in vacuum, but the reaction goes to comple- tion at approximately 330°C with PtSi(101) and PtSi(002) being the preferred orientations. Extended annealing at 1000°C for 10 hours resulted in no morphological change in the PtSi film. A large portion of this work was dedicated to developing a technique to acquire in situ XRD spectra at high temperatures using an Anton Paar 1100 DHS and PANalytical X’Pert Pro XRD system. This was accomplished by developing a procedure to properly operate the DHS, select x-ray optics to acquire meaningful and accurate data, as well as developing Matlab tools for data analysis and visualization, and formatting the report in Latex; this work was my first introduction to Matlab and Latex. The major conclusion can be summarized as follows: • Successfully developed and implemented technique to acquire in situ XRD spectra up 20
  • 21. to 1000°C using a 1100 Anton Paar Domed Hot Stage and PANalytical X’Pert Pro XRD system 1. Procedure for operation of DHS 2. Optics to acquire accurate date 3. Matlab tools for data analysis and visualization • Under vacuum conditions Pt/Si(100) undergoes solid state reaction to form a PtSi phase 1. PtSi(101), PtSi(200), PtSi(020), PtSi(220), PtSi(002), PtSi(112), and PtSi(022) initially form a polycrystalline layer at approximately 240°C. 2. PtSi(101) and PtSi(002) are the preferred orientations that develop during heat treatment. 3. Trace amounts of Pt(111) persist throughout the heat treatment in vacuum. • In air, the solid state reaction of Pt/Si(100) to the PtSi phase is hindered by an amorphous SiO2 layer forming and acting as a diffusion barrier 1. The same polycrystalline layer forms as did in vacuum but at at a higher tem- perature of approximately 330°C. 2. PtSi(101) and PtSi(002) are the preferred orientation observed during the heat treatment in air. 3. Extended annealing at 1000°C for approximately 10 hours results in no morpho- logical change in the PtSi film or additional consumption of Pt. V. SUGGESTIONS FOR FURTHER RESEARCH 1. Perform in situ experiments using different substrates (i.e. Si(100) vs. Si(111)). 2. Perform in situ experiments using different thicknesses of as - deposited Pt films. 3. Purposely grow an SiO2 layer to hinder the diffusion in vacuum and compare results of the air anneal. 21
  • 22. 4. Perform in situ experiments in different atmospheres using the gas delivery system being developed by Matthew Curti for his senior project at LASST. Acknowledgments This work was performed as a capstone research project for a Bachelors of Science in Physics at the University of Maine. I would like to thank my research adviser Dr. Robert Lad, my capstone adviser Dr. James McClymer, LASST research scientist Dr. George Bernhardt, graduate students Robert Fryer and David Stewart, as well as my undergraduate colleague, Matthew Curti, for their valuable insights and support. This work was funded by the National Science Foundation (NSF) under Sustainable Chemistry, Engineering & Materials (SusChEM) grant #1309983. 22
  • 23. References [1] C. Fitz, M. Goldbach, A. Dupont, and S. Schmidbauer. Silicides as contact material for DRAM applications. Microelectronic Engineering, 82(3-4):460–466, DEC 2005. PT: J; CT: European Workshop on Materials for Advanced Metallization; CY: MAR 06-09, 2005; CL: Dresden, GERMANY; SI: SI; UT: WOS:000234236100041. [2] N. S. Stoloff, C. T. Liu, and S. C. Deevi. Emerging applications of intermetallics. Inter- metallics, 8(9-11):1313–1320, SEP-NOV 2000 2000. PT: J; SI: SI; CT: International Sym- posium on Intermetallics for the 3rd Millennium - A Symposium Dedicated to RW Cahn; CY: NOV 01-04, 1999; CL: CINCINNATI, OHIO; SP: ASM Int, Intermetall Mat Comm Crit Technol Sector; US DOE; TC: 286; UT: WOS:000165753700039. [3] Omar Abbes, Khalid Hoummada, Dominique Mangelinck, and Veronique Carron. Formation of Pt silicide on doped Si: Kinetics and stress. Thin Solid Films, 542:174–179, SEP 2 2013 2013. PT: J; TC: 2; UT: WOS:000323859400029. [4] P. W. Pellegrini, C. E. Ludington, and M. M. Weeks. The dependence of schottky-barrier po- tential on substrate orientation in PtSi infrared diodes. Journal of Applied Physics, 67(3):1417– 1420, FEB 1 1990 1990. PT: J; TC: 28; UT: WOS:A1990CL92000044. [5] Manish K. Niranjan, Stefan Zollner, Leonard Kleinman, and Alexander A. Demkov. Theoreti- cal investigation of PtSi surface energies and work functions. Physical Review B, 73(19):195332, MAY 2006 2006. PT: J; TC: 23; UT: WOS:000237950400100. [6] V. W. L. Chin, M. A. Green, and J. W. V. Storey. Current transport mechanisms studied by i-v-t and ir photoemission measurements on a p-doped PtSi schottky diode. Solid-State Electronics, 36(8):1107–1116, AUG 1993 1993. PT: J; TC: 26; UT: WOS:A1993LK58000005. [7] V. Carron, F. Nemouchi, Y. Morand, T. Poiroux, M. Vinet, S. Bernasconi, O. Louveau, D. Lafond, V. Delaye, F. Allain, S. Minoret, L. Vandroux, and T. Billon. Platinum Silicide Metallic Source & Drain Process Optimization for FDSOI pMOSFETs. 2009 2009. PT: B; CT: IEEE International SOI Conference 2009; CY: OCT 05-08, 2009; CL: Foster City, CA; SP: IEEE; TC: 0; UT: WOS:000276151400045. [8] R.T. Fryer, R.J. Lad. Electrical conductivity and thermal stability of Pt3Si, Pt2Si, and PtSi films grown by e-beam co-evaporation. Journal of Alloys and Compounds, (2016, in press). 23
  • 24. [9] R.T. Fryer, R.J. Lad. Comparison of PtSi films grown by solid-state reaction and by e-beam co-evaporation: Thermal stability in air at 1000 C. MRS Advances, (2016, in press). [10] R.J. Lad, D.M. Stewart, R.T. Fryer, J.C. Sell, D.J. Frankel, G.P. Bernhardt, R.W. Meulenberg. Electrical conductivity of Pt-Zr-B and Pt-Si thin films for use in high temperature harsh environments. MRS Advances, (2016, in press). [11] L. E. Calvet, H. Luebben, M. A. Reed, C. Wang, J. P. Snyder, and J. R. Tucker. Subthreshold and scaling of PtSi schottky barrier mosfets. Superlattices and Microstructures, 28(5-6):501– 506, NOV-DEC 2000 2000. PT: J; CT: 5th Silicon Nanoelectronics Workshop; CY: JUN 11-12, 2000; CL: HONOLULU, HAWAII; SP: Inst Elect & Electr Engineers; TC: 21; UT: WOS:000165917400026. [12] Miroslav Sumega and Vladimir Ac. Study of PtSi/TiW vs PtSi/Ti-TiN contact structures. Journal of Electrical Engineering-Elektrotechnicky Casopis, 60(5):287–290, SEP-OCT 2009 2009. PT: J; CT: 15th International Conference on Applied Physics of Condesned Matter; CY: JUN 24-26, 2009; CL: Bystra, SLOVAKIA; TC: 1; UT: WOS:000271846100010. [13] International Centre for Diffraction Data, Powder Diffraction File, Card No. 04-003-0990. [14] International Centre for Diffraction Data, Powder Diffraction File, Card No. 00-004-0802. [15] R. J. Blattner, C. A. Evans, S. S. Lau, J. W. Mayer, and B. M. Ullrich. Effect of oxidiz- ing ambients on platinum silicide formation .2. Auger and backscattering analyses. Jour- nal of the Electrochemical Society, 122(12):1732–1736, 1975 1975. PT: J; TC: 47; UT: WOS:A1975AX54300040. 24
  • 25. VI. APPENDIX A: Matlab code to generate surface plots % Import excel data. Data sets must be converted to .xls using powDLL x = xlsread('xls file'); % Data angle = x(:, 1); % Extract angle from spreadsheet temp = [25, 130:10:1000]; % Define temp range % Configure data set % Removes duplicate data and deletes empty columns r = size(x, 1); % total rows c = size(x, 2); % total columns d = 2; % rows in each data set n = 1; % remove first n columns in each data set x(:, mod(1:c, d) <= n & mod(1:c, d) > 0) = []; data = x; figure(1) surf(temp, angle, log(data), ... 'FaceColor', 'interp', ... 'EdgeColor', 'none', ... 'FaceLighting', 'gouraud'); % Add axis label xlabel('Temperature (C)'); ylabel('2theta (deg)'); zlabel('ln(Intensity) (arb)'); % Set axis limits 25
  • 26. ylim([20, 80]); set(gca, 'YTick', 20:10:80); xlim([130, 1000]); set(gca, 'XTick', 150:200:1000); % Set colormapping colormap jet; % Define viewpoint az = 90; el = -90; view(az, el); hold on; h1 = plot([0, 1000], [29.09, 29.09], 'black', 'LineWidth', 1.5); label(h1, '1', ... 'verticalalignment', 'bottom', ... 'horizontalalignment', 'center', ... 'fontsize', 14); h4 = plot([0, 1000], [39.76, 39.76], 'black', 'LineWidth', 1.5); label(h4, '4', ... 'verticalalignment', 'bottom', ... 'horizontalalignment', 'center', ... 'fontsize', 14); h7 = plot([0, 1000], [50.87, 50.87], 'black', 'LineWidth', 1.5); label(h7, '7', ... 'verticalalignment', 'bottom', ... 26
  • 27. 'horizontalalignment', 'center', ... 'fontsize', 14); h2 = plot([0, 1000], [30.19, 30.19], 'black', 'LineWidth', 1.5); label(h2, '2', ... 'verticalalignment', 'bottom', ... 'horizontalalignment', 'center', ... 'fontsize', 14); h3 = plot([0, 1000], [32.07, 32.07], 'black', 'LineWidth', 1.5); label(h3, '3', ... 'verticalalignment', 'bottom', ... 'horizontalalignment', 'center', ... 'fontsize', 14); h5 = plot([0, 1000], [44.62, 44.62], 'black', 'LineWidth', 1.5); label(h5, '5', ... 'verticalalignment', 'bottom', ... 'horizontalalignment', 'center', ... 'fontsize', 14); h6 = plot([0, 1000], [46.24, 46.24], 'black', 'LineWidth', 1.5); label(h6, '6', ... 'verticalalignment', 'bottom', ... 'horizontalalignment', 'center', ... 'fontsize', 14); h8 = plot([0, 1000], [56.01, 56.01], 'black', 'LineWidth', 1.5); label(h8, '8', ... 'verticalalignment', 'bottom', ... 27
  • 28. 'horizontalalignment', 'center', ... 'fontsize', 14); h9 = plot([0, 1000], [61.5, 61.5], 'black', 'LineWidth', 1.5); label(h9, '9', ... 'verticalalignment', 'bottom', ... 'horizontalalignment', 'center', ... 'fontsize', 14); hold on spec6 = plot([0, 1000], [35.6, 35.6], 'r'); stage7 = plot([0, 1000], [33, 33], '--r'); stage8 = plot([0, 1000], [25.6, 25.6], '--r'); stage9 = plot([0, 1000], [43.6, 43.6], '--r'); stage10 = plot([0, 1000], [45.7, 45.7], '--r'); stage11 = plot([0, 1000], [59.2, 59.2], '--r'); legend([h1, h2, h3, h4, h5, h6, h7, h8, h9, spec6, stage7], {'1: PtSi (101)', ... '2: PtSi (200)', '3: PtSi (020)', '4: Pt (111)', ... '5: PtSi (220)', '6: Pt (200)', '7: PtSi (002)', ... '8: PtSi (112)', '9: PtSi(022)', ... 'Cu - Kbeta', 'Sample Stage'}, ... 'FontSize', 6, 'Position', [.8,.71,.08,.09]); 28
  • 29. B: Considerations Economic/Sustainability Significant cost savings can be made by utilizing stable thin film electrodes and sensor devices to optimize the servicing of equipment used in high temperature environments. Many high temperature industrial environments (e.g. turbine engines, power plate boilers, oil drilling) require regular monitoring in order to determine maintenance needs. By employing sensors that are stable at high temperatures, industry participants can increase the lifetime of expensive equipment and increase overall sustainability. Environmental By optimizing the maintenance of industrial machinery with wireless sensors, process effi- ciency and overall energy consumption may be reduced. This could alter the environmental impact of many industrial processes. Manufacturability The films used in this study were produced in The LASST, UHV, thin film deposition chamber by graduate student Robert Fryer. Ethical Standard ethical practices were followed during research to ensure general safety and in the reporting of the research findings. Health and Safety This project required certification in x-ray safety and general lab safety in order to operate the laboratory equipment needed. Both certification required attending a safety training course. A seminar in research ethics was also a required in order to receive NSF funding for this project. 29