SlideShare uma empresa Scribd logo
1 de 17
Baixar para ler offline
Astrophysics Group, School of Physics, University of Bristol c ESO 2015
May 13, 2015
Hunting for satellites of the most massive galaxy clusters
Thomas Wigg
H. H. Wills Physics Laboratory, University of Bristol, Tyndall Ave, Bristol BS8 1TL, UK.
e-mail: tw1979@my.bristol.ac.uk
ABSTRACT
Galaxy clusters accrete the majority of their mass through mergers with comparable mass satellite clusters, but these
lower mass satellites are often dicult to identify from their X-ray signal alone, especially at higher redshifts. Satellite
clusters were searched for in the vicinity of a sample of 11 X-ray detected clusters from the XMM-XXL cluster survey in
the redshift range 0.5  z  0.9 found in the overlap region of the VIPERS and CFHTLS-W1 galaxy catalogues. Two
selection techniques were used to create subsets of galaxies from the two catalogues likely to be part of the conrmed
clusters and any surrounding structure, and potential satellites were identied by looking for overdensities in the
combination of these selections. Sources from the XXL catalogue thought to originate from the satellites were selected
and mass estimates calculated based on their X-ray ux. The validity of any identied systems was then investigated
through comparison with similar systems from the Millennium Simulations and an additional mass estimate calculated
based on the stellar ux of each satellite and its more massive companion. Using light cones from the Millennium
Simulations the occurrence rate of cluster systems detected with apparent satellites and the number of these associated
satellites around each cluster were compared to expected rates predicted by the computer models. One conrmed
and ve potential satellites around four of the XXL clusters were identied, all of which have estimated masses and
separations from their companion cluster deemed reasonable. The rate of clusters with companion satellites and the
number of satellites per cluster were both greater in simulations than real observations but this was attributed to
limitations of the catalogues used, issues identifying weaker galactic overdensities and ambiguity in selecting satellites
in the simulations. No single piece of evidence suggests the satellite candidates found are not true clusters, but follow-up
observations are required to conrm their presence.
Key words. Galaxies: clusters: general - galaxies: clusters: intracluster medium - galaxies: distances and redshifts -
X-rays: galaxies: clusters - cosmology: dark matter.
1. Introduction
Only in recent years have attempts to reconcile observations
of the universe with a single model for the architecture of
the universe, and the growth of structure within it, been
successful. This is termed the concordance model and re-
quires a at geometry of the observable universe, implying
that the total energy density is close to the critical density
required for the universe to become closed. As it is under-
stood today, the universe is composed mainly of two domi-
nant components: non-baryonic dark matter and a form of
dark energy, where the gravity of the former is responsible
for structure formation and the latter is responsible for the
accelerated expansion of the universe. The mean density of
baryonic matter corresponds to around only 15% of the to-
tal matter in the universe (Voit 2005) and this matter is
only observable because it has been drawn into the deep
potential wells created by concentrations of dark matter,
where a small fraction has condensed into stars and galax-
ies.
Clusters of galaxies are important in testing the under-
lying cosmological model, as according to the concordance
model they are the largest and most recent gravitationally-
relaxed objects to form (as structure grows hierarchically)
and they trace the large-scale distribution of matter in the
universe. Structure formation is driven by gravity and in
the early universe regions where a uctuation caused the
density to slightly exceed the mean density became gravi-
tationally bound. These regions eventually decoupled from
expansion and collapsed upon themselves, entering a state
of virial equilibrium where the mean speeds of the compo-
nent particles are approximately half of the escape veloc-
ity (Voit 2005). Density perturbations in the concordance
model have greater amplitudes on smaller length scales and
due to this small, sub-galactic objects decoupled rst, col-
lapsed and virialised. The scale of the virialisation increased
until clusters of galaxies, with masses between 1013
and 1015
times that of the Sun (1013
M −1015
M ) were formed: this
is termed hierarchical clustering. Press and Schechter de-
veloped an analytic formalism for this process of structure
formation in their landmark 1974 paper (Press  Schechter
1974).
With improvements to equipment over the past few
decades, the catalogue of known clusters is continuously
increasing and with it more information is being garnered
from observations of clusters than ever before. This, coupled
with recent advances in computational technology, means
the ability to develop models via simulations and semi-
analytic techniques and subsequently test said models with
observations has become an imperative reality.
However, technical limitations still pose an issue in clus-
ter detection: X-ray cluster surveys suer from inherently
Page 1 of 17
Hunting for satellites of the most massive galaxy clusters
low count rates and poor signal-to-noise, meaning detec-
tion of lower mass clusters becomes increasingly dicult
at greater redshifts, whilst cluster identication from opti-
cal galaxy surveys suers from signicant projection eects.
Clusters accrete the majority of their mass through merg-
ers with comparable mass satellite clusters which are drawn
into the potential well of their more massive companion
(Lidman et al. 2013). Looking back into the early universe,
when few clusters were fully-formed, many clusters should
be present with satellites in their vicinity, but due to the
limitations of current observatories it is rarely possible to
identify these lower mass satellite clusters around the more
massive clusters detected on the sky; this issue provides the
motivation for this project.
Using photometric techniques to select galaxies from
the CFHTLS-W1 catalogue likely to belong to the larger-
scale structure around detected clusters from the XMM-
XXL cluster survey and using redshift information from
the spectroscopic VIPERS galaxy catalogue, overdensities
in the number of these galaxies in the vicinity of massive
clusters are identied, indicative of the satellites one ex-
pects to see. Potential X-ray sources from the full XXL
catalogue thought to originate from the satellites are then
identied and from this mass estimates of the potential clus-
ters are calculated. A variety of techniques are then used to
check whether the cluster systems identied seem reason-
able, notably utilising data from the Millennium Simula-
tions to investigate satellite characteristics and occurrence
rates.
This paper is split into four further sections: Section 2
covers the observable properties of clusters (Ÿ2.1) and de-
scribes the processes by which they grow (Ÿ2.2), along with
a collation of cluster catalogues and growth curves produced
using the Millennium Simulations which comprises the rst
work of this paper (Ÿ2.3). Section 3 describes the hunt for
the satellites of massive clusters conducted by making selec-
tions of structure in spectroscopic (Ÿ3.1) and photometric
(Ÿ3.2) galaxy catalogues and the combination of these tech-
niques to identify overdensities in these galaxies indicative
of clustering (Ÿ3.3). Section 3 continues with attempts to
identify X-ray signals from the potential satellites and from
these make an estimate of their mass (Ÿ3.4) and concludes
with eorts to determine the validity of the potential cluster
systems discovered using the Millennium Simulations and
comparisons between the masses calculated from the X-ray
ux of potential cluster sources and estimated from the ra-
tio of stellar mass between the satellites and their massive
companion (Ÿ3.5). Section 4 discusses the sources of pos-
sible uncertainty (Ÿ4.1), the signicance of the discovered
systems (Ÿ4.2) and the future of satellite detection with ref-
erence to the scheduled eROSITA observatory (Ÿ4.3), with
section 5 summarising the project.
Throughout this paper, a at cold dark matter cosmol-
ogy with ΩΛ = 0.70 , Ωm = 0.30 and H0 = 70km
-1
Mpc
-1
is
assumed.
2. Background and preliminary work
2.1. Observable properties of galaxy clusters
In order to select clusters (or groups) of galaxies from the
observed galaxy distribution, one must dene some selec-
tion criteria. In 1958, Abell selected 1,682 galaxy clusters
from the Palomar Sky Survey (Abell 1958) according to
two selection criteria: the rst put a constraint on the min-
imum density of the cluster and the second required that
the cluster contained a sucient amount of galaxies. These
were termed the compactness and richness criterion respec-
tively. Abell also classied a cluster as regular if its galaxy
distribution was roughly circularly symmetric and irregular
otherwise.
Stars make up only a small fraction of the total bary-
onic mass of a cluster, with substantially more contained
in hot gas which emits in the X-ray and is visible in the
microwave through the Sunyaev-Zel'dovich eect, allowing
cluster detection in these frequency ranges as well as the
optical. The baryonic mass of stars and hot gas in a clus-
ter only makes up approximately one eighth of the total
mass (Allen et al. 2002), which means gravitational lensing
is also an extremely useful probe of massive structures like
clusters.
2.1.1. Optical
Charles Messier and William Herschel (Messier 1781; Her-
schel 1785) were among the rst to identify concentrations
of galaxies using optical observations; they observed galax-
ies in the Virgo and Coma clusters. Optical techniques have
improved over the past two centuries, culminating in the
denitive cluster catalogues of George Abell and collabo-
rators (Abell 1958; Abell et al. 1989). Abell's catalogues
contain most of the known nearby galaxy clusters and are
the basis for much of our modern understanding of clusters.
Optical observations are useful as the cluster luminos-
ity scales with cluster mass, generally adhering to the lumi-
nosity distribution proposed by Schechter (1976), with the
number of galaxies in luminosity range dL about L propor-
tional to L−α
exp(−L/L∗), with α ∼ 1 (e.g. Balogh et al.
2001). This relationship is important as it is often more
useful to compare cluster masses, which dictate many of
the physical processes in the cluster, rather than cluster
luminosities.
Once a cluster has been optically identied, obtaining
the radial velocities vr of the cluster galaxies helps deter-
mine the cluster mass. As the velocity distribution of a re-
laxed cluster is expected to be approximately Gaussian in
velocity space, cluster candidates can be conrmed if their
velocities fall within a chosen number of standard devia-
tions of the mean dispersion, dependent on the stringency
of the cluster member selection. Zwicky (1933, 1937) was
the rst to measure the one-dimensional velocity dispersion
σ1D of a cluster, nding σ1D ∼ 700kms
-1
for the Coma clus-
ter. This provided some of the rst evidence for the presence
of dark matter in the universe, as the inferred mass from
this velocity dispersion along with his estimated cluster ra-
dius required substantially more mass than was observed in
stars.
In his 1937 paper, Zwicky also proposed that cluster
masses could be measured through the gravitational lensing
of background galaxies. The technique did not become prac-
tical for another sixty years but is now one of the primary
methods for measuring cluster mass. Chwolson in 1924 and
Einstein in 1936 were the rst to propose that, if a back-
ground star were precisely aligned with a massive object,
the gravitational eect of this mass would deect the path
of the star's photons resulting in a circular ring of light, cen-
tred on the deector (Chwolson 1924; Einstein 1936). Mea-
suring the weak-lensing distortion of any single galaxy is
Page 2 of 17
Thomas Wigg 2015 | Hunting for satellites of the most massive galaxy clusters
nearly impossible, but the mass of a cluster can be inferred
by looking at the distortion of an entire eld - this technique
is demonstrated in Bartelmann  Schneider (1999).
2.1.2. X-ray
With only around one tenth of the universe's baryons re-
siding in stars in galaxies, there is a signicant amount
of matter located in intergalactic space. These inter-
galactic baryons are generally very dicult to observe,
but when compressed by the deep gravitational potential
wells of clusters, the intracluster gas is heated to X-ray
emitting temperatures, releasing photons through thermal
bremsstrahlung. This gas, which corresponds to approxi-
mately 15% of the cluster mass, has a temperature which
correlates to the depth of the potential well and from this
the total mass of the galaxy cluster can be calculated - the
physics of this is described in Sarazin (1988). It was follow-
ing the detection of the ionised iron line FeXXVI by the
Ariel-V satellite (Mitchell et al. 1976) that the usefulness
of X-ray emission of the intracluster medium (ICM) as a
probe of the gravitational potential within the cluster (and
therefore the gravitating mass) was realised. The calcula-
tion for this is presented by Fabricant, Lecar and Gorenstein
(Fabricant et al. 1980).
Galaxy clusters are identied from the X-ray signal of
their ICM through a reduction pipeline - an algorithm se-
lects source candidates based on whether their characteris-
tics are indicative of cluster emission. However, with the in-
herently low count rates and signal-to-noise associated with
cluster detection, at greater distances it becomes increas-
ingly dicult to identify the extended sources of galaxy
cluster ICM amidst a universe of X-ray bright point sources
such as active galactic nuclei (AGN). Cluster X-ray lumi-
nosity scales with mass (Piaretti et al. 2010), leading to
lower mass clusters being biased against at higher redshift,
as they are the rst to fall below either the ux limit or
pipeline conrmation limit for a given survey.
2.1.3. Microwave (Sunyaev-Zel'dovich eect)
The hot intracluster medium can also be observed through
its eect on the cosmic microwave background (CMB).
The CMB itself has a nearly perfect blackbody spectrum
(Mather et al. 1990) and soon after the discovery of this
background radiation it was theorised that the spectrum
would be distorted by Compton upscattering of the CMB
photons by the intergalactic gas (Weymann 1965, 1966).
Sunyaev  Zel'dovich (1970, 1972) predicted that the CMB
photons would indeed be upscattered to higher energy by
the ICM and this eect is now known as the Sunyaev-
Zel'dovich (S-Z) eect.
Birkinshaw (1991) demonstrated some of the rst S-Z
detections of clusters, but these were marginal. However,
in the following decade, many clusters were detected with
high signicance (Birkinshaw 1999; Carlstrom et al. 2000).
Several S-Z surveys, including the South Pole Telescope
(SPT, Carlstrom et al. 2009) survey, the Atacama Cos-
mology Telescope (ACT, Fowler et al. 2007), and Planck
(Tauber et al. 2010), are actively ongoing, providing the
rst S-Z-selected cluster catalogues (e.g. Vanderlinde et al.
2010; Menanteau et al. 2010).
Using S-Z techniques to identify clusters is advantageous
as, due to the fact that the observed photons are from the
CMB, they are redshift-independent. However, X-ray ob-
servations of S-Z-detected clusters are still important for
many reasons. The X-ray properties allow a better calibra-
tion of the S-Z signal and yield the calibration of the scaling
relations needed for cosmological studies with S-Z-selected
cluster samples. X-ray observations also allow the testing of
the selection function of S-Z surveys and verication of new
S-Z cluster candidates. Furthermore, they are essential for
statistical analyses of the S-Z data (Piaretti et al. 2010).
2.2. Growth of clusters
Due to the hierarchical nature of structure growth and the
self-similarity of galaxy clusters, growth of structure on
vastly dierent scales occurs in much the same way. Mergers
not only appear to be the dominant channel for mass growth
of a galaxy or cluster's dark matter halo but also the stellar
mass growth, both directly through galaxy-galaxy mergers
and through the accretion of potentially star-forming gas
(Fakhouri et al. 2010; Lidman et al. 2013). Lidman et al.
(2013) dene a major merger as 0.25  µ∗
 1, where µ∗
is
the mass ratio between the satellite and its more massive
companion. If the orbital energy is suciently low, close en-
counters between two systems can lead to a merger. How-
ever, galaxies in clusters are unlikely to merge as their en-
counter speed is generally much larger than their internal
velocity dispersion (Mo et al. 2010). There is one important
exception: through dynamical friction, galaxies lose energy
and momentum which causes them to `sink' towards the
centre of the potential well. Provided the dynamical fric-
tion time is suciently short, the galaxy will eventually
reach the cluster centre and merge with the central galaxy
residing there. This process is called galactic cannibalism.
2.2.1. Satellite clusters
According to self-similarity, satellite clusters are bona de
clusters which appear structurally identical to the most
massive clusters they are bound to (Neumann  Arnaud
2001), albeit consisting of fewer galaxies and of lower mass.
Due to the nature of merger-based growth, satellite clusters
must be present in the vicinity of some massive clusters,
especially in earlier periods of cosmic history when few, if
any, galaxy clusters had cleared the surrounding universe
of dust and smaller clusters to become fully-formed. Clus-
ter systems in the process of merging have been observed
and detailed in numerous papers (Hagino et al. 2015; Kato
et al. 2015; Storm et al. 2015; Zhang et al. 2015 to list but
a few of the most recent), though little investigation has
been performed into the presence of discrete satellites, still
independent from the massive clusters to which they will
eventually infall.
This is due to the fact that the emission from a lower
mass satellite will likely be considerably smaller than that
observed from its more massive companion. In the case of
the emission from the satellite's ICM, the X-ray ux ob-
served is a function of its mass (Piaretti et al. 2010), mean-
ing that for more distant clusters, where the cluster emis-
sion itself is near the ux limit of the observations which
detect it, the X-ray signal from any satellite clusters will
Page 3 of 17
Hunting for satellites of the most massive galaxy clusters
likely fall below the threshold to be conrmed as clusters
of their own volition.
Detection of these satellites is important, not only to
conrm theoretical models detailing the growth of clusters,
but also to plot the large-scale structure, of which clusters
are intrinsic components in forming the laments and voids
which trace the largest arrangement of matter in the uni-
verse.
2.2.2. Simulations
N-body simulations representing the dark matter haloes
of galaxies and clusters, occasionally combined with semi-
analytic descriptions, have been increasingly used over the
past two decades to investigate the hierarchical forma-
tion of large-scale structure in the universe (e.g. Navarro
et al. 1997; De Lucia  Blaizot 2007; McBride et al. 2009;
Fakhouri et al. 2010; Laporte et al. 2013). Only recently,
however, have the theoretical expectations and observations
of cluster growth come into excellent agreement (Laporte
et al. 2013).
Fakhouri et al. (2010) utilise the Millennium (Springel
et al. 2005) and Millennium-II (Boylan-Kolchin et al. 2009)
to construct merger trees of dark matter haloes and quan-
tify their merger rates and mass growth rates from between
z = 0 and z = 15 for over ve orders of magnitude in the
descendant halo mass (1010
M M0 1015
M ). The
Millennium-II simulation has the same number of particles
but 125 times better mass resolution and the new data base
provides 7.5×10⁶
dark matter haloes (each containing more
than 1000 simulation particles) between redshift 0 and 15,
adding to the 11.3 × 10⁶
haloes (between z = 0 and z = 6)
from the Millennium simulation.
To compute the total mass growth rate of a halo of
given mas M0 at time t, Fakhouri et al. (2010) follow the
main branch of its merger tree and set ˙M = (M0 − M1)/t,
where M0 is the descendant mass at time t and M1 is the
mass of its most massive progenitor at time t − ∆t. The
plot showing the mean value of ˙M as a function of z, taken
from Fakhouri et al. (2010), can be seen in Fig. 1. They
nd the mass accretion rates shown in Fig. 1 to be well t
by equations (8) and (9) of McBride et al. (2009) with only
the coecients needing minor adjustments. They nd that
the updated t, shown by the dashed lines in Fig. 1, for the
mean growth rates of haloes of mass M at redshift z can
be written
˙M
mean
= 46.1M yr−1 M
1012M
1.1
×(1 + 1.11z) Ωm(1 + z)3 + ΩΛ (1)
2.3. Collation of cluster catalogues and analyses of cluster
mass growth
The work of Piaretti et al. (2010) sought to homogenise,
to an overdensity of 500
1
, many previous ROSAT All Sky
1
Cluster limits are dicult to dene, so in order to make cluster
properties comparable the region with an edge corresponding to
a certain overdensity, where the density of matter is a given
factor times the critical density, is normally used.
Fig. 1. Fakhouri et al. (2010) - Mean mass accretion rate of
dark matter on to haloes as a function of redshift from the two
Millennium simulations (solid curves). Halo masses ranging from
1010
to  1014
M are plotted. The dashed curves show the
accurate t provided by Equation (1). The right-hand side of
the vertical axis labels the mean accretion rate of baryons, Mb,
assuming a cosmological baryon-to-dark matter ratio of 1/6.
Survey-based (NORAS, REFLEX, BCS, SGP, NEP, MACS
and CIZA) and serendipitous (160SD, 400SD, SHARC,
WARPS and EMSS) cluster catalogues into a single Meta-
Catalogue of X-ray Clusters of galaxies: the MCXC. The
MCXC comprises of 1743 clusters, with redshift z, stan-
dardised 0.1 − 2.4 keV band luminosity L500, total mass
M500 and radius R500 provided. Being the largest catalogue,
all subsequent catalogues were homogenised to be compa-
rable to the MCXC according to Piaretti et al. (2010).
In addition to the clusters contained in the MCXC,
clusters from the XMM-XXL (Pierre et al. 2011), XMM-
LSS (Clerc et al. 2014) and XMM-XCS (Mehrtens et al.
2012) - all X-ray surveys utilising the XMM-Newton tele-
scope - were also added to the catalogue. In order to ho-
mogenise the surveys with the MCXC, it was necessary to
transform the luminosities into the correct (0.1 − 2.4 keV)
band, as the LSS and XXL catalogues were published in the
0.5 − 2.0 keV band and the XCS catalogue in the bolomet-
ric (0.01 − 100 keV) band. To do this, a correction factor,
which is simply the ratio between the uxes in each band,
is required. This factor is X-ray temperature and redshift
dependent, and a table of the correction factors was gen-
erated using the APEC emission spectrum in xspec. An
abundance of 0.3 was used.
As well as the mentioned X-ray clusters, two S-Z-
selected catalogues - the all sky Planck-SZ (Planck Collab-
oration 2013) and 720deg
2
South Pole Telescope SPT-SZ
(Reichardt et al. 2012) - were also included. The Planck
catalogue contains 861 conrmed clusters, with 178 con-
rmed as new clusters, mostly through follow-up observa-
tions whilst the SPT catalogue consists 158 optically or
infrared conrmed clusters, with 117 new discoveries. Both
Page 4 of 17
Thomas Wigg 2015 | Hunting for satellites of the most massive galaxy clusters
the Planck and SPT luminosities were already in the correct
band to be included in this catalogue.
To ensure the masses in the four catalogues used are
comparable, equation (2) of Piaretti et al. (2010) was used
to covert the L500 of the XMM-LSS and XMM-XCS to
cluster masses M500. This equation reads
h(z)−7/3 L500
1044ergs−1
= C
M500
3 × 10¹⁴M
α
(2)
where log(C) = 0.274, α = 1.64 and h(z) is the ratio of
the Hubble constant at redshift z to its present value, H0
i.e. h(z)2
= Ωm(1 + z)3
+ ΩΛ. Note that this is an example
of an X-ray scaling relation; references with a more exten-
sive derivation (e.g. Giodini et al. 2013) and papers tackling
scaling relations in the optical and microwave bands (Cza-
kon et al. 2014) are readily available.
After considering the work of Fakhouri et al. (2010), it
was decided that obtaining a form of equation (1) which
gives the change in mass ∆M of a given cluster of mass M
between the look-back times t1 and t2, corresponding to a
redshift change of z(t1) to z(t2), would be useful. Before
numerical integration was necessary, the simplest form of
this equation can be written
∆M = −
z(t2)
z(t1)
ΩΛ
Ω0
(1 + 1.11z)
(z + 1)
Ωm(z + 1)3 + ΩΛ
Ω0(z + 1)3 + ΩΛ
dz
(3)
Fig. 2 shows the distribution of the MCXC, XMM-XXL,
XMM-LSS, XMM-XCS, Planck-SZ and SPT-SZ clusters on
a plot of mass against redshift. Equation (3) was numeri-
cally integrated over all M(z) and z using the trapezium
rule to produce contour plot beneath the cluster points on
Fig. 2, where a line of constant colour traces the likely mass
history of a cluster based on the work of Fakhouri et al.
(2010).
It is clear from this that at intermediate redshifts, few
clusters have been detected with masses  1014
M . This
does not correlate to the actual existence of lower mass
clusters however, and is simply a comment on the technical
limitations of current detection techniques. As mentioned,
it is for this reason that is has not yet been possible to
detect many low mass satellites around massive clusters -
a problem discussed in the following section and addressed
in the remainder of this paper.
3. Hunting for satellite clusters
The nature of hierarchical clustering insists that at higher
redshift (z  0.5), where clusters are rarely fully-formed,
more massive clusters be surrounded by lower mass satellite
groups and clusters which will eventually merge with the
host. The statement by Lidman et al. (2013) and Fakhouri
et al. (2010) that major mergers provide the dominant chan-
nel of mass growth of massive clusters means that satel-
lite clusters of comparable (but lower) mass to the host
should be present around clusters in the early universe.
Self-similarity requires these be clusters of their own vo-
lition, with a present ICM and associated X-ray emission.
As discussed earlier, unidentied satellite clusters are in-
trinsically too low a mass to be conrmed from their X-ray
signal alone (see Ÿ2.1.2). In this paper, potential satellites
were identied by searching for overdensities in the number
of observed galaxies around conrmed clusters.
Determining the spatial distribution of objects in the
Universe when observing from our xed position on Earth
is inherently dicult: without some form of additional in-
formation, the three-dimension cosmos exists only as a two-
dimensional projection on our sky. Because of this, some
means of determining or inferring the three-dimensional dis-
tribution of galaxies is necessary to identify clustering. Two
methods for identifying this clustering were used in this in-
vestigation. The rst relies on using the spectroscopically
determined redshifts of a sample of galaxies to plot their
true spatial distribution. The second involves using pho-
tometric data from a dierent sample of galaxies to make
relevant colour cuts about a cluster's red sequence to iso-
late galaxies that were likely formed at the same epoch as
the cluster. Both of these techniques are described in more
detail in the subsequent subsections.
It is advantageous to combine these techniques in or-
der identify satellites which fall below the selection thresh-
old of any one observational technique, and as such the
areas surveyed using each method must necessarily over-
lap. This hugely restricts the available data, as only ar-
eas of sky with deep-eld X-ray, spectroscopic galaxy and
photometric galaxy data are usable. One such overlap be-
tween the the VIMOS Public Extragalactic Redshift Survey
(VIPERS), Canada-France-Hawaii Telescope Legacy Sur-
vey (CFHTLS) and the XXL-North cluster catalogue is
utilised in this paper.
The XXL Extragalactic Survey (Pierre et al. 2011;
Pierre  XXL Consortium 2014) is a recent X-ray cluster
survey utilising the XMM-Newton observatory. It contains
336 likely clusters (188 of which are are very good cluster
candidates) with 0  z  2.24 split between two survey ar-
eas. The Northern catalogue utilised in this investigation is
centred on the CFHTLS-W1 area (RA: 2h23m, Dec: -4 deg
30') and covers an area of 25deg
2
. A total of 26,555 X-ray
sources were detected in the Northern eld of the XXL sur-
vey. Galaxy clusters demonstrate the largest X-ray source
extent, or core radius, as the emission from the ICM is dif-
fuse. Likely clusters are classied from this extent and the
corresponding likelihood of that being the true extension,
with a lower limit on both set to dene very good class 1
(C1) cluster candidates and possible class 2 clusters (C2).
A minimum extension of 15 arcseconds is imposed for both
C1 and C2 sources, with lower likelihood limits of 5 and 33
dening the two classes respectively (Pacaud et al. 2006).
The rst VIPERS public data release (PDR-1; Garilli
et al. 2014), comprises 57,204 spectroscopic measurements
of galaxies with iAB  22.5 and 0.5  z  1.2. This in-
vestigation uses the catalogue of 30,523 galaxies from the
incomplete W1 eld (centred at RA: 02h26m00.0s, Dec: -04
deg 30'00), with a surveyed area of 7.932deg
2
at the time
of the rst data release. Objects chosen for spectroscopic
follow-up to be included in VIPERS were selected from the
CFHTLS-Wide catalogue.
CFHTLS (Hudelot et al. 2012) is the combination of
a large fraction (∼50%) of Canada and France's dark
and grey telescope time from mid-2003 to early 2009 and
comprises two components: CFHTLS-Deep and CFHTLS-
Wide, with the latter being comprised of 4 contiguous in-
Page 5 of 17
Hunting for satellites of the most massive galaxy clusters
∆ XMM-XCS ∇ XMM-LSS ❏ XXL ❍ MCXC + SPT-SZ × PCCS-SZ
0 0.2 0.4 0.6 0.8 1 1.2 1.4 1.6 1.8 2
z
1
10
100
1000
M500(z)[1012
solarmasses]
1
10
10
2
103
M0/[1012
solarmasses]
Fig. 2. Plot of mass M500/1012
M against redshift z showing the clusters collated from the MCXC, XMM-XXL, XMM-LSS,
XMM-XCS, Planck-SZ and SPT-SZ catalogues. The contour plot below shows the likely mass accretion of a cluster, with lines of
constant colour representing how the mass M(z) of a cluster of mass M0 today has changed since z = 2.
dependent patches covering a total area of ∼155deg
2
. The
CFHTLS-W1 area selected for this investigation is reduced
to contain the 1,034,605 objects for which 3.6µm and 4.5µm
band magnitudes are available. This is due to the nature of
the photometric cuts made in this investigation, described
in detail in Ÿ3.2.
The VIPERS area is the smallest of the three survey
areas used and consequently is the limiting area for this
project. Within this area, the 11 XXL clusters (of which 6
are C1) with 0.5  z  0.9 were selected for investigation,
with this restriction necessary due the fact that the density
of VIPERS galaxies drops to an unusable level at redshifts
greater than this.
3.1. Isolating structure using spectroscopic redshifts
If the redshifts of a sample of galaxies are known, it al-
lows the unique opportunity of plotting the precise three-
dimensional distribution of these galaxies in space, with a
redshift directly correlating to a spatial distance away from
Earth. This method provides the most direct way of identi-
fying clusters of galaxies, with overdensities in the distribu-
tion resulting from the true grouping of galaxies in space,
rather than being inferred from a selection proxy (as with
the photometric technique used in Ÿ3.2).
For each of the selected clusters, an initial redshift cut
in the VIPERS catalogue of ±0.1 about the cluster red-
shift in a square area of 0.25deg
2
, when possible centred
on the cluster, was made with a view to identify any ex-
tended structure. For clusters where galactic overdensities
were obvious, a manual selection of the structure was made
to produce a subset of galaxies that appear to belong to
the same, larger-scale structure as the conrmed XXL clus-
ter. For clusters where no obvious galactic clustering was
present, a cut in redshift of ±0.02 was made about the clus-
ter - this range was chosen as, for the clusters where galactic
overdensities were identiable in the redshift-RA plane, any
observable structure was contained in this cut.
An example of a selection of obvious structure can be
seen in the spatial distribution of galaxies shown in Fig. 3,
with evident clustering around n0286, a class 1 cluster from
the XXL-N catalogue. Whilst the selection was made man-
ually, the validity of this method is supported by the his-
togram: the selection of galaxies made is contained within a
strong, single peak in the distribution, suggesting that the
majority of the galaxies selected are in fact part of the larger
structure the cluster occupies. Of the 11 clusters examined,
6 were situated in regions of galactic overdensity such that
is was possible to select its likely containing structure.
3.2. Identifying likely clustering using photometric techniques
All rich galaxy clusters contain a population of passively
evolving, early-type elliptical galaxies which show a strong
linear relationship between their colour and magnitude.
This relation, termed the red sequence, demonstrates an in-
credibly low scatter and appears extremely homogeneous,
both within clusters and between them (Bower et al. 1992).
The stellar population which makes up the red sequence
appears to be formed at high redshift (z  2) (Gladders
Page 6 of 17
Thomas Wigg 2015 | Hunting for satellites of the most massive galaxy clusters
32.0 32.1 32.2 32.3 32.4
0.65
0.70
0.75
0.80
0.85 XXL cluster (n0286)
Selected subset
Excluded galaxies
z
RA (Deg)
0.66 0.68 0.70 0.72 0.74 0.76 0.78 0.80 0.82 0.84
0
5
10
15
Count
z
Selected subset
Excluded galaxies
Fig. 3. Left: spatial distribution of VIPERS galaxies (blue and orange) in the RA-z plane within a Dec. cut of ±0.25deg about
C1 XXL cluster n0286 (black circle). Orange points show the manually selected subset of galaxies assumed to be part of the
large-scale structure in which n0286 is present. Right: Distribution of VIPERS galaxies in redshift contained within a 0.25deg2
square annulus in RA and Dec. about the position of the C1 XXL cluster n0286. The manually selected subset of galaxies about
the cluster is shown.
 Yee 2000), which is to be expected in cold-dark-matter
dominated scenarios of hierarchical structure formation, as
present-day clusters are associated with the most extreme
initial overdensities, which were the rst to collapse.
Other than their homogeneity, there are many other
observational reasons that make the red sequence an at-
tractive target for cluster identication. Elliptical galaxies
can be morphologically selected with a high level of con-
dence due to their core-dominated compact brightness pro-
les (Abraham et al. 1994; Gladders et al. 1998). In addi-
tion to this, elliptical galaxies have been shown to dominate
the bright end of the cluster luminosity function (Sandage
et al. 1985; Barger et al. 1998), meaning in ux limited
surveys they are the most readily observed. Cluster ellip-
ticals are also brighter at greater redshift (Schade et al.
1997; van Dokkum et al. 1998), which is to be expected of
stellar populations which are passively evolving. According
to the morphology-density relation (Dressler et al. 1997),
the radial distribution of elliptical galaxies in regular, cen-
trally concentrated clusters is also more compact than other
morphological types, providing a higher contrast against
the background. Even in irregular clusters with no well de-
ned centre, ellipticals still trace the densest cluster regions
as the morphology-density relation holds true, albeit with
lesser signicance (Dressler et al. 1997).
The Cluster Red Sequence (CRS) method of cluster de-
tection is described in detail by Gladders  Yee (2000),
and identies clusters computationally as an overdensity of
galaxies on the sky, which correlates to an overdensity in
the colour-magnitude plane consistent with a red sequence
of early-type galaxies. The CRS method is practically un-
aected by projection eects for two reasons: the rst is
that as cluster ellipticals are the oldest stellar populations
in the universe, they are as red or redder than any other
galaxies at a given redshift. The second utilises the fact
that, with properly chosen optical lters (straddling the
4000Å break), the cluster red sequence has been shown to
be as red or redder than any other galaxies at a given red-
shift and all lower redshifts - a fact which means the CRS
method does not accumulate signicant foreground noise,
with background contamination also being minimised as
structures at higher redshift will generally be most signi-
cant at yet redder colours. Gladders  Yee (2000) also note
that a cluster's red sequence can be used as a remarkably
precise redshift indicator, given a coherent enough popula-
tion of early-type galaxies.
The consequences of the previous statements mean that
any clusters that were formed at the same point in cos-
mic history (i.e. at the same redshift) should demonstrate
a unique red sequence, which means that a cluster and any
potential satellite clusters at approximately the same red-
shift should show a very similar red sequence. This is the
motivation for the photometric technique of satellite cluster
identication used in this section of the paper: by identify-
ing the red sequence of a conrmed XXL cluster and reduc-
ing the CFHTLS-W1 catalogue by making a restriction in
colour corresponding to the cluster's red sequence, it should
be possible to identify surrounding structure, despite there
being no direct redshift information available. Gladders 
Yee (2000) states that the passively evolving, early-type
galaxies which make up the red sequence are present out to
a redshift of at least 1.3, which means this method is valid
for all clusters chosen for this investigation.
It was thought that the most rigorous way to create a
subset of galaxies from the CFHTLS-W1 catalogue, from
which to attempt to identify a red sequence, would be
achieved by calculating the virial radius of the XXL clus-
ter in question and selecting all galaxies which fall within
the angular region of sky corresponding to this radius. For
the purposes of this investigation, it was assumed that the
virial radius can be approximated to the radius which cor-
responds to an overdensity of 200 times the critical density,
R200 (Kravtsov 2013). In order to calculate R200 of the XXL
clusters, it was rst necessary to convert the given masses
Page 7 of 17
Hunting for satellites of the most massive galaxy clusters
(which are to an overdensity of 500, M500) to an overdensity
of 200 (M200); the details of this conversion can be found in
Hu  Kravtsov (2003). Assuming the cluster is spherically
distributed, the equation for the required radius,
R200 =
3M200
800πρc
1
3
(4)
where is ρc is the critical density, can be derived.
The angular separation on the sky corresponding to each
cluster's virial radius was then calculated given the clus-
ter's redshift (Wright 2006), and from this is was possible
to create a subset of galaxies for each cluster which fall
within the projected virial radius. The colour (rAB − iAB)
against i-band magnitude (iAB) was plotted for each of the
galaxies in each subset, but attempts to identify any red se-
quence in this data were futile: there was simply too much
noise. This is due to the fact that selecting all the galax-
ies within a projection of the virial radius on the sky will
include huge numbers of foreground and background galax-
ies, with largely dierent colours and magnitudes, which
will pollute the true red sequence of the cluster. Progress
was made by utilising the earlier statement that, according
to the morphology-density relation, the early-type galaxies
responsible for the red sequence occupy the densest clus-
ter region(s). Assuming the clusters we are investigating
are centrally concentrated, the early-type galaxies should
inhabit the central core of the cluster. Using this informa-
tion, a circular region corresponding to a projection of 30%
of the virial radius of the cluster on the sky was instead
used to select the subset of galaxies from which attempts
to identify the the red sequence would be made, under the
assumption that this would greatly increase the proportion
of galaxies in each selection which are true cluster ellipti-
cals.
This selection technique proved much more eective,
with possible red sequences identied for 8 of the 11 clus-
ters. To make a selection of galaxies using the identied red
sequence, a cut of (rAB −iAB)RS ±0.1 about the estimated
centre of the red sequence was taken, and all galaxies out-
side of this colour cut excluded. It was considered that this
method of selection assumes a perfectly horizontal red se-
quence, but this was deemed acceptable for two reasons.
Firstly, in Gladders  Yee (2000) it is shown that the slope
of the red sequence for sequence colours of rAB −iAB  1.5
is very shallow and as all the clusters for which red se-
quences were identied had sequence colours which fall be-
low this value, a horizontal approximation was considered
valid. The second is a comment on the quality of the data
- because of the inevitable projection eects suered even
with a reduced selection annulus, the red sequences still re-
mained tricky to identify and any attempts to determine
the slope of the sequence were unsuccessful.
Fig. 4 shows the galaxies selected from within the pro-
jection of 30% of the virial radius of cluster n0286. Note that
a magnitude cut of iAB  23 has been made to remove any
faint background galaxies that are unlikely to be part of
the cluster or its surrounding structure. The red sequence
can be identied with some condence as a line of higher
density in the colour-magnitude plane, with a restriction
in colour containing the red sequence shown. Fig. 5 shows
this selection in context with the other galaxies contained
in the 0.25deg
2
area surrounding n0286. The nal selection
of galaxies made using a magnitude cut of iAB  23 and
restriction in colour of 1.25  rAB − iAB  1.45 is shown
and it is evident that this technique signicantly reduces
the population of galaxies being investigated.
19.5 20.0 20.5 21.0 21.5 22.0 22.5 23.0
0.0
0.2
0.4
0.6
0.8
1.0
1.2
1.4
1.6
1.8
RS selection
Galaxies within 30% VR
r-i
i
Fig. 4. Galaxies from the CFHTLS-W1 catalogue selected from
within the projection of 30% of the virial radius of XXL cluster
n0286 on the sky, with a magnitude cut of iAB  23 performed.
Orange points show the selected red sequence, contained in a
cut of 1.25  rAB − iAB  1.45.
16 18 20 22 24 26
0.0
0.2
0.4
0.6
0.8
1.0
1.2
1.4
1.6
1.8
2.0
2.2
0.25deg
2
galaxies
Galaxies in 30% VR
RS members
Colour/mag. cut
r-i
i
Fig. 5. Galaxies from the CFHTLS-W1 catalogue in a 0.25deg2
area around XXL cluster n0286. Dark grey points show a subset
of these galaxies in a selection with a magnitude restriction of
iAB  23 and colour restriction of 1.25  rAB −iAB  1.45. The
selection of galaxies made from within the projection of 30% of
the virial radius of n0286 on the sky, along with the identied
red sequence both shown in Fig. 4, are also displayed.
As mentioned, by making a cut in colour about a clus-
ter's red sequence, it was hoped that it would be possible to
isolate not only the population of early-type galaxies from
within the cluster, but also any populations of passively
evolving ellipticals contained in the cores of nearby cluster
structures, as these must have formed at the same time as
the cluster's red sequence members.
Page 8 of 17
Thomas Wigg 2015 | Hunting for satellites of the most massive galaxy clusters
0.0 0.2 0.4 0.6 0.8 1.0 1.2 1.4 1.6 1.8 2.0 2.2
0.0
0.5
1.0
1.5
2.0
1.2 1.4
0.0
0.5
0.25deg
2
galaxies
RS members
Double colour/mag. cut
3.6m-4.5m
r - i
Fig. 6. Galaxies from the CFHTLS-W1 catalogue in a 0.25deg2
area around XXL cluster n0286. Dark grey points show a subset
of these galaxies in a selection with a magnitude restriction of
iAB  23 and a double restriction in colour of 1.25  rAB −
iAB  1.45 and −0.2  3.6µmAB − 4.5µmAB  0.2. The subset
of galaxies selected to be the cluster's red sequence is also shown.
The area of interest is shown for clarity.
However, it is likely that a number of foreground and
background eld galaxies, which happen to have colours
within the relatively broad range of (rAB−iAB)RS ±0.1, will
enter the selection and pollute the data. To further isolate
galaxies which are part of the cluster and any surrounding
structure, an additional cut in colour in the 3.6µm - 4.5µm
band was made to isolate galaxies with a similar spectral
energy distribution as the red sequence members.
Fig. 6 shows how this selection was performed by plot-
ting the colour of the identied red sequence galaxies in the
3.6µm - 4.5µm band against the colour in the rAB − iAB
band and identifying any corresponding grouping in the for-
mer; a range of 0.4 in the 3.6µm - 4.5µm band was used to
make a second restriction in colour. This range often did
not include all galaxies from the original selection, which
suggests those galaxies are not truly part of the cluster's
population of early-type galaxies as the red sequence should
be a ubiquitous presence in all colour bands (Gladders 
Yee 2000). The 0.4 cut was chosen as it was the range over
which any obvious grouping in the 3.6µm - 4.5µm band ex-
isted. Whilst this is a more generous restriction than the
one used in the original red sequence selection, this was
deemed necessary as identifying any sort of central value
for the sequence in the second band was impossible with
such a limited number of galaxies. As such, with a smaller
band, it is possible that true sequence galaxies may be ex-
cluded, reducing the quality of the data. It is clear from Fig.
6 however, the eectiveness of the double colour restriction
in reducing the number of galaxies being investigated.
Applying this selection method to all clusters for which
a red sequence was identiable produced a subset of galax-
ies within a 0.25deg
2
area around each cluster which have
a similar spectral energy distribution to those selected as
early-type galaxies from the XXL cluster. The advantages
of this selection are twofold for identifying satellite clusters:
in the case of passively evolving galaxies such as these, they
were very likely to have formed at the same cosmic epoch
and therefore exist at the same redshift as the cluster and,
as is the nature of galaxies of this morphological type, they
are likely to inhabit the central regions of nearby clusters.
The validity of this method was supported by the fact that,
for all clusters for which a red sequence was identiable, a
strong overdensity in the number of galaxies in each selec-
tion was present at the locations of the clusters in the XXL
catalogue, dened by their respective X-ray sources, sug-
gesting that the restrictions imposed are in fact selecting
galaxies which are part of the cluster structure.
3.3. Combining spectroscopic and photometric cuts to
identify cluster systems
Fig. 7 shows how the combination of both subsets of galax-
ies from the VIPERS (Ÿ3.1) and CFHTLS-W1 (Ÿ3.2) cata-
logues can be combined to plot the number density of galax-
ies as a two-dimensional histogram of the sky to identify
any clustering. Note that to avoid any double counts re-
sulting from galaxies contained in both the CFHTLS-W1
and VIPERS catalogues, a matching algorithm was used
to remove any duplicates. For the scale of clustering neces-
sary to be gravitationally bound and considered a satellite
cluster of its own volition, clustering in the subsets selected
using both methods would likely be evident, and for this
reason combining the two selection methods is advanta-
geous: any clustering found in both selections will show as
a strong overdensity, whilst any clustering in an individual
catalogue not present in the other, which is therefore un-
likely to correspond to a massive cluster, will not appear so
evidently. It is worth noting that, as there is no direct red-
shift information available for the CFHTLS-W1 catalogue,
any clustering has been inferred by proxy and condence
in its existence must be cautious. The combination of both
techniques has the additional advantage that, should clus-
tering in the VIPERS catalogue be present at a location
of clustering in the CFHTLS-W1 galaxies, this adds cre-
dence to assumption that the clustering is present and at
the redshift of the XXL cluster being investigated.
As is to be expected, for all of the clusters for which a
red sequence was identiable in the CFHTLS-W1 galaxies
and apparent structure selectable in the VIPERS catalogue,
strong overdensities in the number of galaxies were present
at the locations of the clusters from the XXL catalogue.
Fig. 8 shows the four of these clusters which also demon-
strated overdensities in the number of galaxies on the sky
in the proximity of, but separate from, the XXL cluster
location following the selections made in accordance with
Ÿ3.1 and Ÿ3.2. These nearby overdensities are indicative of
clustering, but two questions need to be answered before
they can be dened as bone de satellites of the four C1
XXL clusters shown. The rst asks whether the overdensi-
ties correspond to a true clustering of galaxies in space or
whether the grouping on the sky is a coincidental result of
the galaxy selections made. The second asks whether the
characteristics of the identied cluster are reasonable and
in accordance with current theoretical understanding of the
growth of clusters. Both of these questions are discussed in
detail in subsequent subsections.
Page 9 of 17
Hunting for satellites of the most massive galaxy clusters
31.9 32.0 32.1 32.2 32.3 32.4
-4.7
-4.6
-4.5
-4.4
-4.3
CFHTLS-W1 galaxies
VIPERS galaxies
Cluster (n0286)
Dec(Deg)
RA (Deg)
31.9 32.0 32.1 32.2 32.3 32.4
-4.7
-4.6
-4.5
-4.4
-4.3
RA (deg)
Dec(deg)
0
1
2
3
4
5
6
7
8
9
10
Count
Fig. 7. Left: Distribution of galaxies on the sky in a 0.25deg2
area around class 1 XXL cluster, n0286 from the CFHTLS-W1
and VIPERS catalogues following selections made according to Ÿ3.2 and Ÿ3.1 respectively. CFHTLS-W1 galaxies are subject to a
magnitude restriction of iAB  23 and a double restriction in colour of 1.25  rAB −iAB  1.45 and −0.2  3.6µmAB −4.5µmAB 
0.2. The subset of VIPERS galaxies was constructed using a manual selection of structure. Right: Number density on the sky of
the selected galaxies using a square bin of 0.025deg.
3.4. Identifying potential satellite cluster X-ray sources
As discussed earlier, self-similarity dictates that the satellite
clusters this report attempts to identify must be composed
in structurally the same way as the massive XXL clusters
in question. This means ∼15% of their mass must be con-
tained in the hot, X-ray emitting intracluster medium. As
previously explained, likely clusters were conrmed from
the XXL source catalog based on a lower limit exclusion
in both source extension and extension likelihood and the
most massive clusters in the redshift range we are investi-
gating have source characteristics such that they are iden-
tied as class 1 XXL clusters. Identifying clusters in this
way has its limitations however, as in order for a cluster
source to be extended the cluster must not only have a
large physical size but also a signal well above ux limit
for the observations. With both radius and X-ray ux di-
rectly correlated to the mass of the cluster, it is clear that
lower mass clusters - such as the satellites of massive clus-
ters being searched for in this investigation - will unlikely
demonstrate X-ray signals good enough to be conrmed as
clusters from X-ray observations alone. X-ray sources from
the ICM of the most massive satellites should still be de-
tectable though, and with the locations of potential satel-
lites determined from the overdensities observed in Ÿ3.3, it
should be possible to identify any X-ray sources in the vicin-
ity of these galactic overdensities with a view to estimate
the mass of the satellites from their X-ray ux.
By plotting the full XXL X-ray source catalogue in
the RA-Dec plane, it was possible to identify sources in
the vicinity of the potential satellites for three of the four
clusters around which strong galactic overdensities were
present. For each cluster, a selection of any sources in, or
very close to, the identied potential satellites were taken.
The extent of the selected sources in arcseconds was plot-
ted against their respective extension likelihoods and the
sources with properties most resembling clusters (those
with the greatest extent and extension likelihood) were se-
lected as the most promising candidates for ICM signal.
Fig. 9 shows the position of these sources relative to the C1
and C2 XXL clusters, along with all the sources in the XXL
catalogue. In the case of the apparently diuse satellite near
cluster n0286, three potential sources were identied. It can
be suggested from inspection of Fig. 7 that the overdensity
near cluster n0286 can be split into at least two indepen-
dent potential satellites. X-ray sources 1 and 2 are located
in the vicinity of the upper overdensity, whilst source 3 is
located in the lower.
Assuming the sources are located the same distance
away from Earth as the host cluster, the cluster redshift
from the XXL catalogue can be used to calculate the lu-
minosity distance to the potential satellites (Wright 2006).
From this the X-ray luminosity L500 can be calculated from
the X-ray ux of the selected sources. Using equation (2) it
is then possible to deduce the mass of the satellite cluster
from which the source is assumed to originate. The calcu-
lated masses M500 of the potential satellite X-ray sources
identied earlier are shown and discussed in Ÿ3.5.1.
3.5. Investigating the validity of potential cluster systems
Now that potential satellite clusters have been identied
from galactic overdensities and the masses of said clusters
estimated from the ux of X-ray sources in their vicinity, it
is important to check whether the systems discovered are
physically valid. Investigations using the Millennium Simu-
lations were used to determine whether the mass and sepa-
ration of the potential satellites is reasonable and to verify
whether the observed occurrence rates of massive satellites
are in line with simulated predictions, whilst a method of
mass estimation using stellar ux ratios was used as a self-
consistency check to determine whether the X-ray sources
are likely to originate from the assumed satellite clusters.
Page 10 of 17
Thomas Wigg 2015 | Hunting for satellites of the most massive galaxy clusters
35.6 35.7 35.8 35.9 36.0
-4.6
-4.5
-4.4
-4.3
-4.2
Count
RA (deg)
Dec(deg)
0
2
4
6
8
10
12
14
16
18
d
z=0.6308; d ~ 6.23Mpc
35.4 35.5 35.6 35.7 35.8 35.9
-5.2
-5.1
-5.0
-4.9
-4.8
-4.7
Count
RA (deg)
Dec(deg)
0
1
2
3
4
5
6
7
d
z=0.8327; d ~ 5.04Mpc
31.9 32.0 32.1 32.2 32.3 32.4
-4.7
-4.6
-4.5
-4.4
-4.3
d
RA (deg)
Dec(deg)
0
1
2
3
4
5
6
7
8
9
10
Countz=0.7556; d ~ 3.31Mpc
30.8 30.9 31.0 31.1 31.2
-5.2
-5.1
-5.0
-4.9
-4.8
Count
RA (deg)
Dec(deg)
0
1
2
3
4
5
6
7
8
9
d
z=0.5202; d ~ 4.60Mpc
Fig. 8. Number density on the sky of a selection of galaxies from the CFHTLS-W1 and VIPERS catalogue in a 0.25deg2
area
around four selected XXL clusters, chosen using the techniques described in Ÿ3.1 and Ÿ3.2. Clockwise from top left, the XXL
clusters shown are n0019, n0064, n0260, n0286. The locations of the X-ray sources from the XXL catalogue corresponding to each
cluster are circled in white and the distance d between each cluster and the nearest overdensity are shown for scale, with the value
noted at the top left of each plot. A square bin of 0.025deg was used.
3.5.1. Mass and separation of satellites from the Millennium
Simulations
The Millennium I and Millennium II Simulations are N-
body simulations which plot the movement and growth of
dark matter haloes at discrete redshift snapshots from the
early universe through to the present day (0  z  15).
The masses of the clusters are inferred from their halo mass
and the history of each halo and its constituent parts are
recorded. To check whether the estimated satellite masses
and the separations from their host cluster are reasonable,
the ve nearest mass haloes at the nearest redshift snapshot
(this was within zcluster ± 0.15 in all cases) were taken and
the mass and separation of the most massive satellite cluster
recorded. Tab. 1 summarises these results and compares
them to the observed mass and separation of the satellites
determined in previous sections.
In almost all cases does the estimated satellite mass fall
within the predicted range and in cases where they do not,
the observed characteristics are extremely close to those de-
termined from the Millennium Simulations. In the case of
the separations, all satellites fall well within the discovered
range and within one standard deviation of the mean. Due
to the fact that only the ve nearest mass clusters were
taken from the simulations, the results shown here are by
no means extensive enough to disregard the X-ray sources
for which the satellite mass does not fall within the deter-
mined range; in the case of n0064, the estimated satellite
mass is only slightly greater than the upper limit on the
range from the simulations. Considering n0286, compari-
son to the range deduced from the simulations must be
Page 11 of 17
Hunting for satellites of the most massive galaxy clusters
Table 1. Comparison of observationally determined satellite (sat.) masses and separations (sep.) with those determined from the
Millennium Simulations. Potential satellite masses were estimated from the X-ray ux of sources assumed, but not conrmed, to
have originated from the satellite's ICM. For cluster n0286, the satellite masses from top to bottom were calculated from X-ray
sources 1, 2 and 3 respectively.
10
-3
10
-2
10
-1
10
0
10
1
10
2
10
3
10
-4
10
-3
10
-2
10
-1
10
0
10
1
10
2
10
3
10
4
XXL sources
C2 clusters
C1 clusters
Satellite sources
n0064
n0260
n0286
1
n0286
2
n0286
3
Extension Likelihood
Extent(arcsec)
Fig. 9. X-ray sources from the full XXL catalogue with sources
corresponding to class 1 (blue) and class 2 (red) clusters indi-
cated. A solid line at an extent of 15 arcseconds denes a lower
limit for both cluster classes, with a solid line at an extension
likelihood of 5 and dashed line at 33 establish the limits for
C2 and C1 clusters respectively. X-ray sources located in the
vicinity of the galactic overdensities corresponding to potential
satellite clusters identied in Ÿ3.3 are shown.
cautious as we are certainly considering at least the second
most massive satellite and potentially the third, depend-
ing on whether the galactic overdensity corresponds to two
or three discrete satellites. Given more time, a mean and
range of characteristics for the second and third most mas-
sive satellites of the Millennium Simulation clusters would
also be investigated and compared to those implied from
observation.
3.5.2. Estimating the satellite mass from stellar ux
In general, redshift information is not readily available from
X-ray pointings alone, with optical follow-up often needed
to determine the redshift of a cluster with any condence.
Yu et al. (2011), among others, have investigated the pos-
sibility of determining the redshift spectroscopically using
the ubiquitous Fe-line complex in the X-ray spectrum of
a cluster's ICM signal. To reliably determine a redshift in
this manner, higher resolution and longer pointings than
are generally available are necessary. For this reason, no
redshift information is available for the potential satellite
sources discussed earlier, meaning it cannot be condently
asserted that the signal truly originates from the ICM of
the potential satellite. With the additional galaxy uxes
in the 3.6µm and 4.5µm bands that the CFHTLS-W1 cat-
alogue provides, the total galactic ux of the cluster and
satellite in each of the two bands can be determined. Es-
kew et al. (2012) provide the following relation between the
total 3.6µm and 4.5µm uxes in Jy (F3.6 and F4.5 respec-
tively) and the total stellar mass of the cluster M∗,
M∗ = 105.65
F2.85
3.6 F−1.85
4.5
D
0.05
2
M (5)
where D is the luminosity distance to the cluster in Mpc.
Given the quoted masses of the conrmed clusters from
the XXL catalogue and by assuming that the ratio of stel-
lar mass to total mass of a cluster is constant, it is possible
to reach a mass estimate of the satellite based on galactic
emission alone. By comparing this mass estimate with that
deduced from the identied X-ray sources provides an ef-
fective, albeit far from rigorous, consistency check for the
validity of the calculated X-ray mass of the satellites: if the
ratio of the inferred X-ray mass to 3.6µm/4.5µm mass is
far from unity, this would suggest the satellite's ICM is not
responsible for the X-ray signal.
To determine the galaxies to include within the selection
for the clusters and their satellites, it seemed most appro-
Page 12 of 17
Thomas Wigg 2015 | Hunting for satellites of the most massive galaxy clusters
Table 2. Comparison of the satellite masses estimated from the
X-ray ux of the XXL sources thought to originate in the satel-
lite and the masses estimated from a calculation of their stellar
mass based on their 3.6µm and 4.5µm ux - the ratio shown is
between the latter and former mass estimates respectively. For
cluster n0286, the satellite masses from top to bottom corre-
spond to X-ray sources 1, 2 and 3 respectively.
priate to use the virial radii. The virial radii of the satel-
lites were calculated according to the method described in
Ÿ3.2 using the masses inferred from the potential satellite
X-ray sources; this again serves as an additional check for
self-consistency. Using these calculated radii along with the
virial radii of the XXL clusters determined earlier, a se-
lection of all the galaxies, already subject to the relevant
photometric cuts, inside the virial radius of each cluster and
its satellites was made. In the case of the satellites, the po-
sition of the X-ray source used to calculate its virial radius
was used as the cluster centre. Following this, the total ux
in both the 3.6µm and 4.5µm bands, calculated by summing
the individual ux from each of the galaxies, was used to
determine the stellar mass of the galaxies in the selection
for each cluster and their satellites using equation (5). An
estimate of the total satellite mass, based on the satellite's
and its host cluster's stellar mass was then calculated using
the ratio method described earlier.
Tab. 2 shows the resulting total mass estimates for the
satellites based on the X-ray ux of the sources thought
to originate from the satellite's ICM and the stellar mass
ratios independently, along with a ratio of these values for
comparison.
The fact that the resulting ratios do not fall close to
unity appears unfortunate for the continued assumption
that the satellites' ICM is responsible for the X-ray sources
used to calculate an estimate for their mass. However, due
to the sheer number of points at which error on the mass
estimate based on the stellar mass can be accumulated
throughout the calculations and conversions, a result of this
mass estimate being ∼ 9% to ∼ 321% of the mass calcu-
lated from the X-ray signal may actually be an encouraging
result. Again, this section of the investigation should not
hope to conrm with any certainty that the X-ray sources
selected do come from the satellite cluster, but instead iden-
tify any sources for which the X-ray mass estimate and the
mass calculated from the 3.6µm and 4.5µm uxes dier by
such an extreme amount that the source can be rejected; in
this case none of them appears too unreasonable to exclude
at this point.
3.5.3. Expected observed satellite occurrence rates from the
Millennium Simulations
The previous subsections have been useful in determining
whether the properties of the potential satellite clusters
discovered are reasonable. It is also of interest conrming
whether the occurrence rate of massive clusters and their
satellites detected is to be expected in the universe as it is
currently understood. Again, the Millennium Simulations
provide a unique opportunity to investigate the number of
these massive clusters with satellite companions that are
actually present in a universe modelled to represent ours.
Following the simulation of the growth of dark matter
haloes, twenty-four 1deg
2
light cones representing a view
of the sky from redshift 0 were produced and individual
galaxies were `painted' onto each halo in each cone us-
ing computer models of cluster structure. These provide a
unique opportunity of exploring a simulated universe from
a xed viewpoint, such as observations of the real universe
are made from Earth.
For each of eight light cones chosen at random a redshift
restriction of 0.5  z  0.9 was made and a subset of any
galaxies located in a containing cluster with a central virial
mass of greater than 1014
M was created. This limit was
chosen as the massive clusters chosen from the XXL survey
around which potential satellites were identied were of a
mass of this order of magnitude or greater. Once these most
massive clusters were identied, a further subset of galaxies
with central virial mass greater than 1013
M contained in a
0.25deg
2
square area of `sky' within a redshift cut of ±0.02
about the cluster centre was taken. An area of this size
was chosen as it corresponds directly to the area about
each XXL cluster within which satellites were searched for
whilst this redshift range was selected as any identiable
structure from the spectroscopic selections made in Ÿ3.1
was contained within this cut. A cuto mass of 1013
M
was used as this was the order of the lower limit on the
cluster mass estimated from the X-ray sources thought to
originate from the potential satellites. The RA-Dec plane
for each subset was then plotted and the number of satellite
clusters around each  1014
M cluster were recorded.
Tab. 3 shows a summary of the results from the sample
of eight light cones. This part of the investigation enabled
two important insights: rst a test of the rate of detection of
massive clusters from the XXL survey and second a check of
whether the number of satellites identied in this report is
reasonable. On the rst count, a total of 36 clusters of mass
 1014
M were identied, corresponding to a mean number
of 5 massive clusters per square degree, in the stated red-
shift range of 0.5  z  0.9. Compare this to the 11 XXL
clusters in the ∼8deg
2
overlap with the VIPERS region and
it is clear there is a discrepancy between the number pre-
dicted by the simulations and what is actually observed.
This suggests that the cluster catalogue produced by XXL
is not extensive, even for the most massive end of the clus-
ter population, for which their X-ray signal should be most
easily classied. This also supports the assertion that there
are still many unclassied cluster signals in the XXL source
catalogue, which was the assumption used when selecting
potential satellite X-ray signals. On the question of the fre-
quency of satellite systems, it quickly became apparent that
the number of satellites per cluster in the simulations far
exceeded that which we observed on the sky, with a mean
number of 5 satellites per cluster found across the eight
Page 13 of 17
Hunting for satellites of the most massive galaxy clusters
Table 3. The total and average number per square degree of
massive ( 1014
M ) clusters from a sample of eight 1deg2
light
cones produced from the Millennium Simulations. The average
number of satellite ( 1013
M ) clusters observed in a 0.25deg2
area of `sky' about each massive cluster is also shown.
cones. With 1 conrmed (see Ÿ4.2) and 5 likely satellites
identied around 4 of the 11 XXL clusters investigated, the
results from the simulations may seem irreconcilably dier-
ent. However, when identifying potential satellites, only the
greatest overdensity around each XXL cluster was investi-
gated. Looking back to Fig. 8, it is clear there is more than
one area of overdensity present in the vicinity of most of the
clusters, each of which could correspond to an additional
satellite cluster. This highlights an issue in the method and
suggests that it would advantageous to return to each of the
chosen clusters and investigate these further overdensities
in the same way as the potential satellites identied in order
to more eectively compare the rate of satellite occurrence
with observation. This does not, however, account for the
fact that around every one of the 36 massive clusters in the
simulations was there at least one satellite. Of the clusters
for which it was possible to identify a red sequence and com-
bine this selection with the VIPERS subset, of which there
were 6, 4 showed apparent satellites in their vicinity. Whilst
this rate is markedly lower than the simulations, with such
a small sample size of XXL clusters it is dicult to make
any further comment of whether the simulations and ob-
servations truly contradict. Note this section includes the
count of the C2 (n0211) satellite found in the vicinity of C1
cluster n0219, discussed in Ÿ4.2 for more accurate compar-
ison between the observations and simulations.
4. Discussion
4.1. Sources of uncertainty and potential improvements
The nature of this project means that areas of potential er-
ror incursion are numerous. With regard to the galaxy cat-
alogues used, the area of sky surveyed is not continuous for
either catalogue, with the VIPERS region split into many
distinct rectangular regions with signicant gaps between.
This means there are times when combining selections that
an area of interest falls in or near a gap in the VIPERS
range. The sampling rate for neither survey is complete,
with the sampling rate of the VIPERS catalogue uctuat-
ing around a redshift-variable value of ∼ 40% (Guzzo et al.
2014). Both of these factors mean that the view of sky inves-
tigated, whilst still very useful in the search for structure,
is incomplete and as such there is the potential for unseen
systems.
Despite this, the redshift information provided by the
VIPERS catalogue is incredibly precise and provides one
of the most useful tools in the search for cluster sys-
tems: it is not only possible to identify clustering in the
three-dimensional distribution of VIPERS galaxies, but to
conrm the presence of true galactic overdensities in the
CFHTLS-W1 catalogue which are only inferred by selec-
tion.
When making selections in the CFHTLS-W1 catalogue
by locating the red sequence, a horizontal cut in colour was
made. This was discussed earlier, with a comment made on
the diculty of identifying the red sequence, let alone its
slope, when any selection of cluster members was inherently
polluted by eld galaxies. Gladders  Yee (2000) use the
CRS (cluster red sequence) algorithm to identify the red se-
quence computationally. It would be interesting to attempt
the identication of the red sequences of the XXL clusters
investigated in this paper in the CFHTLS-W1 catalogue
using the CRS algorithm. If successful, it would provide a
more rigorous method of identication and would allow se-
lections to be made about the slope of the sequence, though
the ratio of sequence galaxies to eld galaxies in the cluster
region may prove problematic.
The nature of binning galaxies when combining the
CFHTLS-W1 and VIPERS selections means that, should
a satellite cluster straddle the border between two or more
bins, it will appear less overdense than if the cluster were
central in a bin, meaning the potential for missed identi-
cation of true satellites was present. Another issue faced
was the fact that x-y binning has the eect of smoothing the
data along those principal axes. This means that identifying
whether larger satellites are truly extended or in fact multi-
ple discrete clusters and locating any lamentary structure
is inherently dicult. The eect of this was minimised by
plotting the number density of galaxies using a variety of
bin sizes and identifying overdensities in each case.
When attempting to identify X-ray sources originating
from the potential satellites, the obvious issue is that with-
out any redshift information about the source, there is no
way of knowing whether it is truly the signal from the clus-
ter's ICM or a chance projection along the line of sight. The
masses estimated from the sources seem encouraging, but
the majority of the sources in the region of sky investigated
are in an X-ray ux range that would produce a reason-
able estimated cluster mass using equation 2. For this rea-
son, calculating an estimate for the mass is more useful in
identifying sources which are obviously too bright to orig-
inate from a cluster and can therefore be excluded. How-
ever, when considering the position of the potential satellite
sources in the extent-extension likelihood plane (see Fig. 9),
their proximity to the conrmation threshold, especially in
the case of the three sources identied for n0286, suggests
they are extended sources and is further evidence in sup-
port of the assumption they are cluster signals. It is worth
noting however, the uncertainty in X-ray-based cluster de-
tection; with such a wide variety of X-ray sources in the
universe, many of which displaying emission similar to that
of a cluster, conrmation through other detection methods
is often required to classify a cluster with condence. The
XXL sources identied as class 2 clusters have a ∼50% pos-
sibility of in fact originating from an AGN (Pierre  XXL
Consortium 2014).
The ability to compare the characteristics of the po-
tential satellites with the properties of similar cluster sys-
tems from the Millennium Simulations is advantageous, but
the small sample size means that excluding any anomalous
systems would only have been possible should the satellite
mass estimate and/or separation from its massive compan-
ion have fallen well outside the range recorded from the sim-
Page 14 of 17
Thomas Wigg 2015 | Hunting for satellites of the most massive galaxy clusters
ulations; in the case of all systems investigated, the proper-
ties of the potential satellites fall in or very near this range
and are therefore deemed reasonable. Given more time, a
more extensive list of similar systems from the simulations
would have been created such that any anomalous observa-
tions could be more easily identied.
Estimating the satellite mass using the mass ratios cal-
culated from the stellar ux was intended to provide a useful
self-consistency check for the selected potential satellite X-
ray sources and whilst, again, it allows the identication of
any sources which are obviously too bright, inherent aws
in the method mean that error is inccured at almost every
step. As mentioned, the sampling rate for the CFHTLS-W1
catalogue is not complete, and further to this, only galaxies
for which 3.6 and 4.5 micron uxes are recorded were avail-
able. In the case of the ratio method used, this will only
leave the satellite mass estimate unaected if the ratio of
galaxies for which 3.6/4.5 micron data is available to the
total number of galaxies is identical for the satellite and its
massive companion: an assumption which will inevitably
incur a varying amount of error for each of the identied
systems. The same is true when considering the photomet-
ric restrictions made in Ÿ3.1: the ratio is only consistent
provided the proportion of the number and ux of galax-
ies selected between the satellite and conrmed cluster is
indicative of the true ratio of these quantities. The eect
of background counts of eld galaxies projected along the
line of sight when selecting cluster members was also ne-
glected, which will cause an over-estimation of the satellite
mass. It would be more rigorous to determine and subtract
an average background ux from the total stellar ux of
the clusters before calculating their mass. However, with
the other sources of error incurred and the relatively low
background galaxy count, this will be of negligible eect.
When determining the number of massive clusters and
companion satellites from the Millennium Simulation light
cones, deciding clusters to include in each count posed an is-
sue. When using the simulations the information about each
galaxy's containing structure, and the mass of the cluster
of which it is a member, is readily available; this is evi-
dently not the case for real observations. For this reason,
only satellites in the simulations with galaxy densities in
excess of around ve per square arcminute were counted,
corresponding to the lower limit of the bin density seen for
the potential satellites identied. Despite this, this makes
no correction for the fact that the Millennium Simulations
are an extensive galaxy population, not subject to any of
the survey sampling rates or selections made from the cata-
logues in this investigation. This goes some way to explain-
ing the increased number of massive clusters with compan-
ion satellites recorded from the simulations. This nal part
of the investigation would be improved by making appro-
priate corrections for the selection eects intrinsic of real
observations.
4.2. Conrming potential satellites and a comment on
method
This investigation aimed to identify satellite clusters of
more massive, X-ray detected clusters; has this aim been
fullled? The project combined many techniques for dis-
covering satellites and determining the validity of the po-
tential cluster systems identied, none of which alone is
enough to conrm the presence of the satellites discovered.
Many of the satellite properties determined are also subject
to large potential error or operate under bold assumption
and are therefore of use only to exclude obviously anoma-
lous systems. However, with all the information provided
by these techniques, it can be stated that no single piece of
evidence contradicts the claim that 5 satellite clusters have
been discovered around 3 conrmed XXL clusters, and the
combination of all of the determined properties and com-
parison with simulated expectations alludes to the true ex-
istence of the potential systems identied. This is especially
true for cluster n0286, whose three identied satellites all
have potential X-ray sources with extent above and exten-
sion likelihood very close to the XXL cluster conrmation
threshold. In order to conrm with any certainty the pres-
ence of these satellites, longer X-ray pointings or follow-up
observations to determine the velocity dispersions of the
member galaxies are required.
A nal comment on the method of galaxy selection is
provided by the cluster system in Fig. 10. The subset of
CFHTLS-W1 galaxies shown was selected as usual by iden-
tifying the red sequence of the class 1 XXL cluster n0219,
which has a mass of M500 = 12.8 × 10¹³
M located at red-
shift z = 0.6265. When the corresponding double colour
cut was made, a strong overdensity at the location of class
2 XXL cluster n0211, with a mass of M500 = 7.56×10¹³
M
at redshift z = 0.6090, a distance of ∼ 6.44Mpc from n0219
was identied. A selection of VIPERS galaxies in redshift
was made with a slightly larger range to encompass both
clusters and their likely surrounding structure, with strong
overdensities apparent at the positions of the two clusters
also. Returning to the Millennium Simulations, identifying
the ve nearest mass haloes to that of n0219 and recording
the mass and separation of the most massive satellite, the
cluster system shown in Fig. 10 is of reasonable properties
to suggest that the two clusters will eventually undergo a
merger. At the very least, it can be said that this system is
exactly of the type this investigation has been attempting
to identify. This supports the fact that the satellite systems
being searched for do exist and that it is the technical lim-
itations of the observations that restrict their discovery -
cluster n0211 happens to have source characteristics such
that it can be identied from the X-ray signal of its ICM
alone. More encouragingly though, it also supports the va-
lidity of the red sequence method, not only to identify the
cluster itself, but also any surrounding satellites formed at
the same cosmic epoch.
4.3. Future
With such a limited area of sky as was available for this
investigation, attempting any sort of statistics regarding
occurrence rates and characteristic properties of satellite
systems is dicult: only 11 XXL clusters in the redshift
range were examined and of these only 3 (4 including
n0219) show evidence of likely companion satellites. The
extended ROentgen Survey with an Imaging Telescope Ar-
ray (eROSITA) is a revolutionary new observatory due to
launch in 2016, designed to probe the entire X-ray sky with
unprecedented spectral and angular resolution out to red-
shifts z  1: mapping in the soft band (0.5-2keV) will be
twenty times more sensitive than the ROSAT all-sky survey
whilst in the hard band (2-10keV) it will provide the rst
ever true imaging survey of the sky at that energy (Merloni
et al. 2012). The mission has many goals, most relevant of
Page 15 of 17
Hunting for satellites of the most massive galaxy clusters
37.0 37.1 37.2 37.3 37.4 37.5
-4.9
-4.8
-4.7
-4.6
-4.5
Count
RA (deg)
Dec(deg)
0
2
4
6
8
10
12
14
16
z
1
=0.6265, z
2
=0.6090; d ~ 6.44Mpc
d
Fig. 10. Number density on the sky of a selection of galaxies
from the CFHTLS-W1 and VIPERS catalogues in a 0.25deg2
area around around XXL clusters n0219 (class 1; left) and n0211
(class 2; right). The selections were made according to Ÿ3.1 and
Ÿ3.2 using n0219 as the reference cluster. The locations of the
X-ray sources from the XXL catalogue corresponding to each
cluster are circled in white and the distance d between the two
clusters is shown for scale, corresponding to a physical separa-
tion of ∼ 6.44Mpc. A square bin of 0.025deg was used.
which is the predicted identication of ∼ 105
new galaxy
clusters.
The all-sky nature of eROSITA's planned survey has
many distinct advantages. With the entire sky surveyed to
a depth comparable to XXL, the geometry of large-scale
structure in the universe will be accurately determined and
with the predicted discovery of so many new clusters, pro-
ducing rigorous statistics about the distribution of matter
and its containing systems will, for the rst time, become a
possible reality. With over 40,000deg
2
of sky mapped (com-
pared to the ∼ 8deg
2
of this investigation), eROSITA will
also nd intrinsically rare objects. With its improved reso-
lution, eROSITA will also be able to better identify cluster
signals from the population of AGN and other X-ray sources
in the universe. For these reasons, eROSITA will allow the
rst real possibility of comparing the large-scale distribu-
tion of matter in the universe with modelled predictions
such as those provided by the Millennium Simulations.
eROSITA should not only detect many systems like that
of n0219/n0211 shown in Fig. 10, but also clusters whose
satellites currently fall below the detection threshold of cur-
rent observations. This will allow some insight into the dis-
tribution of mass around larger clusters and also allow cal-
culations of the percentage of mass contained in observable
cluster satellites to be made. The method of satellite iden-
tication developed in this investigation will not be made
redundant however, as utilising a combination of techniques
such as in this paper will prove valuable in situations when
a single observational technique is insucient to conrm
the presence of a cluster. However, it is a time-consuming
method which requires good coverage in both optical pho-
tometric and spectroscopic galaxy, and deep eld X-ray ob-
servations. With minor improvements made according to
the issues identied, the techniques described in this paper
should still provide an eective means of satellite cluster
identication when X-ray observations alone are insucient
to conrm their existence, but in the case of combining it
with data from the eROSITA observatory, it will likely have
to be restricted to points of interest as applying this tech-
nique to the whole sky is not practically valid.
5. Summary
The project utilised a sample of 11 clusters from the XMM-
XXL cluster survey in the redshift range 0.5  z  0.9
found in the overlap region of the VIPERS and CFHTLS-
W1 galaxy catalogues. Using the spectroscopic redshift in-
formation of the VIPERS catalogue and photometric data
of the CFHTLS-W1 catalogue to create a subset of galaxies
about each cluster likely to be part of the conrmed cluster
or any surrounding undetected clusters, potential satellites
were identied by looking for overdensities in the number
of galaxies when combining these selections. Sources from
the full XXL catalogue thought to originate from any satel-
lites were selected and mass estimates calculated based on
their X-ray ux. The validity of any identied systems was
then investigated through comparison with similar systems
from the Millennium Simulations and an additional mass
estimate calculated based on the stellar ux of each satel-
lite and its more massive companion - the latter also acting
as a check of self-consistency of the satellites' potential X-
ray sources. Finally, using light cones from the Millennium
Simulations the occurrence rate of cluster systems detected
with apparent satellites and the number of these associated
satellites around each cluster was compared to expected
rates predicted by the computer models.
In total, 5 potential satellites around 3 of the XXL clus-
ters in addition to a C2 satellite of a more massive C1
cluster were identied, all of which have masses and sep-
arations from their companion cluster deemed reasonable
following comparison with the simulations. The masses es-
timated from the stellar ux were subject to large errors
and as such provided little use other than to identify any
extremely anomalous properties, of which there appeared to
be none. Finally, the rate of clusters with companion satel-
lites and the number of satellites per cluster both appeared
much greater in the simulations than real observations -
this was attributed to the incomplete sampling rate of the
galaxy surveys used, the diuse nature of satellites in the
simulation and selection eects intrinsic of the techniques
employed. Follow-up observations would be required to con-
rm the presence of the potential satellites, as this was not
possible with the information gathered in this investigation
alone; though no single piece of evidence suggests the satel-
lite candidates found are not true clusters.
Little rigorous statistical insight has been possible with
such a small sample size, however the launch of the all-sky
eROSITA X-ray observatory should provide a more than
sucient population of galaxy clusters to investigate and
allow truly eective comparison between simulation and
observation.
Acknowledgements. I would like to thank my partner, J. Ider
Chitham, for his continuous input to the project, along with Prof
M. Bremer, Dr B. Maughan, Miss K. Husband and Dr M. Taylor for
guidance throughout the duration of the investigation.
Page 16 of 17
Thomas Wigg 2015 | Hunting for satellites of the most massive galaxy clusters
References
Abell, G. O. 1958, Astrophys. J. Suppl. Ser., 3, 211
Abell, G. O., Corwin, Harold G., J.,  Olowin, R. P. 1989, Astrophys.
J. Suppl. Ser., 70, 1
Abraham, R. G., Valdes, F., Yee, H. K. C.,  van den Bergh, S. 1994,
Astrophys. J., 432, 75
Allen, S. W., Schmidt, R. W.,  Fabian, A. C. 2002, Mon. Not. R.
Astron. Soc., 334, L11
Balogh, M. L., Christlein, D., Zabludo, A. I.,  Zaritsky, D. 2001,
Astrophys. J., 557, 117
Barger, A. J., Aragon-Salamanca, A., Smail, I., et al. 1998, Astrophys.
J., 501, 522
Bartelmann, M.  Schneider, P. 1999 [arXiv:9912508]
Birkinshaw, M. 1991, Phys. Cosmol.
Birkinshaw, M. 1999, Phys. Rep., 310, 97
Bower, R., Lucey, J.,  Ellis, R. 1992, Mon. Not. R. Astron. Soc., 254
Boylan-Kolchin, M., Springel, V., White, S. D. M., Jenkins, A., 
Lemson, G. 2009, Mon. Not. R. Astron. Soc., 398, 1150
Carlstrom, J. E., Ade, P. A. R., Aird, K. A., et al. 2009
[arXiv:0907.4445]
Carlstrom, J. E., Joy, M. K., Grego, L., et al. 2000, Phys. Scr., T85,
148
Chwolson, O. 1924, Astron. Nachrichten, 221
Clerc, N., Adami, C., Lieu, M., et al. 2014, Mon. Not. R. Astron. Soc.,
21, 1
Czakon, N., Donahue, M., Medezinski, E., CLASH,  Bolocam. 2014,
Am. Astron. Soc.
De Lucia, G.  Blaizot, J. 2007, Mon. Not. R. Astron. Soc., 375, 2
Dressler, A., Oemler, Â Augustus, J., Couch, W., et al. 1997, Astro-
phys. J., 490, 577
Einstein, A. 1936, Science, 84, 506
Eskew, M. R., Zaritsky, D. F.,  Meidt, S. E. 2012, Astron. J., 143,
139
Fabricant, D., Lecar, M.,  Gorenstein, P. 1980, Astrophys. J., 241,
552
Fakhouri, O., Ma, C.-P.,  Boylan-Kolchin, M. 2010, Mon. Not. R.
Astron. Soc., 406, 2267
Fowler, J. W., Niemack, M. D., Dicker, S. R., et al. 2007, Appl. Opt.,
46, 3444
Garilli, B., Guzzo, L., Scodeggio, M., et al. 2014, Astron. Astrophys.,
562, A23
Giodini, S., Lovisari, L., Pointecouteau, E., et al. 2013, Space Sci.
Rev., 177, 247
Gladders, M. D., Lopez-Cruz, O., Yee, H. K. C.,  Kodama, T. 1998,
Astrophys. J., 501, 571
Gladders, M. D.  Yee, H. K. C. 2000, Astron. J., 120, 2148
Guzzo, L., Scodeggio, M., Garilli, B., et al. 2014, Astron. Astrophys.,
566, A108
Hagino, K., Stawarz, L., Siemiginowska, A., et al. 2015, eprint
arXiv:1503.07244
Herschel, W. 1785, Philos. Trans. R. Soc. London, 75, 213
Hu, W.  Kravtsov, A. V. 2003, Astrophys. J., 584, 702
Hudelot, P., Cuillandre, J.-C., Withington, K., et al. 2012, VizieR
On-line Data Cat. II/317. Orig. Publ. 2012yCat.2317....0H
Kato, Y., Nakazawa, K., Gu, L., et al. 2015, eprint arXiv:1504.02708
Kravtsov, A. V. 2013, Astrophys. J., 764, 5
Laporte, C. F. P., White, S. D. M., Naab, T.,  Gao, L. 2013, Mon.
Not. R. Astron. Soc., 435, 901
Lidman, C., Iacobuta, G., Bauer, A. E., et al. 2013, Mon. Not. R.
Astron. Soc., 433, 825
Mather, J. C., Cheng, E. S., Eplee, R. E., J., et al. 1990, Astrophys.
J., 354, L37
McBride, J., Fakhouri, O.,  Ma, C.-P. 2009, Mon. Not. R. Astron.
Soc., 398, 1858
Mehrtens, N., Romer, A. K., Hilton, M., et al. 2012, Mon. Not. R.
Astron. Soc., 423, 1024
Menanteau, F., González, J., Juin, J.-B., et al. 2010, Astrophys. J.,
723, 1523
Merloni, A., Predehl, P., Becker, W., et al. 2012, eprint
arXiv:1209.3114, 84
Messier, C. 1781, Connoissance des Temps 1784, 227
Mitchell, R., Culhane, J., Davison, P.,  Ives, J. 1976, Mon. Not. R.
Astron. Soc., 175
Mo, H., van den Bosch, F.,  White, S. 2010, Galaxy Formation and
Evolution (Cambridge: Cambridge University Press)
Navarro, J., Frenk, C., White, S., et al. 1997, Astrophys. J., 490, 493
Neumann, D. M.  Arnaud, M. 2001, Astron. Astrophys., 373, L33
Pacaud, F., Pierre, M., Refregier, A., et al. 2006, Mon. Not. R. Astron.
Soc., 372, 578
Pierre, M., Pacaud, F., Juin, J. B., et al. 2011, Mon. Not. R. Astron.
Soc., 414, 1732
Pierre, M.  XXL Consortium. 2014, X-ray Universe 2014
Piaretti, R., Arnaud, M., Pratt, G. W., Pointecouteau, E.,  Melin,
J.-B. B. 2010, Astron. Astrophys., 534, 17
Planck Collaboration. 2013, eprint arXiv:1303.5089, 42
Press, W. H.  Schechter, P. 1974, Astrophys. J., 187, 425
Reichardt, C. L., Stalder, B., Bleem, L. E., et al. 2012, 22
Sandage, A., Binggeli, B.,  Tammann, G. A. 1985, Astron. J., 90,
1759
Sarazin, C. L. 1988, X-ray emission from clusters of galaxies (Cam-
bridge: Cambridge Astrophysics Series, Cambridge University
Press)
Schade, D., Barrientos, L. F.,  López-Cruz, O. 1997, Astrophys. J.,
477, L17
Schechter, P. 1976, Astrophys. J., 203, 297
Springel, V., White, S. D. M., Jenkins, A., et al. 2005, Nature, 435,
629
Storm, E., Jeltema, T. E.,  Rudnick, L. 2015, Mon. Not. R. Astron.
Soc., 448, 2495
Sunyaev, R. A.  Zel'dovich, Y. B. 1970, Astrophys. Space Sci., 7
Sunyaev, R. A.  Zel'dovich, Y. B. 1972, Comments Astrophys. Sp.
Phys., 4
Tauber, J. A., Mandolesi, N., Puget, J.-L., et al. 2010, Astron. Astro-
phys., 520, A1
van Dokkum, P. G., Franx, M., Kelson, D. D.,  Illingworth, G. D.
1998, Astrophys. J., 504, L17
Vanderlinde, K., Crawford, T. M., de Haan, T., et al. 2010, Astrophys.
J., 722, 19
Voit, G. 2005, Rev. Mod. Phys., 77, 207
Weymann, R. 1965, Phys. Fluids, 8, 2112
Weymann, R. 1966, Astrophys. J., 145, 560
Wright, E. 2006, Publ. Astron. Soc. Pacic, 118, 1711
Yu, H., Tozzi, P., Borgani, S., Rosati, P.,  Zhu, Z.-H. 2011, Astron.
Astrophys., 529, A65
Zhang, B., David, L., Jones, C., et al. 2015, eprint arXiv:1503.07694
Zwicky, F. 1933, Helv. Phys. Acta, 6, 110
Zwicky, F. 1937, Astrophys. J., 86, 217
Page 17 of 17

Mais conteúdo relacionado

Mais procurados

A spectroscopic sample_of_massive_galaxies
A spectroscopic sample_of_massive_galaxiesA spectroscopic sample_of_massive_galaxies
A spectroscopic sample_of_massive_galaxiesSérgio Sacani
 
First identification of_direct_collapse_black_holes_candidates_in_the_early_u...
First identification of_direct_collapse_black_holes_candidates_in_the_early_u...First identification of_direct_collapse_black_holes_candidates_in_the_early_u...
First identification of_direct_collapse_black_holes_candidates_in_the_early_u...Sérgio Sacani
 
Too much pasta_for_pulsars_to_spin_down
Too much pasta_for_pulsars_to_spin_downToo much pasta_for_pulsars_to_spin_down
Too much pasta_for_pulsars_to_spin_downSérgio Sacani
 
Cold clumpy accretion_toward_an_active_supermasive_black_hole
Cold clumpy accretion_toward_an_active_supermasive_black_holeCold clumpy accretion_toward_an_active_supermasive_black_hole
Cold clumpy accretion_toward_an_active_supermasive_black_holeSérgio Sacani
 
Detection of lyman_alpha_emission_from_a_triply_imaged_z_6_85_galaxy_behind_m...
Detection of lyman_alpha_emission_from_a_triply_imaged_z_6_85_galaxy_behind_m...Detection of lyman_alpha_emission_from_a_triply_imaged_z_6_85_galaxy_behind_m...
Detection of lyman_alpha_emission_from_a_triply_imaged_z_6_85_galaxy_behind_m...Sérgio Sacani
 
The Internal Structure of Asteroid (25143) Itokawa as Revealed by Detection o...
The Internal Structure of Asteroid (25143) Itokawa as Revealed by Detection o...The Internal Structure of Asteroid (25143) Itokawa as Revealed by Detection o...
The Internal Structure of Asteroid (25143) Itokawa as Revealed by Detection o...WellingtonRodrigues2014
 
Deep chandra observations_of_pictor_a
Deep chandra observations_of_pictor_aDeep chandra observations_of_pictor_a
Deep chandra observations_of_pictor_aSérgio Sacani
 
Detection of solar_like_oscillations_in_relies_of_the_milk_way_asteroseismolo...
Detection of solar_like_oscillations_in_relies_of_the_milk_way_asteroseismolo...Detection of solar_like_oscillations_in_relies_of_the_milk_way_asteroseismolo...
Detection of solar_like_oscillations_in_relies_of_the_milk_way_asteroseismolo...Sérgio Sacani
 
The canarias einstein_ring_a_newly_discovered_optical_einstein_ring
The canarias einstein_ring_a_newly_discovered_optical_einstein_ringThe canarias einstein_ring_a_newly_discovered_optical_einstein_ring
The canarias einstein_ring_a_newly_discovered_optical_einstein_ringSérgio Sacani
 
Distances luminosities and_temperatures_of_the_coldest_known_substelar_objects
Distances luminosities and_temperatures_of_the_coldest_known_substelar_objectsDistances luminosities and_temperatures_of_the_coldest_known_substelar_objects
Distances luminosities and_temperatures_of_the_coldest_known_substelar_objectsSérgio Sacani
 
ASTRONOMICAL OBJECTS DETECTION IN CELESTIAL BODIES USING COMPUTER VISION ALGO...
ASTRONOMICAL OBJECTS DETECTION IN CELESTIAL BODIES USING COMPUTER VISION ALGO...ASTRONOMICAL OBJECTS DETECTION IN CELESTIAL BODIES USING COMPUTER VISION ALGO...
ASTRONOMICAL OBJECTS DETECTION IN CELESTIAL BODIES USING COMPUTER VISION ALGO...csandit
 
The event horizon_of_m87
The event horizon_of_m87The event horizon_of_m87
The event horizon_of_m87Sérgio Sacani
 
A Neutron Star with a Massive Progenitor in Westerlund 1
A Neutron Star with a Massive Progenitor in Westerlund 1A Neutron Star with a Massive Progenitor in Westerlund 1
A Neutron Star with a Massive Progenitor in Westerlund 1GOASA
 
The laniakea supercluster_of_galaxies
The laniakea supercluster_of_galaxiesThe laniakea supercluster_of_galaxies
The laniakea supercluster_of_galaxiesSérgio Sacani
 
The shadow _of_the_flying_saucer_a_very_low_temperature_for_large_dust_grains
The shadow _of_the_flying_saucer_a_very_low_temperature_for_large_dust_grainsThe shadow _of_the_flying_saucer_a_very_low_temperature_for_large_dust_grains
The shadow _of_the_flying_saucer_a_very_low_temperature_for_large_dust_grainsSérgio Sacani
 
The open cluster_ngc6520_and_the_nearby_dark_molecular_cloud_barnard_86
The open cluster_ngc6520_and_the_nearby_dark_molecular_cloud_barnard_86The open cluster_ngc6520_and_the_nearby_dark_molecular_cloud_barnard_86
The open cluster_ngc6520_and_the_nearby_dark_molecular_cloud_barnard_86Sérgio Sacani
 
A massive pulsar_in_a_compact_relativistic_binary
A massive pulsar_in_a_compact_relativistic_binaryA massive pulsar_in_a_compact_relativistic_binary
A massive pulsar_in_a_compact_relativistic_binarySérgio Sacani
 
A population of faint low surface brightness galaxies in the Perseus cluster ...
A population of faint low surface brightness galaxies in the Perseus cluster ...A population of faint low surface brightness galaxies in the Perseus cluster ...
A population of faint low surface brightness galaxies in the Perseus cluster ...Sérgio Sacani
 

Mais procurados (20)

A spectroscopic sample_of_massive_galaxies
A spectroscopic sample_of_massive_galaxiesA spectroscopic sample_of_massive_galaxies
A spectroscopic sample_of_massive_galaxies
 
First identification of_direct_collapse_black_holes_candidates_in_the_early_u...
First identification of_direct_collapse_black_holes_candidates_in_the_early_u...First identification of_direct_collapse_black_holes_candidates_in_the_early_u...
First identification of_direct_collapse_black_holes_candidates_in_the_early_u...
 
Too much pasta_for_pulsars_to_spin_down
Too much pasta_for_pulsars_to_spin_downToo much pasta_for_pulsars_to_spin_down
Too much pasta_for_pulsars_to_spin_down
 
Cold clumpy accretion_toward_an_active_supermasive_black_hole
Cold clumpy accretion_toward_an_active_supermasive_black_holeCold clumpy accretion_toward_an_active_supermasive_black_hole
Cold clumpy accretion_toward_an_active_supermasive_black_hole
 
Detection of lyman_alpha_emission_from_a_triply_imaged_z_6_85_galaxy_behind_m...
Detection of lyman_alpha_emission_from_a_triply_imaged_z_6_85_galaxy_behind_m...Detection of lyman_alpha_emission_from_a_triply_imaged_z_6_85_galaxy_behind_m...
Detection of lyman_alpha_emission_from_a_triply_imaged_z_6_85_galaxy_behind_m...
 
The Internal Structure of Asteroid (25143) Itokawa as Revealed by Detection o...
The Internal Structure of Asteroid (25143) Itokawa as Revealed by Detection o...The Internal Structure of Asteroid (25143) Itokawa as Revealed by Detection o...
The Internal Structure of Asteroid (25143) Itokawa as Revealed by Detection o...
 
Deep chandra observations_of_pictor_a
Deep chandra observations_of_pictor_aDeep chandra observations_of_pictor_a
Deep chandra observations_of_pictor_a
 
Detection of solar_like_oscillations_in_relies_of_the_milk_way_asteroseismolo...
Detection of solar_like_oscillations_in_relies_of_the_milk_way_asteroseismolo...Detection of solar_like_oscillations_in_relies_of_the_milk_way_asteroseismolo...
Detection of solar_like_oscillations_in_relies_of_the_milk_way_asteroseismolo...
 
The canarias einstein_ring_a_newly_discovered_optical_einstein_ring
The canarias einstein_ring_a_newly_discovered_optical_einstein_ringThe canarias einstein_ring_a_newly_discovered_optical_einstein_ring
The canarias einstein_ring_a_newly_discovered_optical_einstein_ring
 
Distances luminosities and_temperatures_of_the_coldest_known_substelar_objects
Distances luminosities and_temperatures_of_the_coldest_known_substelar_objectsDistances luminosities and_temperatures_of_the_coldest_known_substelar_objects
Distances luminosities and_temperatures_of_the_coldest_known_substelar_objects
 
ASTRONOMICAL OBJECTS DETECTION IN CELESTIAL BODIES USING COMPUTER VISION ALGO...
ASTRONOMICAL OBJECTS DETECTION IN CELESTIAL BODIES USING COMPUTER VISION ALGO...ASTRONOMICAL OBJECTS DETECTION IN CELESTIAL BODIES USING COMPUTER VISION ALGO...
ASTRONOMICAL OBJECTS DETECTION IN CELESTIAL BODIES USING COMPUTER VISION ALGO...
 
The event horizon_of_m87
The event horizon_of_m87The event horizon_of_m87
The event horizon_of_m87
 
Nature12887
Nature12887Nature12887
Nature12887
 
A Neutron Star with a Massive Progenitor in Westerlund 1
A Neutron Star with a Massive Progenitor in Westerlund 1A Neutron Star with a Massive Progenitor in Westerlund 1
A Neutron Star with a Massive Progenitor in Westerlund 1
 
The laniakea supercluster_of_galaxies
The laniakea supercluster_of_galaxiesThe laniakea supercluster_of_galaxies
The laniakea supercluster_of_galaxies
 
The shadow _of_the_flying_saucer_a_very_low_temperature_for_large_dust_grains
The shadow _of_the_flying_saucer_a_very_low_temperature_for_large_dust_grainsThe shadow _of_the_flying_saucer_a_very_low_temperature_for_large_dust_grains
The shadow _of_the_flying_saucer_a_very_low_temperature_for_large_dust_grains
 
The open cluster_ngc6520_and_the_nearby_dark_molecular_cloud_barnard_86
The open cluster_ngc6520_and_the_nearby_dark_molecular_cloud_barnard_86The open cluster_ngc6520_and_the_nearby_dark_molecular_cloud_barnard_86
The open cluster_ngc6520_and_the_nearby_dark_molecular_cloud_barnard_86
 
Nature12888
Nature12888Nature12888
Nature12888
 
A massive pulsar_in_a_compact_relativistic_binary
A massive pulsar_in_a_compact_relativistic_binaryA massive pulsar_in_a_compact_relativistic_binary
A massive pulsar_in_a_compact_relativistic_binary
 
A population of faint low surface brightness galaxies in the Perseus cluster ...
A population of faint low surface brightness galaxies in the Perseus cluster ...A population of faint low surface brightness galaxies in the Perseus cluster ...
A population of faint low surface brightness galaxies in the Perseus cluster ...
 

Semelhante a tw1979_final_report_ref_correct

Stellar tidal streams_in_spiral_galaxies_of_the_local_volume
Stellar tidal streams_in_spiral_galaxies_of_the_local_volumeStellar tidal streams_in_spiral_galaxies_of_the_local_volume
Stellar tidal streams_in_spiral_galaxies_of_the_local_volumeSérgio Sacani
 
The Sparkler: Evolved High-redshift Globular Cluster Candidates Captured by JWST
The Sparkler: Evolved High-redshift Globular Cluster Candidates Captured by JWSTThe Sparkler: Evolved High-redshift Globular Cluster Candidates Captured by JWST
The Sparkler: Evolved High-redshift Globular Cluster Candidates Captured by JWSTSérgio Sacani
 
The physical conditions_in_a_pre_super_star_cluster_molecular_cloud_in_the_an...
The physical conditions_in_a_pre_super_star_cluster_molecular_cloud_in_the_an...The physical conditions_in_a_pre_super_star_cluster_molecular_cloud_in_the_an...
The physical conditions_in_a_pre_super_star_cluster_molecular_cloud_in_the_an...Sérgio Sacani
 
Galaxy dynamics and the mass density of the universe
Galaxy dynamics and the mass density of the universeGalaxy dynamics and the mass density of the universe
Galaxy dynamics and the mass density of the universeSérgio Sacani
 
A15 Term Project Final
A15 Term Project FinalA15 Term Project Final
A15 Term Project FinalSamuel Carey
 
Exploring the nature and synchronicity of early cluster formation in the Larg...
Exploring the nature and synchronicity of early cluster formation in the Larg...Exploring the nature and synchronicity of early cluster formation in the Larg...
Exploring the nature and synchronicity of early cluster formation in the Larg...Sérgio Sacani
 
Multi wavelenth Observations and Surveys of Galaxy Clusters
Multi wavelenth Observations and Surveys of Galaxy ClustersMulti wavelenth Observations and Surveys of Galaxy Clusters
Multi wavelenth Observations and Surveys of Galaxy ClustersJoana Santos
 
The colision between_the_milky_way_and_andromeda
The colision between_the_milky_way_and_andromedaThe colision between_the_milky_way_and_andromeda
The colision between_the_milky_way_and_andromedaSérgio Sacani
 
Asymmetrical tidal tails of open star clusters: stars crossing their cluster’...
Asymmetrical tidal tails of open star clusters: stars crossing their cluster’...Asymmetrical tidal tails of open star clusters: stars crossing their cluster’...
Asymmetrical tidal tails of open star clusters: stars crossing their cluster’...Sérgio Sacani
 
JWST early Universe observations and 𝚲CDM cosmology
JWST early Universe observations and 𝚲CDM cosmologyJWST early Universe observations and 𝚲CDM cosmology
JWST early Universe observations and 𝚲CDM cosmologySérgio Sacani
 
A Chandra X-ray study of millisecond pulsars in the globular cluster Omega Ce...
A Chandra X-ray study of millisecond pulsars in the globular cluster Omega Ce...A Chandra X-ray study of millisecond pulsars in the globular cluster Omega Ce...
A Chandra X-ray study of millisecond pulsars in the globular cluster Omega Ce...Sérgio Sacani
 
Andromeda extended disk_of_dwarfs
Andromeda extended disk_of_dwarfsAndromeda extended disk_of_dwarfs
Andromeda extended disk_of_dwarfsSérgio Sacani
 
PCCC21 筑波大学計算科学研究センター 「学際計算科学による最新の研究成果」
PCCC21 筑波大学計算科学研究センター 「学際計算科学による最新の研究成果」PCCC21 筑波大学計算科学研究センター 「学際計算科学による最新の研究成果」
PCCC21 筑波大学計算科学研究センター 「学際計算科学による最新の研究成果」PC Cluster Consortium
 
Spiral Quasar Census
Spiral Quasar CensusSpiral Quasar Census
Spiral Quasar CensusVeekash Patel
 
The massive relic galaxy NGC 1277 is dark matter deficient From dynamical mod...
The massive relic galaxy NGC 1277 is dark matter deficient From dynamical mod...The massive relic galaxy NGC 1277 is dark matter deficient From dynamical mod...
The massive relic galaxy NGC 1277 is dark matter deficient From dynamical mod...Sérgio Sacani
 
Superluminous spiral galaxies
Superluminous spiral galaxiesSuperluminous spiral galaxies
Superluminous spiral galaxiesSérgio Sacani
 
Why do we believe galaxy clusters are rich in dark matter What is b.pdf
Why do we believe galaxy clusters are rich in dark matter  What is b.pdfWhy do we believe galaxy clusters are rich in dark matter  What is b.pdf
Why do we believe galaxy clusters are rich in dark matter What is b.pdffabmallkochi
 
DISSERTATIONJOAKIM676951
DISSERTATIONJOAKIM676951DISSERTATIONJOAKIM676951
DISSERTATIONJOAKIM676951Joakim Carlsen
 

Semelhante a tw1979_final_report_ref_correct (20)

Stellar tidal streams_in_spiral_galaxies_of_the_local_volume
Stellar tidal streams_in_spiral_galaxies_of_the_local_volumeStellar tidal streams_in_spiral_galaxies_of_the_local_volume
Stellar tidal streams_in_spiral_galaxies_of_the_local_volume
 
The Sparkler: Evolved High-redshift Globular Cluster Candidates Captured by JWST
The Sparkler: Evolved High-redshift Globular Cluster Candidates Captured by JWSTThe Sparkler: Evolved High-redshift Globular Cluster Candidates Captured by JWST
The Sparkler: Evolved High-redshift Globular Cluster Candidates Captured by JWST
 
The physical conditions_in_a_pre_super_star_cluster_molecular_cloud_in_the_an...
The physical conditions_in_a_pre_super_star_cluster_molecular_cloud_in_the_an...The physical conditions_in_a_pre_super_star_cluster_molecular_cloud_in_the_an...
The physical conditions_in_a_pre_super_star_cluster_molecular_cloud_in_the_an...
 
Galaxy dynamics and the mass density of the universe
Galaxy dynamics and the mass density of the universeGalaxy dynamics and the mass density of the universe
Galaxy dynamics and the mass density of the universe
 
A15 Term Project Final
A15 Term Project FinalA15 Term Project Final
A15 Term Project Final
 
Exploring the nature and synchronicity of early cluster formation in the Larg...
Exploring the nature and synchronicity of early cluster formation in the Larg...Exploring the nature and synchronicity of early cluster formation in the Larg...
Exploring the nature and synchronicity of early cluster formation in the Larg...
 
Multi wavelenth Observations and Surveys of Galaxy Clusters
Multi wavelenth Observations and Surveys of Galaxy ClustersMulti wavelenth Observations and Surveys of Galaxy Clusters
Multi wavelenth Observations and Surveys of Galaxy Clusters
 
The colision between_the_milky_way_and_andromeda
The colision between_the_milky_way_and_andromedaThe colision between_the_milky_way_and_andromeda
The colision between_the_milky_way_and_andromeda
 
Asymmetrical tidal tails of open star clusters: stars crossing their cluster’...
Asymmetrical tidal tails of open star clusters: stars crossing their cluster’...Asymmetrical tidal tails of open star clusters: stars crossing their cluster’...
Asymmetrical tidal tails of open star clusters: stars crossing their cluster’...
 
JWST early Universe observations and 𝚲CDM cosmology
JWST early Universe observations and 𝚲CDM cosmologyJWST early Universe observations and 𝚲CDM cosmology
JWST early Universe observations and 𝚲CDM cosmology
 
A Chandra X-ray study of millisecond pulsars in the globular cluster Omega Ce...
A Chandra X-ray study of millisecond pulsars in the globular cluster Omega Ce...A Chandra X-ray study of millisecond pulsars in the globular cluster Omega Ce...
A Chandra X-ray study of millisecond pulsars in the globular cluster Omega Ce...
 
Andromeda extended disk_of_dwarfs
Andromeda extended disk_of_dwarfsAndromeda extended disk_of_dwarfs
Andromeda extended disk_of_dwarfs
 
PCCC21 筑波大学計算科学研究センター 「学際計算科学による最新の研究成果」
PCCC21 筑波大学計算科学研究センター 「学際計算科学による最新の研究成果」PCCC21 筑波大学計算科学研究センター 「学際計算科学による最新の研究成果」
PCCC21 筑波大学計算科学研究センター 「学際計算科学による最新の研究成果」
 
Spiral Quasar Census
Spiral Quasar CensusSpiral Quasar Census
Spiral Quasar Census
 
The massive relic galaxy NGC 1277 is dark matter deficient From dynamical mod...
The massive relic galaxy NGC 1277 is dark matter deficient From dynamical mod...The massive relic galaxy NGC 1277 is dark matter deficient From dynamical mod...
The massive relic galaxy NGC 1277 is dark matter deficient From dynamical mod...
 
Superluminous spiral galaxies
Superluminous spiral galaxiesSuperluminous spiral galaxies
Superluminous spiral galaxies
 
Poster_90x110_Sochias
Poster_90x110_SochiasPoster_90x110_Sochias
Poster_90x110_Sochias
 
Teletransportacion marcikic2003
Teletransportacion  marcikic2003Teletransportacion  marcikic2003
Teletransportacion marcikic2003
 
Why do we believe galaxy clusters are rich in dark matter What is b.pdf
Why do we believe galaxy clusters are rich in dark matter  What is b.pdfWhy do we believe galaxy clusters are rich in dark matter  What is b.pdf
Why do we believe galaxy clusters are rich in dark matter What is b.pdf
 
DISSERTATIONJOAKIM676951
DISSERTATIONJOAKIM676951DISSERTATIONJOAKIM676951
DISSERTATIONJOAKIM676951
 

tw1979_final_report_ref_correct

  • 1. Astrophysics Group, School of Physics, University of Bristol c ESO 2015 May 13, 2015 Hunting for satellites of the most massive galaxy clusters Thomas Wigg H. H. Wills Physics Laboratory, University of Bristol, Tyndall Ave, Bristol BS8 1TL, UK. e-mail: tw1979@my.bristol.ac.uk ABSTRACT Galaxy clusters accrete the majority of their mass through mergers with comparable mass satellite clusters, but these lower mass satellites are often dicult to identify from their X-ray signal alone, especially at higher redshifts. Satellite clusters were searched for in the vicinity of a sample of 11 X-ray detected clusters from the XMM-XXL cluster survey in the redshift range 0.5 z 0.9 found in the overlap region of the VIPERS and CFHTLS-W1 galaxy catalogues. Two selection techniques were used to create subsets of galaxies from the two catalogues likely to be part of the conrmed clusters and any surrounding structure, and potential satellites were identied by looking for overdensities in the combination of these selections. Sources from the XXL catalogue thought to originate from the satellites were selected and mass estimates calculated based on their X-ray ux. The validity of any identied systems was then investigated through comparison with similar systems from the Millennium Simulations and an additional mass estimate calculated based on the stellar ux of each satellite and its more massive companion. Using light cones from the Millennium Simulations the occurrence rate of cluster systems detected with apparent satellites and the number of these associated satellites around each cluster were compared to expected rates predicted by the computer models. One conrmed and ve potential satellites around four of the XXL clusters were identied, all of which have estimated masses and separations from their companion cluster deemed reasonable. The rate of clusters with companion satellites and the number of satellites per cluster were both greater in simulations than real observations but this was attributed to limitations of the catalogues used, issues identifying weaker galactic overdensities and ambiguity in selecting satellites in the simulations. No single piece of evidence suggests the satellite candidates found are not true clusters, but follow-up observations are required to conrm their presence. Key words. Galaxies: clusters: general - galaxies: clusters: intracluster medium - galaxies: distances and redshifts - X-rays: galaxies: clusters - cosmology: dark matter. 1. Introduction Only in recent years have attempts to reconcile observations of the universe with a single model for the architecture of the universe, and the growth of structure within it, been successful. This is termed the concordance model and re- quires a at geometry of the observable universe, implying that the total energy density is close to the critical density required for the universe to become closed. As it is under- stood today, the universe is composed mainly of two domi- nant components: non-baryonic dark matter and a form of dark energy, where the gravity of the former is responsible for structure formation and the latter is responsible for the accelerated expansion of the universe. The mean density of baryonic matter corresponds to around only 15% of the to- tal matter in the universe (Voit 2005) and this matter is only observable because it has been drawn into the deep potential wells created by concentrations of dark matter, where a small fraction has condensed into stars and galax- ies. Clusters of galaxies are important in testing the under- lying cosmological model, as according to the concordance model they are the largest and most recent gravitationally- relaxed objects to form (as structure grows hierarchically) and they trace the large-scale distribution of matter in the universe. Structure formation is driven by gravity and in the early universe regions where a uctuation caused the density to slightly exceed the mean density became gravi- tationally bound. These regions eventually decoupled from expansion and collapsed upon themselves, entering a state of virial equilibrium where the mean speeds of the compo- nent particles are approximately half of the escape veloc- ity (Voit 2005). Density perturbations in the concordance model have greater amplitudes on smaller length scales and due to this small, sub-galactic objects decoupled rst, col- lapsed and virialised. The scale of the virialisation increased until clusters of galaxies, with masses between 1013 and 1015 times that of the Sun (1013 M −1015 M ) were formed: this is termed hierarchical clustering. Press and Schechter de- veloped an analytic formalism for this process of structure formation in their landmark 1974 paper (Press Schechter 1974). With improvements to equipment over the past few decades, the catalogue of known clusters is continuously increasing and with it more information is being garnered from observations of clusters than ever before. This, coupled with recent advances in computational technology, means the ability to develop models via simulations and semi- analytic techniques and subsequently test said models with observations has become an imperative reality. However, technical limitations still pose an issue in clus- ter detection: X-ray cluster surveys suer from inherently Page 1 of 17
  • 2. Hunting for satellites of the most massive galaxy clusters low count rates and poor signal-to-noise, meaning detec- tion of lower mass clusters becomes increasingly dicult at greater redshifts, whilst cluster identication from opti- cal galaxy surveys suers from signicant projection eects. Clusters accrete the majority of their mass through merg- ers with comparable mass satellite clusters which are drawn into the potential well of their more massive companion (Lidman et al. 2013). Looking back into the early universe, when few clusters were fully-formed, many clusters should be present with satellites in their vicinity, but due to the limitations of current observatories it is rarely possible to identify these lower mass satellite clusters around the more massive clusters detected on the sky; this issue provides the motivation for this project. Using photometric techniques to select galaxies from the CFHTLS-W1 catalogue likely to belong to the larger- scale structure around detected clusters from the XMM- XXL cluster survey and using redshift information from the spectroscopic VIPERS galaxy catalogue, overdensities in the number of these galaxies in the vicinity of massive clusters are identied, indicative of the satellites one ex- pects to see. Potential X-ray sources from the full XXL catalogue thought to originate from the satellites are then identied and from this mass estimates of the potential clus- ters are calculated. A variety of techniques are then used to check whether the cluster systems identied seem reason- able, notably utilising data from the Millennium Simula- tions to investigate satellite characteristics and occurrence rates. This paper is split into four further sections: Section 2 covers the observable properties of clusters (Ÿ2.1) and de- scribes the processes by which they grow (Ÿ2.2), along with a collation of cluster catalogues and growth curves produced using the Millennium Simulations which comprises the rst work of this paper (Ÿ2.3). Section 3 describes the hunt for the satellites of massive clusters conducted by making selec- tions of structure in spectroscopic (Ÿ3.1) and photometric (Ÿ3.2) galaxy catalogues and the combination of these tech- niques to identify overdensities in these galaxies indicative of clustering (Ÿ3.3). Section 3 continues with attempts to identify X-ray signals from the potential satellites and from these make an estimate of their mass (Ÿ3.4) and concludes with eorts to determine the validity of the potential cluster systems discovered using the Millennium Simulations and comparisons between the masses calculated from the X-ray ux of potential cluster sources and estimated from the ra- tio of stellar mass between the satellites and their massive companion (Ÿ3.5). Section 4 discusses the sources of pos- sible uncertainty (Ÿ4.1), the signicance of the discovered systems (Ÿ4.2) and the future of satellite detection with ref- erence to the scheduled eROSITA observatory (Ÿ4.3), with section 5 summarising the project. Throughout this paper, a at cold dark matter cosmol- ogy with ΩΛ = 0.70 , Ωm = 0.30 and H0 = 70km -1 Mpc -1 is assumed. 2. Background and preliminary work 2.1. Observable properties of galaxy clusters In order to select clusters (or groups) of galaxies from the observed galaxy distribution, one must dene some selec- tion criteria. In 1958, Abell selected 1,682 galaxy clusters from the Palomar Sky Survey (Abell 1958) according to two selection criteria: the rst put a constraint on the min- imum density of the cluster and the second required that the cluster contained a sucient amount of galaxies. These were termed the compactness and richness criterion respec- tively. Abell also classied a cluster as regular if its galaxy distribution was roughly circularly symmetric and irregular otherwise. Stars make up only a small fraction of the total bary- onic mass of a cluster, with substantially more contained in hot gas which emits in the X-ray and is visible in the microwave through the Sunyaev-Zel'dovich eect, allowing cluster detection in these frequency ranges as well as the optical. The baryonic mass of stars and hot gas in a clus- ter only makes up approximately one eighth of the total mass (Allen et al. 2002), which means gravitational lensing is also an extremely useful probe of massive structures like clusters. 2.1.1. Optical Charles Messier and William Herschel (Messier 1781; Her- schel 1785) were among the rst to identify concentrations of galaxies using optical observations; they observed galax- ies in the Virgo and Coma clusters. Optical techniques have improved over the past two centuries, culminating in the denitive cluster catalogues of George Abell and collabo- rators (Abell 1958; Abell et al. 1989). Abell's catalogues contain most of the known nearby galaxy clusters and are the basis for much of our modern understanding of clusters. Optical observations are useful as the cluster luminos- ity scales with cluster mass, generally adhering to the lumi- nosity distribution proposed by Schechter (1976), with the number of galaxies in luminosity range dL about L propor- tional to L−α exp(−L/L∗), with α ∼ 1 (e.g. Balogh et al. 2001). This relationship is important as it is often more useful to compare cluster masses, which dictate many of the physical processes in the cluster, rather than cluster luminosities. Once a cluster has been optically identied, obtaining the radial velocities vr of the cluster galaxies helps deter- mine the cluster mass. As the velocity distribution of a re- laxed cluster is expected to be approximately Gaussian in velocity space, cluster candidates can be conrmed if their velocities fall within a chosen number of standard devia- tions of the mean dispersion, dependent on the stringency of the cluster member selection. Zwicky (1933, 1937) was the rst to measure the one-dimensional velocity dispersion σ1D of a cluster, nding σ1D ∼ 700kms -1 for the Coma clus- ter. This provided some of the rst evidence for the presence of dark matter in the universe, as the inferred mass from this velocity dispersion along with his estimated cluster ra- dius required substantially more mass than was observed in stars. In his 1937 paper, Zwicky also proposed that cluster masses could be measured through the gravitational lensing of background galaxies. The technique did not become prac- tical for another sixty years but is now one of the primary methods for measuring cluster mass. Chwolson in 1924 and Einstein in 1936 were the rst to propose that, if a back- ground star were precisely aligned with a massive object, the gravitational eect of this mass would deect the path of the star's photons resulting in a circular ring of light, cen- tred on the deector (Chwolson 1924; Einstein 1936). Mea- suring the weak-lensing distortion of any single galaxy is Page 2 of 17
  • 3. Thomas Wigg 2015 | Hunting for satellites of the most massive galaxy clusters nearly impossible, but the mass of a cluster can be inferred by looking at the distortion of an entire eld - this technique is demonstrated in Bartelmann Schneider (1999). 2.1.2. X-ray With only around one tenth of the universe's baryons re- siding in stars in galaxies, there is a signicant amount of matter located in intergalactic space. These inter- galactic baryons are generally very dicult to observe, but when compressed by the deep gravitational potential wells of clusters, the intracluster gas is heated to X-ray emitting temperatures, releasing photons through thermal bremsstrahlung. This gas, which corresponds to approxi- mately 15% of the cluster mass, has a temperature which correlates to the depth of the potential well and from this the total mass of the galaxy cluster can be calculated - the physics of this is described in Sarazin (1988). It was follow- ing the detection of the ionised iron line FeXXVI by the Ariel-V satellite (Mitchell et al. 1976) that the usefulness of X-ray emission of the intracluster medium (ICM) as a probe of the gravitational potential within the cluster (and therefore the gravitating mass) was realised. The calcula- tion for this is presented by Fabricant, Lecar and Gorenstein (Fabricant et al. 1980). Galaxy clusters are identied from the X-ray signal of their ICM through a reduction pipeline - an algorithm se- lects source candidates based on whether their characteris- tics are indicative of cluster emission. However, with the in- herently low count rates and signal-to-noise associated with cluster detection, at greater distances it becomes increas- ingly dicult to identify the extended sources of galaxy cluster ICM amidst a universe of X-ray bright point sources such as active galactic nuclei (AGN). Cluster X-ray lumi- nosity scales with mass (Piaretti et al. 2010), leading to lower mass clusters being biased against at higher redshift, as they are the rst to fall below either the ux limit or pipeline conrmation limit for a given survey. 2.1.3. Microwave (Sunyaev-Zel'dovich eect) The hot intracluster medium can also be observed through its eect on the cosmic microwave background (CMB). The CMB itself has a nearly perfect blackbody spectrum (Mather et al. 1990) and soon after the discovery of this background radiation it was theorised that the spectrum would be distorted by Compton upscattering of the CMB photons by the intergalactic gas (Weymann 1965, 1966). Sunyaev Zel'dovich (1970, 1972) predicted that the CMB photons would indeed be upscattered to higher energy by the ICM and this eect is now known as the Sunyaev- Zel'dovich (S-Z) eect. Birkinshaw (1991) demonstrated some of the rst S-Z detections of clusters, but these were marginal. However, in the following decade, many clusters were detected with high signicance (Birkinshaw 1999; Carlstrom et al. 2000). Several S-Z surveys, including the South Pole Telescope (SPT, Carlstrom et al. 2009) survey, the Atacama Cos- mology Telescope (ACT, Fowler et al. 2007), and Planck (Tauber et al. 2010), are actively ongoing, providing the rst S-Z-selected cluster catalogues (e.g. Vanderlinde et al. 2010; Menanteau et al. 2010). Using S-Z techniques to identify clusters is advantageous as, due to the fact that the observed photons are from the CMB, they are redshift-independent. However, X-ray ob- servations of S-Z-detected clusters are still important for many reasons. The X-ray properties allow a better calibra- tion of the S-Z signal and yield the calibration of the scaling relations needed for cosmological studies with S-Z-selected cluster samples. X-ray observations also allow the testing of the selection function of S-Z surveys and verication of new S-Z cluster candidates. Furthermore, they are essential for statistical analyses of the S-Z data (Piaretti et al. 2010). 2.2. Growth of clusters Due to the hierarchical nature of structure growth and the self-similarity of galaxy clusters, growth of structure on vastly dierent scales occurs in much the same way. Mergers not only appear to be the dominant channel for mass growth of a galaxy or cluster's dark matter halo but also the stellar mass growth, both directly through galaxy-galaxy mergers and through the accretion of potentially star-forming gas (Fakhouri et al. 2010; Lidman et al. 2013). Lidman et al. (2013) dene a major merger as 0.25 µ∗ 1, where µ∗ is the mass ratio between the satellite and its more massive companion. If the orbital energy is suciently low, close en- counters between two systems can lead to a merger. How- ever, galaxies in clusters are unlikely to merge as their en- counter speed is generally much larger than their internal velocity dispersion (Mo et al. 2010). There is one important exception: through dynamical friction, galaxies lose energy and momentum which causes them to `sink' towards the centre of the potential well. Provided the dynamical fric- tion time is suciently short, the galaxy will eventually reach the cluster centre and merge with the central galaxy residing there. This process is called galactic cannibalism. 2.2.1. Satellite clusters According to self-similarity, satellite clusters are bona de clusters which appear structurally identical to the most massive clusters they are bound to (Neumann Arnaud 2001), albeit consisting of fewer galaxies and of lower mass. Due to the nature of merger-based growth, satellite clusters must be present in the vicinity of some massive clusters, especially in earlier periods of cosmic history when few, if any, galaxy clusters had cleared the surrounding universe of dust and smaller clusters to become fully-formed. Clus- ter systems in the process of merging have been observed and detailed in numerous papers (Hagino et al. 2015; Kato et al. 2015; Storm et al. 2015; Zhang et al. 2015 to list but a few of the most recent), though little investigation has been performed into the presence of discrete satellites, still independent from the massive clusters to which they will eventually infall. This is due to the fact that the emission from a lower mass satellite will likely be considerably smaller than that observed from its more massive companion. In the case of the emission from the satellite's ICM, the X-ray ux ob- served is a function of its mass (Piaretti et al. 2010), mean- ing that for more distant clusters, where the cluster emis- sion itself is near the ux limit of the observations which detect it, the X-ray signal from any satellite clusters will Page 3 of 17
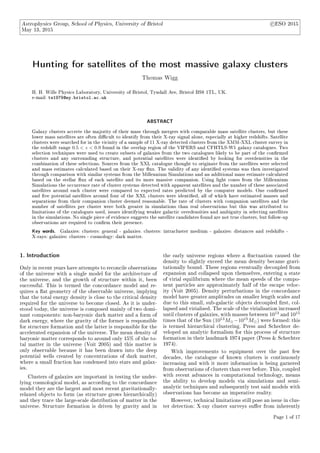
  • 4. Hunting for satellites of the most massive galaxy clusters likely fall below the threshold to be conrmed as clusters of their own volition. Detection of these satellites is important, not only to conrm theoretical models detailing the growth of clusters, but also to plot the large-scale structure, of which clusters are intrinsic components in forming the laments and voids which trace the largest arrangement of matter in the uni- verse. 2.2.2. Simulations N-body simulations representing the dark matter haloes of galaxies and clusters, occasionally combined with semi- analytic descriptions, have been increasingly used over the past two decades to investigate the hierarchical forma- tion of large-scale structure in the universe (e.g. Navarro et al. 1997; De Lucia Blaizot 2007; McBride et al. 2009; Fakhouri et al. 2010; Laporte et al. 2013). Only recently, however, have the theoretical expectations and observations of cluster growth come into excellent agreement (Laporte et al. 2013). Fakhouri et al. (2010) utilise the Millennium (Springel et al. 2005) and Millennium-II (Boylan-Kolchin et al. 2009) to construct merger trees of dark matter haloes and quan- tify their merger rates and mass growth rates from between z = 0 and z = 15 for over ve orders of magnitude in the descendant halo mass (1010 M M0 1015 M ). The Millennium-II simulation has the same number of particles but 125 times better mass resolution and the new data base provides 7.5×10⁶ dark matter haloes (each containing more than 1000 simulation particles) between redshift 0 and 15, adding to the 11.3 × 10⁶ haloes (between z = 0 and z = 6) from the Millennium simulation. To compute the total mass growth rate of a halo of given mas M0 at time t, Fakhouri et al. (2010) follow the main branch of its merger tree and set ˙M = (M0 − M1)/t, where M0 is the descendant mass at time t and M1 is the mass of its most massive progenitor at time t − ∆t. The plot showing the mean value of ˙M as a function of z, taken from Fakhouri et al. (2010), can be seen in Fig. 1. They nd the mass accretion rates shown in Fig. 1 to be well t by equations (8) and (9) of McBride et al. (2009) with only the coecients needing minor adjustments. They nd that the updated t, shown by the dashed lines in Fig. 1, for the mean growth rates of haloes of mass M at redshift z can be written ˙M mean = 46.1M yr−1 M 1012M 1.1 ×(1 + 1.11z) Ωm(1 + z)3 + ΩΛ (1) 2.3. Collation of cluster catalogues and analyses of cluster mass growth The work of Piaretti et al. (2010) sought to homogenise, to an overdensity of 500 1 , many previous ROSAT All Sky 1 Cluster limits are dicult to dene, so in order to make cluster properties comparable the region with an edge corresponding to a certain overdensity, where the density of matter is a given factor times the critical density, is normally used. Fig. 1. Fakhouri et al. (2010) - Mean mass accretion rate of dark matter on to haloes as a function of redshift from the two Millennium simulations (solid curves). Halo masses ranging from 1010 to 1014 M are plotted. The dashed curves show the accurate t provided by Equation (1). The right-hand side of the vertical axis labels the mean accretion rate of baryons, Mb, assuming a cosmological baryon-to-dark matter ratio of 1/6. Survey-based (NORAS, REFLEX, BCS, SGP, NEP, MACS and CIZA) and serendipitous (160SD, 400SD, SHARC, WARPS and EMSS) cluster catalogues into a single Meta- Catalogue of X-ray Clusters of galaxies: the MCXC. The MCXC comprises of 1743 clusters, with redshift z, stan- dardised 0.1 − 2.4 keV band luminosity L500, total mass M500 and radius R500 provided. Being the largest catalogue, all subsequent catalogues were homogenised to be compa- rable to the MCXC according to Piaretti et al. (2010). In addition to the clusters contained in the MCXC, clusters from the XMM-XXL (Pierre et al. 2011), XMM- LSS (Clerc et al. 2014) and XMM-XCS (Mehrtens et al. 2012) - all X-ray surveys utilising the XMM-Newton tele- scope - were also added to the catalogue. In order to ho- mogenise the surveys with the MCXC, it was necessary to transform the luminosities into the correct (0.1 − 2.4 keV) band, as the LSS and XXL catalogues were published in the 0.5 − 2.0 keV band and the XCS catalogue in the bolomet- ric (0.01 − 100 keV) band. To do this, a correction factor, which is simply the ratio between the uxes in each band, is required. This factor is X-ray temperature and redshift dependent, and a table of the correction factors was gen- erated using the APEC emission spectrum in xspec. An abundance of 0.3 was used. As well as the mentioned X-ray clusters, two S-Z- selected catalogues - the all sky Planck-SZ (Planck Collab- oration 2013) and 720deg 2 South Pole Telescope SPT-SZ (Reichardt et al. 2012) - were also included. The Planck catalogue contains 861 conrmed clusters, with 178 con- rmed as new clusters, mostly through follow-up observa- tions whilst the SPT catalogue consists 158 optically or infrared conrmed clusters, with 117 new discoveries. Both Page 4 of 17
  • 5. Thomas Wigg 2015 | Hunting for satellites of the most massive galaxy clusters the Planck and SPT luminosities were already in the correct band to be included in this catalogue. To ensure the masses in the four catalogues used are comparable, equation (2) of Piaretti et al. (2010) was used to covert the L500 of the XMM-LSS and XMM-XCS to cluster masses M500. This equation reads h(z)−7/3 L500 1044ergs−1 = C M500 3 × 10¹⁴M α (2) where log(C) = 0.274, α = 1.64 and h(z) is the ratio of the Hubble constant at redshift z to its present value, H0 i.e. h(z)2 = Ωm(1 + z)3 + ΩΛ. Note that this is an example of an X-ray scaling relation; references with a more exten- sive derivation (e.g. Giodini et al. 2013) and papers tackling scaling relations in the optical and microwave bands (Cza- kon et al. 2014) are readily available. After considering the work of Fakhouri et al. (2010), it was decided that obtaining a form of equation (1) which gives the change in mass ∆M of a given cluster of mass M between the look-back times t1 and t2, corresponding to a redshift change of z(t1) to z(t2), would be useful. Before numerical integration was necessary, the simplest form of this equation can be written ∆M = − z(t2) z(t1) ΩΛ Ω0 (1 + 1.11z) (z + 1) Ωm(z + 1)3 + ΩΛ Ω0(z + 1)3 + ΩΛ dz (3) Fig. 2 shows the distribution of the MCXC, XMM-XXL, XMM-LSS, XMM-XCS, Planck-SZ and SPT-SZ clusters on a plot of mass against redshift. Equation (3) was numeri- cally integrated over all M(z) and z using the trapezium rule to produce contour plot beneath the cluster points on Fig. 2, where a line of constant colour traces the likely mass history of a cluster based on the work of Fakhouri et al. (2010). It is clear from this that at intermediate redshifts, few clusters have been detected with masses 1014 M . This does not correlate to the actual existence of lower mass clusters however, and is simply a comment on the technical limitations of current detection techniques. As mentioned, it is for this reason that is has not yet been possible to detect many low mass satellites around massive clusters - a problem discussed in the following section and addressed in the remainder of this paper. 3. Hunting for satellite clusters The nature of hierarchical clustering insists that at higher redshift (z 0.5), where clusters are rarely fully-formed, more massive clusters be surrounded by lower mass satellite groups and clusters which will eventually merge with the host. The statement by Lidman et al. (2013) and Fakhouri et al. (2010) that major mergers provide the dominant chan- nel of mass growth of massive clusters means that satel- lite clusters of comparable (but lower) mass to the host should be present around clusters in the early universe. Self-similarity requires these be clusters of their own vo- lition, with a present ICM and associated X-ray emission. As discussed earlier, unidentied satellite clusters are in- trinsically too low a mass to be conrmed from their X-ray signal alone (see Ÿ2.1.2). In this paper, potential satellites were identied by searching for overdensities in the number of observed galaxies around conrmed clusters. Determining the spatial distribution of objects in the Universe when observing from our xed position on Earth is inherently dicult: without some form of additional in- formation, the three-dimension cosmos exists only as a two- dimensional projection on our sky. Because of this, some means of determining or inferring the three-dimensional dis- tribution of galaxies is necessary to identify clustering. Two methods for identifying this clustering were used in this in- vestigation. The rst relies on using the spectroscopically determined redshifts of a sample of galaxies to plot their true spatial distribution. The second involves using pho- tometric data from a dierent sample of galaxies to make relevant colour cuts about a cluster's red sequence to iso- late galaxies that were likely formed at the same epoch as the cluster. Both of these techniques are described in more detail in the subsequent subsections. It is advantageous to combine these techniques in or- der identify satellites which fall below the selection thresh- old of any one observational technique, and as such the areas surveyed using each method must necessarily over- lap. This hugely restricts the available data, as only ar- eas of sky with deep-eld X-ray, spectroscopic galaxy and photometric galaxy data are usable. One such overlap be- tween the the VIMOS Public Extragalactic Redshift Survey (VIPERS), Canada-France-Hawaii Telescope Legacy Sur- vey (CFHTLS) and the XXL-North cluster catalogue is utilised in this paper. The XXL Extragalactic Survey (Pierre et al. 2011; Pierre XXL Consortium 2014) is a recent X-ray cluster survey utilising the XMM-Newton observatory. It contains 336 likely clusters (188 of which are are very good cluster candidates) with 0 z 2.24 split between two survey ar- eas. The Northern catalogue utilised in this investigation is centred on the CFHTLS-W1 area (RA: 2h23m, Dec: -4 deg 30') and covers an area of 25deg 2 . A total of 26,555 X-ray sources were detected in the Northern eld of the XXL sur- vey. Galaxy clusters demonstrate the largest X-ray source extent, or core radius, as the emission from the ICM is dif- fuse. Likely clusters are classied from this extent and the corresponding likelihood of that being the true extension, with a lower limit on both set to dene very good class 1 (C1) cluster candidates and possible class 2 clusters (C2). A minimum extension of 15 arcseconds is imposed for both C1 and C2 sources, with lower likelihood limits of 5 and 33 dening the two classes respectively (Pacaud et al. 2006). The rst VIPERS public data release (PDR-1; Garilli et al. 2014), comprises 57,204 spectroscopic measurements of galaxies with iAB 22.5 and 0.5 z 1.2. This in- vestigation uses the catalogue of 30,523 galaxies from the incomplete W1 eld (centred at RA: 02h26m00.0s, Dec: -04 deg 30'00), with a surveyed area of 7.932deg 2 at the time of the rst data release. Objects chosen for spectroscopic follow-up to be included in VIPERS were selected from the CFHTLS-Wide catalogue. CFHTLS (Hudelot et al. 2012) is the combination of a large fraction (∼50%) of Canada and France's dark and grey telescope time from mid-2003 to early 2009 and comprises two components: CFHTLS-Deep and CFHTLS- Wide, with the latter being comprised of 4 contiguous in- Page 5 of 17
  • 6. Hunting for satellites of the most massive galaxy clusters ∆ XMM-XCS ∇ XMM-LSS ❏ XXL ❍ MCXC + SPT-SZ × PCCS-SZ 0 0.2 0.4 0.6 0.8 1 1.2 1.4 1.6 1.8 2 z 1 10 100 1000 M500(z)[1012 solarmasses] 1 10 10 2 103 M0/[1012 solarmasses] Fig. 2. Plot of mass M500/1012 M against redshift z showing the clusters collated from the MCXC, XMM-XXL, XMM-LSS, XMM-XCS, Planck-SZ and SPT-SZ catalogues. The contour plot below shows the likely mass accretion of a cluster, with lines of constant colour representing how the mass M(z) of a cluster of mass M0 today has changed since z = 2. dependent patches covering a total area of ∼155deg 2 . The CFHTLS-W1 area selected for this investigation is reduced to contain the 1,034,605 objects for which 3.6µm and 4.5µm band magnitudes are available. This is due to the nature of the photometric cuts made in this investigation, described in detail in Ÿ3.2. The VIPERS area is the smallest of the three survey areas used and consequently is the limiting area for this project. Within this area, the 11 XXL clusters (of which 6 are C1) with 0.5 z 0.9 were selected for investigation, with this restriction necessary due the fact that the density of VIPERS galaxies drops to an unusable level at redshifts greater than this. 3.1. Isolating structure using spectroscopic redshifts If the redshifts of a sample of galaxies are known, it al- lows the unique opportunity of plotting the precise three- dimensional distribution of these galaxies in space, with a redshift directly correlating to a spatial distance away from Earth. This method provides the most direct way of identi- fying clusters of galaxies, with overdensities in the distribu- tion resulting from the true grouping of galaxies in space, rather than being inferred from a selection proxy (as with the photometric technique used in Ÿ3.2). For each of the selected clusters, an initial redshift cut in the VIPERS catalogue of ±0.1 about the cluster red- shift in a square area of 0.25deg 2 , when possible centred on the cluster, was made with a view to identify any ex- tended structure. For clusters where galactic overdensities were obvious, a manual selection of the structure was made to produce a subset of galaxies that appear to belong to the same, larger-scale structure as the conrmed XXL clus- ter. For clusters where no obvious galactic clustering was present, a cut in redshift of ±0.02 was made about the clus- ter - this range was chosen as, for the clusters where galactic overdensities were identiable in the redshift-RA plane, any observable structure was contained in this cut. An example of a selection of obvious structure can be seen in the spatial distribution of galaxies shown in Fig. 3, with evident clustering around n0286, a class 1 cluster from the XXL-N catalogue. Whilst the selection was made man- ually, the validity of this method is supported by the his- togram: the selection of galaxies made is contained within a strong, single peak in the distribution, suggesting that the majority of the galaxies selected are in fact part of the larger structure the cluster occupies. Of the 11 clusters examined, 6 were situated in regions of galactic overdensity such that is was possible to select its likely containing structure. 3.2. Identifying likely clustering using photometric techniques All rich galaxy clusters contain a population of passively evolving, early-type elliptical galaxies which show a strong linear relationship between their colour and magnitude. This relation, termed the red sequence, demonstrates an in- credibly low scatter and appears extremely homogeneous, both within clusters and between them (Bower et al. 1992). The stellar population which makes up the red sequence appears to be formed at high redshift (z 2) (Gladders Page 6 of 17
  • 7. Thomas Wigg 2015 | Hunting for satellites of the most massive galaxy clusters 32.0 32.1 32.2 32.3 32.4 0.65 0.70 0.75 0.80 0.85 XXL cluster (n0286) Selected subset Excluded galaxies z RA (Deg) 0.66 0.68 0.70 0.72 0.74 0.76 0.78 0.80 0.82 0.84 0 5 10 15 Count z Selected subset Excluded galaxies Fig. 3. Left: spatial distribution of VIPERS galaxies (blue and orange) in the RA-z plane within a Dec. cut of ±0.25deg about C1 XXL cluster n0286 (black circle). Orange points show the manually selected subset of galaxies assumed to be part of the large-scale structure in which n0286 is present. Right: Distribution of VIPERS galaxies in redshift contained within a 0.25deg2 square annulus in RA and Dec. about the position of the C1 XXL cluster n0286. The manually selected subset of galaxies about the cluster is shown. Yee 2000), which is to be expected in cold-dark-matter dominated scenarios of hierarchical structure formation, as present-day clusters are associated with the most extreme initial overdensities, which were the rst to collapse. Other than their homogeneity, there are many other observational reasons that make the red sequence an at- tractive target for cluster identication. Elliptical galaxies can be morphologically selected with a high level of con- dence due to their core-dominated compact brightness pro- les (Abraham et al. 1994; Gladders et al. 1998). In addi- tion to this, elliptical galaxies have been shown to dominate the bright end of the cluster luminosity function (Sandage et al. 1985; Barger et al. 1998), meaning in ux limited surveys they are the most readily observed. Cluster ellip- ticals are also brighter at greater redshift (Schade et al. 1997; van Dokkum et al. 1998), which is to be expected of stellar populations which are passively evolving. According to the morphology-density relation (Dressler et al. 1997), the radial distribution of elliptical galaxies in regular, cen- trally concentrated clusters is also more compact than other morphological types, providing a higher contrast against the background. Even in irregular clusters with no well de- ned centre, ellipticals still trace the densest cluster regions as the morphology-density relation holds true, albeit with lesser signicance (Dressler et al. 1997). The Cluster Red Sequence (CRS) method of cluster de- tection is described in detail by Gladders Yee (2000), and identies clusters computationally as an overdensity of galaxies on the sky, which correlates to an overdensity in the colour-magnitude plane consistent with a red sequence of early-type galaxies. The CRS method is practically un- aected by projection eects for two reasons: the rst is that as cluster ellipticals are the oldest stellar populations in the universe, they are as red or redder than any other galaxies at a given redshift. The second utilises the fact that, with properly chosen optical lters (straddling the 4000Å break), the cluster red sequence has been shown to be as red or redder than any other galaxies at a given red- shift and all lower redshifts - a fact which means the CRS method does not accumulate signicant foreground noise, with background contamination also being minimised as structures at higher redshift will generally be most signi- cant at yet redder colours. Gladders Yee (2000) also note that a cluster's red sequence can be used as a remarkably precise redshift indicator, given a coherent enough popula- tion of early-type galaxies. The consequences of the previous statements mean that any clusters that were formed at the same point in cos- mic history (i.e. at the same redshift) should demonstrate a unique red sequence, which means that a cluster and any potential satellite clusters at approximately the same red- shift should show a very similar red sequence. This is the motivation for the photometric technique of satellite cluster identication used in this section of the paper: by identify- ing the red sequence of a conrmed XXL cluster and reduc- ing the CFHTLS-W1 catalogue by making a restriction in colour corresponding to the cluster's red sequence, it should be possible to identify surrounding structure, despite there being no direct redshift information available. Gladders Yee (2000) states that the passively evolving, early-type galaxies which make up the red sequence are present out to a redshift of at least 1.3, which means this method is valid for all clusters chosen for this investigation. It was thought that the most rigorous way to create a subset of galaxies from the CFHTLS-W1 catalogue, from which to attempt to identify a red sequence, would be achieved by calculating the virial radius of the XXL clus- ter in question and selecting all galaxies which fall within the angular region of sky corresponding to this radius. For the purposes of this investigation, it was assumed that the virial radius can be approximated to the radius which cor- responds to an overdensity of 200 times the critical density, R200 (Kravtsov 2013). In order to calculate R200 of the XXL clusters, it was rst necessary to convert the given masses Page 7 of 17
  • 8. Hunting for satellites of the most massive galaxy clusters (which are to an overdensity of 500, M500) to an overdensity of 200 (M200); the details of this conversion can be found in Hu Kravtsov (2003). Assuming the cluster is spherically distributed, the equation for the required radius, R200 = 3M200 800πρc 1 3 (4) where is ρc is the critical density, can be derived. The angular separation on the sky corresponding to each cluster's virial radius was then calculated given the clus- ter's redshift (Wright 2006), and from this is was possible to create a subset of galaxies for each cluster which fall within the projected virial radius. The colour (rAB − iAB) against i-band magnitude (iAB) was plotted for each of the galaxies in each subset, but attempts to identify any red se- quence in this data were futile: there was simply too much noise. This is due to the fact that selecting all the galax- ies within a projection of the virial radius on the sky will include huge numbers of foreground and background galax- ies, with largely dierent colours and magnitudes, which will pollute the true red sequence of the cluster. Progress was made by utilising the earlier statement that, according to the morphology-density relation, the early-type galaxies responsible for the red sequence occupy the densest clus- ter region(s). Assuming the clusters we are investigating are centrally concentrated, the early-type galaxies should inhabit the central core of the cluster. Using this informa- tion, a circular region corresponding to a projection of 30% of the virial radius of the cluster on the sky was instead used to select the subset of galaxies from which attempts to identify the the red sequence would be made, under the assumption that this would greatly increase the proportion of galaxies in each selection which are true cluster ellipti- cals. This selection technique proved much more eective, with possible red sequences identied for 8 of the 11 clus- ters. To make a selection of galaxies using the identied red sequence, a cut of (rAB −iAB)RS ±0.1 about the estimated centre of the red sequence was taken, and all galaxies out- side of this colour cut excluded. It was considered that this method of selection assumes a perfectly horizontal red se- quence, but this was deemed acceptable for two reasons. Firstly, in Gladders Yee (2000) it is shown that the slope of the red sequence for sequence colours of rAB −iAB 1.5 is very shallow and as all the clusters for which red se- quences were identied had sequence colours which fall be- low this value, a horizontal approximation was considered valid. The second is a comment on the quality of the data - because of the inevitable projection eects suered even with a reduced selection annulus, the red sequences still re- mained tricky to identify and any attempts to determine the slope of the sequence were unsuccessful. Fig. 4 shows the galaxies selected from within the pro- jection of 30% of the virial radius of cluster n0286. Note that a magnitude cut of iAB 23 has been made to remove any faint background galaxies that are unlikely to be part of the cluster or its surrounding structure. The red sequence can be identied with some condence as a line of higher density in the colour-magnitude plane, with a restriction in colour containing the red sequence shown. Fig. 5 shows this selection in context with the other galaxies contained in the 0.25deg 2 area surrounding n0286. The nal selection of galaxies made using a magnitude cut of iAB 23 and restriction in colour of 1.25 rAB − iAB 1.45 is shown and it is evident that this technique signicantly reduces the population of galaxies being investigated. 19.5 20.0 20.5 21.0 21.5 22.0 22.5 23.0 0.0 0.2 0.4 0.6 0.8 1.0 1.2 1.4 1.6 1.8 RS selection Galaxies within 30% VR r-i i Fig. 4. Galaxies from the CFHTLS-W1 catalogue selected from within the projection of 30% of the virial radius of XXL cluster n0286 on the sky, with a magnitude cut of iAB 23 performed. Orange points show the selected red sequence, contained in a cut of 1.25 rAB − iAB 1.45. 16 18 20 22 24 26 0.0 0.2 0.4 0.6 0.8 1.0 1.2 1.4 1.6 1.8 2.0 2.2 0.25deg 2 galaxies Galaxies in 30% VR RS members Colour/mag. cut r-i i Fig. 5. Galaxies from the CFHTLS-W1 catalogue in a 0.25deg2 area around XXL cluster n0286. Dark grey points show a subset of these galaxies in a selection with a magnitude restriction of iAB 23 and colour restriction of 1.25 rAB −iAB 1.45. The selection of galaxies made from within the projection of 30% of the virial radius of n0286 on the sky, along with the identied red sequence both shown in Fig. 4, are also displayed. As mentioned, by making a cut in colour about a clus- ter's red sequence, it was hoped that it would be possible to isolate not only the population of early-type galaxies from within the cluster, but also any populations of passively evolving ellipticals contained in the cores of nearby cluster structures, as these must have formed at the same time as the cluster's red sequence members. Page 8 of 17
  • 9. Thomas Wigg 2015 | Hunting for satellites of the most massive galaxy clusters 0.0 0.2 0.4 0.6 0.8 1.0 1.2 1.4 1.6 1.8 2.0 2.2 0.0 0.5 1.0 1.5 2.0 1.2 1.4 0.0 0.5 0.25deg 2 galaxies RS members Double colour/mag. cut 3.6m-4.5m r - i Fig. 6. Galaxies from the CFHTLS-W1 catalogue in a 0.25deg2 area around XXL cluster n0286. Dark grey points show a subset of these galaxies in a selection with a magnitude restriction of iAB 23 and a double restriction in colour of 1.25 rAB − iAB 1.45 and −0.2 3.6µmAB − 4.5µmAB 0.2. The subset of galaxies selected to be the cluster's red sequence is also shown. The area of interest is shown for clarity. However, it is likely that a number of foreground and background eld galaxies, which happen to have colours within the relatively broad range of (rAB−iAB)RS ±0.1, will enter the selection and pollute the data. To further isolate galaxies which are part of the cluster and any surrounding structure, an additional cut in colour in the 3.6µm - 4.5µm band was made to isolate galaxies with a similar spectral energy distribution as the red sequence members. Fig. 6 shows how this selection was performed by plot- ting the colour of the identied red sequence galaxies in the 3.6µm - 4.5µm band against the colour in the rAB − iAB band and identifying any corresponding grouping in the for- mer; a range of 0.4 in the 3.6µm - 4.5µm band was used to make a second restriction in colour. This range often did not include all galaxies from the original selection, which suggests those galaxies are not truly part of the cluster's population of early-type galaxies as the red sequence should be a ubiquitous presence in all colour bands (Gladders Yee 2000). The 0.4 cut was chosen as it was the range over which any obvious grouping in the 3.6µm - 4.5µm band ex- isted. Whilst this is a more generous restriction than the one used in the original red sequence selection, this was deemed necessary as identifying any sort of central value for the sequence in the second band was impossible with such a limited number of galaxies. As such, with a smaller band, it is possible that true sequence galaxies may be ex- cluded, reducing the quality of the data. It is clear from Fig. 6 however, the eectiveness of the double colour restriction in reducing the number of galaxies being investigated. Applying this selection method to all clusters for which a red sequence was identiable produced a subset of galax- ies within a 0.25deg 2 area around each cluster which have a similar spectral energy distribution to those selected as early-type galaxies from the XXL cluster. The advantages of this selection are twofold for identifying satellite clusters: in the case of passively evolving galaxies such as these, they were very likely to have formed at the same cosmic epoch and therefore exist at the same redshift as the cluster and, as is the nature of galaxies of this morphological type, they are likely to inhabit the central regions of nearby clusters. The validity of this method was supported by the fact that, for all clusters for which a red sequence was identiable, a strong overdensity in the number of galaxies in each selec- tion was present at the locations of the clusters in the XXL catalogue, dened by their respective X-ray sources, sug- gesting that the restrictions imposed are in fact selecting galaxies which are part of the cluster structure. 3.3. Combining spectroscopic and photometric cuts to identify cluster systems Fig. 7 shows how the combination of both subsets of galax- ies from the VIPERS (Ÿ3.1) and CFHTLS-W1 (Ÿ3.2) cata- logues can be combined to plot the number density of galax- ies as a two-dimensional histogram of the sky to identify any clustering. Note that to avoid any double counts re- sulting from galaxies contained in both the CFHTLS-W1 and VIPERS catalogues, a matching algorithm was used to remove any duplicates. For the scale of clustering neces- sary to be gravitationally bound and considered a satellite cluster of its own volition, clustering in the subsets selected using both methods would likely be evident, and for this reason combining the two selection methods is advanta- geous: any clustering found in both selections will show as a strong overdensity, whilst any clustering in an individual catalogue not present in the other, which is therefore un- likely to correspond to a massive cluster, will not appear so evidently. It is worth noting that, as there is no direct red- shift information available for the CFHTLS-W1 catalogue, any clustering has been inferred by proxy and condence in its existence must be cautious. The combination of both techniques has the additional advantage that, should clus- tering in the VIPERS catalogue be present at a location of clustering in the CFHTLS-W1 galaxies, this adds cre- dence to assumption that the clustering is present and at the redshift of the XXL cluster being investigated. As is to be expected, for all of the clusters for which a red sequence was identiable in the CFHTLS-W1 galaxies and apparent structure selectable in the VIPERS catalogue, strong overdensities in the number of galaxies were present at the locations of the clusters from the XXL catalogue. Fig. 8 shows the four of these clusters which also demon- strated overdensities in the number of galaxies on the sky in the proximity of, but separate from, the XXL cluster location following the selections made in accordance with Ÿ3.1 and Ÿ3.2. These nearby overdensities are indicative of clustering, but two questions need to be answered before they can be dened as bone de satellites of the four C1 XXL clusters shown. The rst asks whether the overdensi- ties correspond to a true clustering of galaxies in space or whether the grouping on the sky is a coincidental result of the galaxy selections made. The second asks whether the characteristics of the identied cluster are reasonable and in accordance with current theoretical understanding of the growth of clusters. Both of these questions are discussed in detail in subsequent subsections. Page 9 of 17
  • 10. Hunting for satellites of the most massive galaxy clusters 31.9 32.0 32.1 32.2 32.3 32.4 -4.7 -4.6 -4.5 -4.4 -4.3 CFHTLS-W1 galaxies VIPERS galaxies Cluster (n0286) Dec(Deg) RA (Deg) 31.9 32.0 32.1 32.2 32.3 32.4 -4.7 -4.6 -4.5 -4.4 -4.3 RA (deg) Dec(deg) 0 1 2 3 4 5 6 7 8 9 10 Count Fig. 7. Left: Distribution of galaxies on the sky in a 0.25deg2 area around class 1 XXL cluster, n0286 from the CFHTLS-W1 and VIPERS catalogues following selections made according to Ÿ3.2 and Ÿ3.1 respectively. CFHTLS-W1 galaxies are subject to a magnitude restriction of iAB 23 and a double restriction in colour of 1.25 rAB −iAB 1.45 and −0.2 3.6µmAB −4.5µmAB 0.2. The subset of VIPERS galaxies was constructed using a manual selection of structure. Right: Number density on the sky of the selected galaxies using a square bin of 0.025deg. 3.4. Identifying potential satellite cluster X-ray sources As discussed earlier, self-similarity dictates that the satellite clusters this report attempts to identify must be composed in structurally the same way as the massive XXL clusters in question. This means ∼15% of their mass must be con- tained in the hot, X-ray emitting intracluster medium. As previously explained, likely clusters were conrmed from the XXL source catalog based on a lower limit exclusion in both source extension and extension likelihood and the most massive clusters in the redshift range we are investi- gating have source characteristics such that they are iden- tied as class 1 XXL clusters. Identifying clusters in this way has its limitations however, as in order for a cluster source to be extended the cluster must not only have a large physical size but also a signal well above ux limit for the observations. With both radius and X-ray ux di- rectly correlated to the mass of the cluster, it is clear that lower mass clusters - such as the satellites of massive clus- ters being searched for in this investigation - will unlikely demonstrate X-ray signals good enough to be conrmed as clusters from X-ray observations alone. X-ray sources from the ICM of the most massive satellites should still be de- tectable though, and with the locations of potential satel- lites determined from the overdensities observed in Ÿ3.3, it should be possible to identify any X-ray sources in the vicin- ity of these galactic overdensities with a view to estimate the mass of the satellites from their X-ray ux. By plotting the full XXL X-ray source catalogue in the RA-Dec plane, it was possible to identify sources in the vicinity of the potential satellites for three of the four clusters around which strong galactic overdensities were present. For each cluster, a selection of any sources in, or very close to, the identied potential satellites were taken. The extent of the selected sources in arcseconds was plot- ted against their respective extension likelihoods and the sources with properties most resembling clusters (those with the greatest extent and extension likelihood) were se- lected as the most promising candidates for ICM signal. Fig. 9 shows the position of these sources relative to the C1 and C2 XXL clusters, along with all the sources in the XXL catalogue. In the case of the apparently diuse satellite near cluster n0286, three potential sources were identied. It can be suggested from inspection of Fig. 7 that the overdensity near cluster n0286 can be split into at least two indepen- dent potential satellites. X-ray sources 1 and 2 are located in the vicinity of the upper overdensity, whilst source 3 is located in the lower. Assuming the sources are located the same distance away from Earth as the host cluster, the cluster redshift from the XXL catalogue can be used to calculate the lu- minosity distance to the potential satellites (Wright 2006). From this the X-ray luminosity L500 can be calculated from the X-ray ux of the selected sources. Using equation (2) it is then possible to deduce the mass of the satellite cluster from which the source is assumed to originate. The calcu- lated masses M500 of the potential satellite X-ray sources identied earlier are shown and discussed in Ÿ3.5.1. 3.5. Investigating the validity of potential cluster systems Now that potential satellite clusters have been identied from galactic overdensities and the masses of said clusters estimated from the ux of X-ray sources in their vicinity, it is important to check whether the systems discovered are physically valid. Investigations using the Millennium Simu- lations were used to determine whether the mass and sepa- ration of the potential satellites is reasonable and to verify whether the observed occurrence rates of massive satellites are in line with simulated predictions, whilst a method of mass estimation using stellar ux ratios was used as a self- consistency check to determine whether the X-ray sources are likely to originate from the assumed satellite clusters. Page 10 of 17
  • 11. Thomas Wigg 2015 | Hunting for satellites of the most massive galaxy clusters 35.6 35.7 35.8 35.9 36.0 -4.6 -4.5 -4.4 -4.3 -4.2 Count RA (deg) Dec(deg) 0 2 4 6 8 10 12 14 16 18 d z=0.6308; d ~ 6.23Mpc 35.4 35.5 35.6 35.7 35.8 35.9 -5.2 -5.1 -5.0 -4.9 -4.8 -4.7 Count RA (deg) Dec(deg) 0 1 2 3 4 5 6 7 d z=0.8327; d ~ 5.04Mpc 31.9 32.0 32.1 32.2 32.3 32.4 -4.7 -4.6 -4.5 -4.4 -4.3 d RA (deg) Dec(deg) 0 1 2 3 4 5 6 7 8 9 10 Countz=0.7556; d ~ 3.31Mpc 30.8 30.9 31.0 31.1 31.2 -5.2 -5.1 -5.0 -4.9 -4.8 Count RA (deg) Dec(deg) 0 1 2 3 4 5 6 7 8 9 d z=0.5202; d ~ 4.60Mpc Fig. 8. Number density on the sky of a selection of galaxies from the CFHTLS-W1 and VIPERS catalogue in a 0.25deg2 area around four selected XXL clusters, chosen using the techniques described in Ÿ3.1 and Ÿ3.2. Clockwise from top left, the XXL clusters shown are n0019, n0064, n0260, n0286. The locations of the X-ray sources from the XXL catalogue corresponding to each cluster are circled in white and the distance d between each cluster and the nearest overdensity are shown for scale, with the value noted at the top left of each plot. A square bin of 0.025deg was used. 3.5.1. Mass and separation of satellites from the Millennium Simulations The Millennium I and Millennium II Simulations are N- body simulations which plot the movement and growth of dark matter haloes at discrete redshift snapshots from the early universe through to the present day (0 z 15). The masses of the clusters are inferred from their halo mass and the history of each halo and its constituent parts are recorded. To check whether the estimated satellite masses and the separations from their host cluster are reasonable, the ve nearest mass haloes at the nearest redshift snapshot (this was within zcluster ± 0.15 in all cases) were taken and the mass and separation of the most massive satellite cluster recorded. Tab. 1 summarises these results and compares them to the observed mass and separation of the satellites determined in previous sections. In almost all cases does the estimated satellite mass fall within the predicted range and in cases where they do not, the observed characteristics are extremely close to those de- termined from the Millennium Simulations. In the case of the separations, all satellites fall well within the discovered range and within one standard deviation of the mean. Due to the fact that only the ve nearest mass clusters were taken from the simulations, the results shown here are by no means extensive enough to disregard the X-ray sources for which the satellite mass does not fall within the deter- mined range; in the case of n0064, the estimated satellite mass is only slightly greater than the upper limit on the range from the simulations. Considering n0286, compari- son to the range deduced from the simulations must be Page 11 of 17
  • 12. Hunting for satellites of the most massive galaxy clusters Table 1. Comparison of observationally determined satellite (sat.) masses and separations (sep.) with those determined from the Millennium Simulations. Potential satellite masses were estimated from the X-ray ux of sources assumed, but not conrmed, to have originated from the satellite's ICM. For cluster n0286, the satellite masses from top to bottom were calculated from X-ray sources 1, 2 and 3 respectively. 10 -3 10 -2 10 -1 10 0 10 1 10 2 10 3 10 -4 10 -3 10 -2 10 -1 10 0 10 1 10 2 10 3 10 4 XXL sources C2 clusters C1 clusters Satellite sources n0064 n0260 n0286 1 n0286 2 n0286 3 Extension Likelihood Extent(arcsec) Fig. 9. X-ray sources from the full XXL catalogue with sources corresponding to class 1 (blue) and class 2 (red) clusters indi- cated. A solid line at an extent of 15 arcseconds denes a lower limit for both cluster classes, with a solid line at an extension likelihood of 5 and dashed line at 33 establish the limits for C2 and C1 clusters respectively. X-ray sources located in the vicinity of the galactic overdensities corresponding to potential satellite clusters identied in Ÿ3.3 are shown. cautious as we are certainly considering at least the second most massive satellite and potentially the third, depend- ing on whether the galactic overdensity corresponds to two or three discrete satellites. Given more time, a mean and range of characteristics for the second and third most mas- sive satellites of the Millennium Simulation clusters would also be investigated and compared to those implied from observation. 3.5.2. Estimating the satellite mass from stellar ux In general, redshift information is not readily available from X-ray pointings alone, with optical follow-up often needed to determine the redshift of a cluster with any condence. Yu et al. (2011), among others, have investigated the pos- sibility of determining the redshift spectroscopically using the ubiquitous Fe-line complex in the X-ray spectrum of a cluster's ICM signal. To reliably determine a redshift in this manner, higher resolution and longer pointings than are generally available are necessary. For this reason, no redshift information is available for the potential satellite sources discussed earlier, meaning it cannot be condently asserted that the signal truly originates from the ICM of the potential satellite. With the additional galaxy uxes in the 3.6µm and 4.5µm bands that the CFHTLS-W1 cat- alogue provides, the total galactic ux of the cluster and satellite in each of the two bands can be determined. Es- kew et al. (2012) provide the following relation between the total 3.6µm and 4.5µm uxes in Jy (F3.6 and F4.5 respec- tively) and the total stellar mass of the cluster M∗, M∗ = 105.65 F2.85 3.6 F−1.85 4.5 D 0.05 2 M (5) where D is the luminosity distance to the cluster in Mpc. Given the quoted masses of the conrmed clusters from the XXL catalogue and by assuming that the ratio of stel- lar mass to total mass of a cluster is constant, it is possible to reach a mass estimate of the satellite based on galactic emission alone. By comparing this mass estimate with that deduced from the identied X-ray sources provides an ef- fective, albeit far from rigorous, consistency check for the validity of the calculated X-ray mass of the satellites: if the ratio of the inferred X-ray mass to 3.6µm/4.5µm mass is far from unity, this would suggest the satellite's ICM is not responsible for the X-ray signal. To determine the galaxies to include within the selection for the clusters and their satellites, it seemed most appro- Page 12 of 17
  • 13. Thomas Wigg 2015 | Hunting for satellites of the most massive galaxy clusters Table 2. Comparison of the satellite masses estimated from the X-ray ux of the XXL sources thought to originate in the satel- lite and the masses estimated from a calculation of their stellar mass based on their 3.6µm and 4.5µm ux - the ratio shown is between the latter and former mass estimates respectively. For cluster n0286, the satellite masses from top to bottom corre- spond to X-ray sources 1, 2 and 3 respectively. priate to use the virial radii. The virial radii of the satel- lites were calculated according to the method described in Ÿ3.2 using the masses inferred from the potential satellite X-ray sources; this again serves as an additional check for self-consistency. Using these calculated radii along with the virial radii of the XXL clusters determined earlier, a se- lection of all the galaxies, already subject to the relevant photometric cuts, inside the virial radius of each cluster and its satellites was made. In the case of the satellites, the po- sition of the X-ray source used to calculate its virial radius was used as the cluster centre. Following this, the total ux in both the 3.6µm and 4.5µm bands, calculated by summing the individual ux from each of the galaxies, was used to determine the stellar mass of the galaxies in the selection for each cluster and their satellites using equation (5). An estimate of the total satellite mass, based on the satellite's and its host cluster's stellar mass was then calculated using the ratio method described earlier. Tab. 2 shows the resulting total mass estimates for the satellites based on the X-ray ux of the sources thought to originate from the satellite's ICM and the stellar mass ratios independently, along with a ratio of these values for comparison. The fact that the resulting ratios do not fall close to unity appears unfortunate for the continued assumption that the satellites' ICM is responsible for the X-ray sources used to calculate an estimate for their mass. However, due to the sheer number of points at which error on the mass estimate based on the stellar mass can be accumulated throughout the calculations and conversions, a result of this mass estimate being ∼ 9% to ∼ 321% of the mass calcu- lated from the X-ray signal may actually be an encouraging result. Again, this section of the investigation should not hope to conrm with any certainty that the X-ray sources selected do come from the satellite cluster, but instead iden- tify any sources for which the X-ray mass estimate and the mass calculated from the 3.6µm and 4.5µm uxes dier by such an extreme amount that the source can be rejected; in this case none of them appears too unreasonable to exclude at this point. 3.5.3. Expected observed satellite occurrence rates from the Millennium Simulations The previous subsections have been useful in determining whether the properties of the potential satellite clusters discovered are reasonable. It is also of interest conrming whether the occurrence rate of massive clusters and their satellites detected is to be expected in the universe as it is currently understood. Again, the Millennium Simulations provide a unique opportunity to investigate the number of these massive clusters with satellite companions that are actually present in a universe modelled to represent ours. Following the simulation of the growth of dark matter haloes, twenty-four 1deg 2 light cones representing a view of the sky from redshift 0 were produced and individual galaxies were `painted' onto each halo in each cone us- ing computer models of cluster structure. These provide a unique opportunity of exploring a simulated universe from a xed viewpoint, such as observations of the real universe are made from Earth. For each of eight light cones chosen at random a redshift restriction of 0.5 z 0.9 was made and a subset of any galaxies located in a containing cluster with a central virial mass of greater than 1014 M was created. This limit was chosen as the massive clusters chosen from the XXL survey around which potential satellites were identied were of a mass of this order of magnitude or greater. Once these most massive clusters were identied, a further subset of galaxies with central virial mass greater than 1013 M contained in a 0.25deg 2 square area of `sky' within a redshift cut of ±0.02 about the cluster centre was taken. An area of this size was chosen as it corresponds directly to the area about each XXL cluster within which satellites were searched for whilst this redshift range was selected as any identiable structure from the spectroscopic selections made in Ÿ3.1 was contained within this cut. A cuto mass of 1013 M was used as this was the order of the lower limit on the cluster mass estimated from the X-ray sources thought to originate from the potential satellites. The RA-Dec plane for each subset was then plotted and the number of satellite clusters around each 1014 M cluster were recorded. Tab. 3 shows a summary of the results from the sample of eight light cones. This part of the investigation enabled two important insights: rst a test of the rate of detection of massive clusters from the XXL survey and second a check of whether the number of satellites identied in this report is reasonable. On the rst count, a total of 36 clusters of mass 1014 M were identied, corresponding to a mean number of 5 massive clusters per square degree, in the stated red- shift range of 0.5 z 0.9. Compare this to the 11 XXL clusters in the ∼8deg 2 overlap with the VIPERS region and it is clear there is a discrepancy between the number pre- dicted by the simulations and what is actually observed. This suggests that the cluster catalogue produced by XXL is not extensive, even for the most massive end of the clus- ter population, for which their X-ray signal should be most easily classied. This also supports the assertion that there are still many unclassied cluster signals in the XXL source catalogue, which was the assumption used when selecting potential satellite X-ray signals. On the question of the fre- quency of satellite systems, it quickly became apparent that the number of satellites per cluster in the simulations far exceeded that which we observed on the sky, with a mean number of 5 satellites per cluster found across the eight Page 13 of 17
  • 14. Hunting for satellites of the most massive galaxy clusters Table 3. The total and average number per square degree of massive ( 1014 M ) clusters from a sample of eight 1deg2 light cones produced from the Millennium Simulations. The average number of satellite ( 1013 M ) clusters observed in a 0.25deg2 area of `sky' about each massive cluster is also shown. cones. With 1 conrmed (see Ÿ4.2) and 5 likely satellites identied around 4 of the 11 XXL clusters investigated, the results from the simulations may seem irreconcilably dier- ent. However, when identifying potential satellites, only the greatest overdensity around each XXL cluster was investi- gated. Looking back to Fig. 8, it is clear there is more than one area of overdensity present in the vicinity of most of the clusters, each of which could correspond to an additional satellite cluster. This highlights an issue in the method and suggests that it would advantageous to return to each of the chosen clusters and investigate these further overdensities in the same way as the potential satellites identied in order to more eectively compare the rate of satellite occurrence with observation. This does not, however, account for the fact that around every one of the 36 massive clusters in the simulations was there at least one satellite. Of the clusters for which it was possible to identify a red sequence and com- bine this selection with the VIPERS subset, of which there were 6, 4 showed apparent satellites in their vicinity. Whilst this rate is markedly lower than the simulations, with such a small sample size of XXL clusters it is dicult to make any further comment of whether the simulations and ob- servations truly contradict. Note this section includes the count of the C2 (n0211) satellite found in the vicinity of C1 cluster n0219, discussed in Ÿ4.2 for more accurate compar- ison between the observations and simulations. 4. Discussion 4.1. Sources of uncertainty and potential improvements The nature of this project means that areas of potential er- ror incursion are numerous. With regard to the galaxy cat- alogues used, the area of sky surveyed is not continuous for either catalogue, with the VIPERS region split into many distinct rectangular regions with signicant gaps between. This means there are times when combining selections that an area of interest falls in or near a gap in the VIPERS range. The sampling rate for neither survey is complete, with the sampling rate of the VIPERS catalogue uctuat- ing around a redshift-variable value of ∼ 40% (Guzzo et al. 2014). Both of these factors mean that the view of sky inves- tigated, whilst still very useful in the search for structure, is incomplete and as such there is the potential for unseen systems. Despite this, the redshift information provided by the VIPERS catalogue is incredibly precise and provides one of the most useful tools in the search for cluster sys- tems: it is not only possible to identify clustering in the three-dimensional distribution of VIPERS galaxies, but to conrm the presence of true galactic overdensities in the CFHTLS-W1 catalogue which are only inferred by selec- tion. When making selections in the CFHTLS-W1 catalogue by locating the red sequence, a horizontal cut in colour was made. This was discussed earlier, with a comment made on the diculty of identifying the red sequence, let alone its slope, when any selection of cluster members was inherently polluted by eld galaxies. Gladders Yee (2000) use the CRS (cluster red sequence) algorithm to identify the red se- quence computationally. It would be interesting to attempt the identication of the red sequences of the XXL clusters investigated in this paper in the CFHTLS-W1 catalogue using the CRS algorithm. If successful, it would provide a more rigorous method of identication and would allow se- lections to be made about the slope of the sequence, though the ratio of sequence galaxies to eld galaxies in the cluster region may prove problematic. The nature of binning galaxies when combining the CFHTLS-W1 and VIPERS selections means that, should a satellite cluster straddle the border between two or more bins, it will appear less overdense than if the cluster were central in a bin, meaning the potential for missed identi- cation of true satellites was present. Another issue faced was the fact that x-y binning has the eect of smoothing the data along those principal axes. This means that identifying whether larger satellites are truly extended or in fact multi- ple discrete clusters and locating any lamentary structure is inherently dicult. The eect of this was minimised by plotting the number density of galaxies using a variety of bin sizes and identifying overdensities in each case. When attempting to identify X-ray sources originating from the potential satellites, the obvious issue is that with- out any redshift information about the source, there is no way of knowing whether it is truly the signal from the clus- ter's ICM or a chance projection along the line of sight. The masses estimated from the sources seem encouraging, but the majority of the sources in the region of sky investigated are in an X-ray ux range that would produce a reason- able estimated cluster mass using equation 2. For this rea- son, calculating an estimate for the mass is more useful in identifying sources which are obviously too bright to orig- inate from a cluster and can therefore be excluded. How- ever, when considering the position of the potential satellite sources in the extent-extension likelihood plane (see Fig. 9), their proximity to the conrmation threshold, especially in the case of the three sources identied for n0286, suggests they are extended sources and is further evidence in sup- port of the assumption they are cluster signals. It is worth noting however, the uncertainty in X-ray-based cluster de- tection; with such a wide variety of X-ray sources in the universe, many of which displaying emission similar to that of a cluster, conrmation through other detection methods is often required to classify a cluster with condence. The XXL sources identied as class 2 clusters have a ∼50% pos- sibility of in fact originating from an AGN (Pierre XXL Consortium 2014). The ability to compare the characteristics of the po- tential satellites with the properties of similar cluster sys- tems from the Millennium Simulations is advantageous, but the small sample size means that excluding any anomalous systems would only have been possible should the satellite mass estimate and/or separation from its massive compan- ion have fallen well outside the range recorded from the sim- Page 14 of 17
  • 15. Thomas Wigg 2015 | Hunting for satellites of the most massive galaxy clusters ulations; in the case of all systems investigated, the proper- ties of the potential satellites fall in or very near this range and are therefore deemed reasonable. Given more time, a more extensive list of similar systems from the simulations would have been created such that any anomalous observa- tions could be more easily identied. Estimating the satellite mass using the mass ratios cal- culated from the stellar ux was intended to provide a useful self-consistency check for the selected potential satellite X- ray sources and whilst, again, it allows the identication of any sources which are obviously too bright, inherent aws in the method mean that error is inccured at almost every step. As mentioned, the sampling rate for the CFHTLS-W1 catalogue is not complete, and further to this, only galaxies for which 3.6 and 4.5 micron uxes are recorded were avail- able. In the case of the ratio method used, this will only leave the satellite mass estimate unaected if the ratio of galaxies for which 3.6/4.5 micron data is available to the total number of galaxies is identical for the satellite and its massive companion: an assumption which will inevitably incur a varying amount of error for each of the identied systems. The same is true when considering the photomet- ric restrictions made in Ÿ3.1: the ratio is only consistent provided the proportion of the number and ux of galax- ies selected between the satellite and conrmed cluster is indicative of the true ratio of these quantities. The eect of background counts of eld galaxies projected along the line of sight when selecting cluster members was also ne- glected, which will cause an over-estimation of the satellite mass. It would be more rigorous to determine and subtract an average background ux from the total stellar ux of the clusters before calculating their mass. However, with the other sources of error incurred and the relatively low background galaxy count, this will be of negligible eect. When determining the number of massive clusters and companion satellites from the Millennium Simulation light cones, deciding clusters to include in each count posed an is- sue. When using the simulations the information about each galaxy's containing structure, and the mass of the cluster of which it is a member, is readily available; this is evi- dently not the case for real observations. For this reason, only satellites in the simulations with galaxy densities in excess of around ve per square arcminute were counted, corresponding to the lower limit of the bin density seen for the potential satellites identied. Despite this, this makes no correction for the fact that the Millennium Simulations are an extensive galaxy population, not subject to any of the survey sampling rates or selections made from the cata- logues in this investigation. This goes some way to explain- ing the increased number of massive clusters with compan- ion satellites recorded from the simulations. This nal part of the investigation would be improved by making appro- priate corrections for the selection eects intrinsic of real observations. 4.2. Conrming potential satellites and a comment on method This investigation aimed to identify satellite clusters of more massive, X-ray detected clusters; has this aim been fullled? The project combined many techniques for dis- covering satellites and determining the validity of the po- tential cluster systems identied, none of which alone is enough to conrm the presence of the satellites discovered. Many of the satellite properties determined are also subject to large potential error or operate under bold assumption and are therefore of use only to exclude obviously anoma- lous systems. However, with all the information provided by these techniques, it can be stated that no single piece of evidence contradicts the claim that 5 satellite clusters have been discovered around 3 conrmed XXL clusters, and the combination of all of the determined properties and com- parison with simulated expectations alludes to the true ex- istence of the potential systems identied. This is especially true for cluster n0286, whose three identied satellites all have potential X-ray sources with extent above and exten- sion likelihood very close to the XXL cluster conrmation threshold. In order to conrm with any certainty the pres- ence of these satellites, longer X-ray pointings or follow-up observations to determine the velocity dispersions of the member galaxies are required. A nal comment on the method of galaxy selection is provided by the cluster system in Fig. 10. The subset of CFHTLS-W1 galaxies shown was selected as usual by iden- tifying the red sequence of the class 1 XXL cluster n0219, which has a mass of M500 = 12.8 × 10¹³ M located at red- shift z = 0.6265. When the corresponding double colour cut was made, a strong overdensity at the location of class 2 XXL cluster n0211, with a mass of M500 = 7.56×10¹³ M at redshift z = 0.6090, a distance of ∼ 6.44Mpc from n0219 was identied. A selection of VIPERS galaxies in redshift was made with a slightly larger range to encompass both clusters and their likely surrounding structure, with strong overdensities apparent at the positions of the two clusters also. Returning to the Millennium Simulations, identifying the ve nearest mass haloes to that of n0219 and recording the mass and separation of the most massive satellite, the cluster system shown in Fig. 10 is of reasonable properties to suggest that the two clusters will eventually undergo a merger. At the very least, it can be said that this system is exactly of the type this investigation has been attempting to identify. This supports the fact that the satellite systems being searched for do exist and that it is the technical lim- itations of the observations that restrict their discovery - cluster n0211 happens to have source characteristics such that it can be identied from the X-ray signal of its ICM alone. More encouragingly though, it also supports the va- lidity of the red sequence method, not only to identify the cluster itself, but also any surrounding satellites formed at the same cosmic epoch. 4.3. Future With such a limited area of sky as was available for this investigation, attempting any sort of statistics regarding occurrence rates and characteristic properties of satellite systems is dicult: only 11 XXL clusters in the redshift range were examined and of these only 3 (4 including n0219) show evidence of likely companion satellites. The extended ROentgen Survey with an Imaging Telescope Ar- ray (eROSITA) is a revolutionary new observatory due to launch in 2016, designed to probe the entire X-ray sky with unprecedented spectral and angular resolution out to red- shifts z 1: mapping in the soft band (0.5-2keV) will be twenty times more sensitive than the ROSAT all-sky survey whilst in the hard band (2-10keV) it will provide the rst ever true imaging survey of the sky at that energy (Merloni et al. 2012). The mission has many goals, most relevant of Page 15 of 17
  • 16. Hunting for satellites of the most massive galaxy clusters 37.0 37.1 37.2 37.3 37.4 37.5 -4.9 -4.8 -4.7 -4.6 -4.5 Count RA (deg) Dec(deg) 0 2 4 6 8 10 12 14 16 z 1 =0.6265, z 2 =0.6090; d ~ 6.44Mpc d Fig. 10. Number density on the sky of a selection of galaxies from the CFHTLS-W1 and VIPERS catalogues in a 0.25deg2 area around around XXL clusters n0219 (class 1; left) and n0211 (class 2; right). The selections were made according to Ÿ3.1 and Ÿ3.2 using n0219 as the reference cluster. The locations of the X-ray sources from the XXL catalogue corresponding to each cluster are circled in white and the distance d between the two clusters is shown for scale, corresponding to a physical separa- tion of ∼ 6.44Mpc. A square bin of 0.025deg was used. which is the predicted identication of ∼ 105 new galaxy clusters. The all-sky nature of eROSITA's planned survey has many distinct advantages. With the entire sky surveyed to a depth comparable to XXL, the geometry of large-scale structure in the universe will be accurately determined and with the predicted discovery of so many new clusters, pro- ducing rigorous statistics about the distribution of matter and its containing systems will, for the rst time, become a possible reality. With over 40,000deg 2 of sky mapped (com- pared to the ∼ 8deg 2 of this investigation), eROSITA will also nd intrinsically rare objects. With its improved reso- lution, eROSITA will also be able to better identify cluster signals from the population of AGN and other X-ray sources in the universe. For these reasons, eROSITA will allow the rst real possibility of comparing the large-scale distribu- tion of matter in the universe with modelled predictions such as those provided by the Millennium Simulations. eROSITA should not only detect many systems like that of n0219/n0211 shown in Fig. 10, but also clusters whose satellites currently fall below the detection threshold of cur- rent observations. This will allow some insight into the dis- tribution of mass around larger clusters and also allow cal- culations of the percentage of mass contained in observable cluster satellites to be made. The method of satellite iden- tication developed in this investigation will not be made redundant however, as utilising a combination of techniques such as in this paper will prove valuable in situations when a single observational technique is insucient to conrm the presence of a cluster. However, it is a time-consuming method which requires good coverage in both optical pho- tometric and spectroscopic galaxy, and deep eld X-ray ob- servations. With minor improvements made according to the issues identied, the techniques described in this paper should still provide an eective means of satellite cluster identication when X-ray observations alone are insucient to conrm their existence, but in the case of combining it with data from the eROSITA observatory, it will likely have to be restricted to points of interest as applying this tech- nique to the whole sky is not practically valid. 5. Summary The project utilised a sample of 11 clusters from the XMM- XXL cluster survey in the redshift range 0.5 z 0.9 found in the overlap region of the VIPERS and CFHTLS- W1 galaxy catalogues. Using the spectroscopic redshift in- formation of the VIPERS catalogue and photometric data of the CFHTLS-W1 catalogue to create a subset of galaxies about each cluster likely to be part of the conrmed cluster or any surrounding undetected clusters, potential satellites were identied by looking for overdensities in the number of galaxies when combining these selections. Sources from the full XXL catalogue thought to originate from any satel- lites were selected and mass estimates calculated based on their X-ray ux. The validity of any identied systems was then investigated through comparison with similar systems from the Millennium Simulations and an additional mass estimate calculated based on the stellar ux of each satel- lite and its more massive companion - the latter also acting as a check of self-consistency of the satellites' potential X- ray sources. Finally, using light cones from the Millennium Simulations the occurrence rate of cluster systems detected with apparent satellites and the number of these associated satellites around each cluster was compared to expected rates predicted by the computer models. In total, 5 potential satellites around 3 of the XXL clus- ters in addition to a C2 satellite of a more massive C1 cluster were identied, all of which have masses and sep- arations from their companion cluster deemed reasonable following comparison with the simulations. The masses es- timated from the stellar ux were subject to large errors and as such provided little use other than to identify any extremely anomalous properties, of which there appeared to be none. Finally, the rate of clusters with companion satel- lites and the number of satellites per cluster both appeared much greater in the simulations than real observations - this was attributed to the incomplete sampling rate of the galaxy surveys used, the diuse nature of satellites in the simulation and selection eects intrinsic of the techniques employed. Follow-up observations would be required to con- rm the presence of the potential satellites, as this was not possible with the information gathered in this investigation alone; though no single piece of evidence suggests the satel- lite candidates found are not true clusters. Little rigorous statistical insight has been possible with such a small sample size, however the launch of the all-sky eROSITA X-ray observatory should provide a more than sucient population of galaxy clusters to investigate and allow truly eective comparison between simulation and observation. Acknowledgements. I would like to thank my partner, J. Ider Chitham, for his continuous input to the project, along with Prof M. Bremer, Dr B. Maughan, Miss K. Husband and Dr M. Taylor for guidance throughout the duration of the investigation. Page 16 of 17
  • 17. Thomas Wigg 2015 | Hunting for satellites of the most massive galaxy clusters References Abell, G. O. 1958, Astrophys. J. Suppl. Ser., 3, 211 Abell, G. O., Corwin, Harold G., J., Olowin, R. P. 1989, Astrophys. J. Suppl. Ser., 70, 1 Abraham, R. G., Valdes, F., Yee, H. K. C., van den Bergh, S. 1994, Astrophys. J., 432, 75 Allen, S. W., Schmidt, R. W., Fabian, A. C. 2002, Mon. Not. R. Astron. Soc., 334, L11 Balogh, M. L., Christlein, D., Zabludo, A. I., Zaritsky, D. 2001, Astrophys. J., 557, 117 Barger, A. J., Aragon-Salamanca, A., Smail, I., et al. 1998, Astrophys. J., 501, 522 Bartelmann, M. Schneider, P. 1999 [arXiv:9912508] Birkinshaw, M. 1991, Phys. Cosmol. Birkinshaw, M. 1999, Phys. Rep., 310, 97 Bower, R., Lucey, J., Ellis, R. 1992, Mon. Not. R. Astron. Soc., 254 Boylan-Kolchin, M., Springel, V., White, S. D. M., Jenkins, A., Lemson, G. 2009, Mon. Not. R. Astron. Soc., 398, 1150 Carlstrom, J. E., Ade, P. A. R., Aird, K. A., et al. 2009 [arXiv:0907.4445] Carlstrom, J. E., Joy, M. K., Grego, L., et al. 2000, Phys. Scr., T85, 148 Chwolson, O. 1924, Astron. Nachrichten, 221 Clerc, N., Adami, C., Lieu, M., et al. 2014, Mon. Not. R. Astron. Soc., 21, 1 Czakon, N., Donahue, M., Medezinski, E., CLASH, Bolocam. 2014, Am. Astron. Soc. De Lucia, G. Blaizot, J. 2007, Mon. Not. R. Astron. Soc., 375, 2 Dressler, A., Oemler, Â Augustus, J., Couch, W., et al. 1997, Astro- phys. J., 490, 577 Einstein, A. 1936, Science, 84, 506 Eskew, M. R., Zaritsky, D. F., Meidt, S. E. 2012, Astron. J., 143, 139 Fabricant, D., Lecar, M., Gorenstein, P. 1980, Astrophys. J., 241, 552 Fakhouri, O., Ma, C.-P., Boylan-Kolchin, M. 2010, Mon. Not. R. Astron. Soc., 406, 2267 Fowler, J. W., Niemack, M. D., Dicker, S. R., et al. 2007, Appl. Opt., 46, 3444 Garilli, B., Guzzo, L., Scodeggio, M., et al. 2014, Astron. Astrophys., 562, A23 Giodini, S., Lovisari, L., Pointecouteau, E., et al. 2013, Space Sci. Rev., 177, 247 Gladders, M. D., Lopez-Cruz, O., Yee, H. K. C., Kodama, T. 1998, Astrophys. J., 501, 571 Gladders, M. D. Yee, H. K. C. 2000, Astron. J., 120, 2148 Guzzo, L., Scodeggio, M., Garilli, B., et al. 2014, Astron. Astrophys., 566, A108 Hagino, K., Stawarz, L., Siemiginowska, A., et al. 2015, eprint arXiv:1503.07244 Herschel, W. 1785, Philos. Trans. R. Soc. London, 75, 213 Hu, W. Kravtsov, A. V. 2003, Astrophys. J., 584, 702 Hudelot, P., Cuillandre, J.-C., Withington, K., et al. 2012, VizieR On-line Data Cat. II/317. Orig. Publ. 2012yCat.2317....0H Kato, Y., Nakazawa, K., Gu, L., et al. 2015, eprint arXiv:1504.02708 Kravtsov, A. V. 2013, Astrophys. J., 764, 5 Laporte, C. F. P., White, S. D. M., Naab, T., Gao, L. 2013, Mon. Not. R. Astron. Soc., 435, 901 Lidman, C., Iacobuta, G., Bauer, A. E., et al. 2013, Mon. Not. R. Astron. Soc., 433, 825 Mather, J. C., Cheng, E. S., Eplee, R. E., J., et al. 1990, Astrophys. J., 354, L37 McBride, J., Fakhouri, O., Ma, C.-P. 2009, Mon. Not. R. Astron. Soc., 398, 1858 Mehrtens, N., Romer, A. K., Hilton, M., et al. 2012, Mon. Not. R. Astron. Soc., 423, 1024 Menanteau, F., González, J., Juin, J.-B., et al. 2010, Astrophys. J., 723, 1523 Merloni, A., Predehl, P., Becker, W., et al. 2012, eprint arXiv:1209.3114, 84 Messier, C. 1781, Connoissance des Temps 1784, 227 Mitchell, R., Culhane, J., Davison, P., Ives, J. 1976, Mon. Not. R. Astron. Soc., 175 Mo, H., van den Bosch, F., White, S. 2010, Galaxy Formation and Evolution (Cambridge: Cambridge University Press) Navarro, J., Frenk, C., White, S., et al. 1997, Astrophys. J., 490, 493 Neumann, D. M. Arnaud, M. 2001, Astron. Astrophys., 373, L33 Pacaud, F., Pierre, M., Refregier, A., et al. 2006, Mon. Not. R. Astron. Soc., 372, 578 Pierre, M., Pacaud, F., Juin, J. B., et al. 2011, Mon. Not. R. Astron. Soc., 414, 1732 Pierre, M. XXL Consortium. 2014, X-ray Universe 2014 Piaretti, R., Arnaud, M., Pratt, G. W., Pointecouteau, E., Melin, J.-B. B. 2010, Astron. Astrophys., 534, 17 Planck Collaboration. 2013, eprint arXiv:1303.5089, 42 Press, W. H. Schechter, P. 1974, Astrophys. J., 187, 425 Reichardt, C. L., Stalder, B., Bleem, L. E., et al. 2012, 22 Sandage, A., Binggeli, B., Tammann, G. A. 1985, Astron. J., 90, 1759 Sarazin, C. L. 1988, X-ray emission from clusters of galaxies (Cam- bridge: Cambridge Astrophysics Series, Cambridge University Press) Schade, D., Barrientos, L. F., López-Cruz, O. 1997, Astrophys. J., 477, L17 Schechter, P. 1976, Astrophys. J., 203, 297 Springel, V., White, S. D. M., Jenkins, A., et al. 2005, Nature, 435, 629 Storm, E., Jeltema, T. E., Rudnick, L. 2015, Mon. Not. R. Astron. Soc., 448, 2495 Sunyaev, R. A. Zel'dovich, Y. B. 1970, Astrophys. Space Sci., 7 Sunyaev, R. A. Zel'dovich, Y. B. 1972, Comments Astrophys. Sp. Phys., 4 Tauber, J. A., Mandolesi, N., Puget, J.-L., et al. 2010, Astron. Astro- phys., 520, A1 van Dokkum, P. G., Franx, M., Kelson, D. D., Illingworth, G. D. 1998, Astrophys. J., 504, L17 Vanderlinde, K., Crawford, T. M., de Haan, T., et al. 2010, Astrophys. J., 722, 19 Voit, G. 2005, Rev. Mod. Phys., 77, 207 Weymann, R. 1965, Phys. Fluids, 8, 2112 Weymann, R. 1966, Astrophys. J., 145, 560 Wright, E. 2006, Publ. Astron. Soc. Pacic, 118, 1711 Yu, H., Tozzi, P., Borgani, S., Rosati, P., Zhu, Z.-H. 2011, Astron. Astrophys., 529, A65 Zhang, B., David, L., Jones, C., et al. 2015, eprint arXiv:1503.07694 Zwicky, F. 1933, Helv. Phys. Acta, 6, 110 Zwicky, F. 1937, Astrophys. J., 86, 217 Page 17 of 17