The LabVIEW programming environment was used to build a data acquisition program to monitor instruments for the University of North Florida's Helium Liquefier System. LabVIEW was used as a graphical programming tool to acquire data from a Keithley 2000 Digital Multimeter, which monitors the voltage and current outputs from four level switches, two hygrometers, and a helium purity meter. An initial LabVIEW program, or virtual instrument, was created to scan and read the voltage output of the four level switches to monitor the activation of compressors in the helium liquefier system.
1. Data acquisition and monitoring using LabVIEW
By Thomas Olejniczak
Department of Physics, University of North Florida, Jacksonville, FL, 32224
The LabVIEW programming environment was
chosen to build a data acquisition program to
monitor the instruments vital for efficient
operation of University of North Florida’s Helium
Liquefier System. LabVIEW is being utilized as a
graphical programming environment to perform
this data acquisition from a Keithley 2000 Digital
Multimeter. The Keithley 2000 will monitor the
voltage and current outputs from four level
switches, two hygrometers, and a helium purity
meter. The LabVIEW program was utilized to
scan and read the channels from a General
Purpose Interface Bus(GPIB) to USB connected
to the Keithley 2000. An initial Virtual
Instrument (VI) program was written in
LabVIEW to scan and read out the voltage output
for the four level switches to monitor the
activation of the Bauer compressors.
ABSTRACT
FIG. 2. The Front Panel allows the
user to monitor and control aspects
of the block diagram while the
program is running.
FIG. 1. The Block Diagram window
in LabVIEW allows the user to build
the structure of the Virtual
Instrument program.
HELIUM LIQUEFIER LabVIEW PROGRAM
LabVIEW is a graphical programming environment suited for computer
controlled data acquisition and analysis. Each program created in LabVIEW
is called a virtual instrument, or VI. The LabVIEW program utilizes data
flow programming and graphical structures to create block diagrams in
designing each VI.1
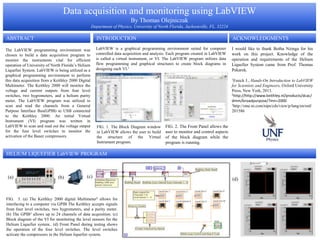
FIG. 3. (a) The Keithley 2000 digital Multimeter2 allows for
interfacing to a computer via GPIB The Keithley accepts signals
from four level switches, two hygrometers, and a purity meter.
(b) The GPIB3 allows up to 24 channels of data acquisition. (c)
Block diagram of the VI for monitoring the level sensors for the
Helium Liquefier system.. (d) Front Panel during testing shows
the operation of the four level switches. The level switches
activate the compressors in the Helium liquefier system.
ACKNOWLEDGMENTSINTRODUCTION
I would like to thank Botha Nzinga for his
work on this project. Knowledge of the
operation and requirements of the Helium
Liquefier System came from Prof. Thomas
Pekarek.
1Essick J., Hands-On Introduction to LabVIEW
for Scientists and Engineers, Oxford University
Press, New York, 2013.
2http://http://www.keithley.nl/products/dcac/
dmm/broadpurpose/?mn=2000
3http://sine.ni.com/nips/cds/view/p/lang/en/nid/
201586
(d)(a) (c)(b)