Fluid Mechanics Centrifugal Pump Performance Experiment
•
11 gostaram•24,029 visualizações

Part of the Fluid Mechanics curriculum at Cal Poly Pomona was to analyze the performance of a centrifugal pump and generate a report of the relevant results.

Recomendados
Mais conteúdo relacionado
Mais procurados
Mais procurados (20)
Destaque
Destaque (20)
Semelhante a Fluid Mechanics Centrifugal Pump Performance Experiment
Semelhante a Fluid Mechanics Centrifugal Pump Performance Experiment (20)
Último
Último (20)
Fluid Mechanics Centrifugal Pump Performance Experiment
- 1. California State Polytechnic University, Pomona Mechanical Engineering Department MEMORANDUM To: Professor Biddle Date: Nov. 11, 2014 From: Thomas Gross Subject: Centrifugal Pump Performance Experiment The purpose of this experiment was to determine the performance characteristics of a Bell & Gossett Model 1510 centrifugal pump in the form of pump head, power input to the pump, and pump efficiency as a function of flow rate for pump speeds of 1150 rpm and 1750 rpm and compare them to the manufactures data presented in figure 3 and figure 4 in the lab manual on pages 26 and 27 respectively. The pump in use (Pump A) has a 5 5 ⁄8 “ diameter impeller and is ran by a 5 HP, 3 Phase, 460V, 184T frame motor which is controlled with a square D variable frequency controller (3 Phase, 460V, 20A rating). The pump is part of a closed pipe loop where water is fed from a 4 ft. diameter industrial water reservoir. The suction side pipe has a nominal diameter of 1.5” and the discharge side pipe has a nominal diameter 1.25”. The inside pipe diameter was determined using Appendix C in the lab manual on page 56. A digital display panel read out the pump speed, the pressure difference across the pump, the water temperature, the shaft torque, which was measure by a Himmelstein torquemeter, and the volumetric flow rate through the pump, which was measured by a turbine flow meter downstream of the pump. Prior to turning the pump on, ball valves 1, 2, and 3 were opened, as seen in the schematic. The instructor turned the pump on and adjusted the speed to 1150rpm. Data was recorded at 100, 85, 70, 55, 40, 25, and 0% flowrates by adjusting the globe valve where the maximum (100%) flowrate was obtained by fully opening valve. The globe valve was only closed for a few seconds to prevent damage to the operating pump from the increasing pressure on the suction side due to the 0% flowrate. The pump was then turned off and the speed set to 1750 rpm and the procedure repeated. The pump head (hp) which consists of the static(elevation) head, friction head, pressure head, and the velocity head measures the total resistance the pump must overcome in unit feet (meter for SI system). It was calculated using the conservation of energy equation for steady flow through a control volume which in this case is the pump. This equation contains both the pressure head and the elevation head since the pressure differential measured across the pump is the sum of the static and hydrostatic pressures. The power delivered to the water by the pump 푊̇ 표푢푡 , the power delivered to the pump by the motor or the brake horsepower 푊̇ 푖푛, and the pump efficiency ηp where then calculated at each flowrate Q(gpm) using the formulas presented on page 24 of the lab manual. This data was tabulated and is presented in Table 3
- 2. and Table 4. Three plots were created, each presenting data for the 1150rpm run and the 1750 rpm run in the form of hp vs Q, 푊̇ 푖푛vs Q, and ηp vs Q and are presented in Figure 1, Figure 2 and Figure 3 respectively. During the experiment, the pump was unable to be ran at a speed of 1150rpm and the instructor set the speed to 1140rpm. The data reflects this change. The pump in the lab was never to be ran at 1750rpm and was expected to be ran at 1740rpm, however the higher speed was causing problems and the instructor provided the experimental data. The hp vs Q curve starts off horizontal and begins to slope downward as the flowrate is increased. This indicates that the maximum pump head is at low flowrates ranging between 0 to 15 gpm. The 푊̇ 푖푛vs Q graph is rather uninformative in this case. The manufacture does not present any data regarding power into the pump for the low speed, and only two data points for the high speed. The curve, which has a positive slope, indicates that as the flowrate is increased the power to the pump must also be increased. The ηp vs Q curve shows us that the as the flowrate is increased from zero the efficiency increases until it reaches a maximum and then begins to decrease. For the 1140rpm run the maximum efficiency is achieved at a flowrate of approximately 25 gpm and for the 1740rpm run the maximum efficiency is achieved at a flowrate of approximately 35gpm. In all cases the 1740rpm run has greater values than the 1140rpm run. The 1740rpm run starts with a larger pump head, requires a larger work input, and reaches a higher efficiency than the 1140 rpm run. The percent differences between the experimental and manufactures curves are presented in Table 5 and Table 6 highlighting the minimum and maximum values. Unfortunately the experimental pump speed and the manufacturers pump speeds were not identical and therefor greater error encured, however it was expected that there would be error since the pump in the laboratory sits with water in it for months on end which does cause corrosion. This corrosion would cause the pump head to decrease, and the efficiency to decrease. However as seen in the graph, for slower flowrates, the experimental efficiency for the 1740 rpm run was more efficient than what the manufacturer posted for 1750 rpm, which was not expected. Due to corrosion in the pump, the power input required was expected in increase to overcome this loss, however since the data is for 1740 and 1750 and it is hard to accurately use the graph to determine if this is true.
- 3. Table 1: Raw Data from the 1140 rpm Run Run # N (RPM) T (lb·in) △P (Psi) Q (gpm) 1 1140 14.9 3.11 38.2 2 1140 13.9 4.09 32.3 3 1140 12.4 4.84 26.3 4 1140 11.8 5.29 21.0 5 1140 10.2 5.57 15.2 6 1140 9.7 5.73 10.8 7 1140 7.5 5.74 0.00 Table 2: Raw Data from the 1740 rpm Run Run # N (RPM) T (lb·in) △P (Psi) Q (gpm) 1 1740 26.39 4.79 65.51 2 1740 24.32 8.31 55.23 3 1740 22.10 10.65 46.10 4 1740 19.50 12.65 36.10 5 1740 16.70 13.65 16.39 6 1740 13.80 14.37 16.25 7 1740 9.61 14.50 0.00 Table 3: Results from the 1140 rpm Run Run # N (rpm) Q̇ (gpm) Q̇ (ft3/s) Vin (ft/s) Vout (ft/s) hp (ft) Ẇout(hp) Ẇin(hp) ηth (%) 1 1140 38.2 0.085 6.0 8.2 7.7 0.07 0.27 27.4 2 1140 32.3 0.072 5.1 6.9 9.8 0.08 0.25 31.7 3 1140 26.3 0.059 4.2 5.7 11.4 0.08 0.22 33.8 4 1140 21.0 0.047 3.3 4.5 12.4 0.07 0.21 30.7 5 1140 15.2 0.034 2.4 3.3 12.9 0.05 0.18 26.9 6 1140 10.8 0.024 1.7 2.3 13.27 0.04 0.17 20.7 7 1140 0.00 0.000 0.0 0.0 13.25 0.00 0.14 0.00 Table 4: Results from the 1740 rpm Run Run # N (rpm) Q̇ (gpm) Q̇ (ft3/s) Vin (ft/s) Vout (ft/s) hp (ft) Ẇout(hp) Ẇin(hp) ηth (%) 1 1740 65.51 0.146 10.3 14.0 12.4 0.21 0.73 28.4 2 1740 55.23 0.123 8.7 11.8 20.2 0.28 0.67 41.9 3 1740 46.10 0.103 7.3 9.9 25.3 0.29 0.61 48.3 4 1740 36.10 0.080 5.6 7.7 29.6 0.27 0.54 50.2 5 1740 26.39 0.059 4.1 5.7 31.7 0.21 0.46 45.9 6 1740 16.25 0.036 2.5 3.5 33.3 0.14 0.38 35.8 7 1740 0.00 0.000 0.0 0.0 33.5 0.00 0.27 0.0
- 4. Minimum Percent Difference (not taking into account Q = 0 for ηth) Maximum Percent Difference Table 5: Percent Differences from the 1140 rpm Run Q (gpm) hp (expt) hp (manuf) % Diff. Ẇin (expt) Ẇin (manuf) % Diff. ηth (expt) ηth (manuf) % Diff. 38.2 7.66 10.8 29.0 0.27 NA NA 27.45 41 33.1 32.3 9.79 12.5 21.7 0.25 NA NA 31.78 43.7 27.3 26.3 11.41 13.8 17.3 0.22 NA NA 33.80 42.7 20.8 21.0 12.36 14.5 14.7 0.21 NA NA 30.74 40 23.2 15.2 12.94 14.8 12.6 0.18 NA NA 26.94 32 15.8 10.8 13.27 15 11.5 0.17 NA NA 20.75 35 40.7 0.00 13.26 15 11.6 0.14 NA NA 0.00 0.0 0.0 Table 6: Percent Differences from the 1740 rpm Run Q (gpm) hp (expt) hp (manuf) % Diff. Ẇin (expt) Ẇin (manuf) % Diff. ηth (expt) ηth (manuf) % Diff. 65.5 12.48 21 40.6 0.73 NA NA 28.35 43 34.1 55.2 20.20 26.5 23.8 0.67 0.75 10.5 41.98 49 14.3 46.1 25.30 30.5 17.1 0.61 NA NA 48.30 51.5 6.2 36.1 29.64 33.3 11.0 0.54 NA NA 50.24 50 -0.5* 26.4 31.75 34.5 8.0 0.46 0.5 7.8 45.93 45 -2.1* 16.3 33.28 35 4.9 0.38 NA NA 35.87 30 -19.6* 0.00 33.49 35 4.3 0.27 NA NA 0.00 0 0.0 *Negative numbers indicate the experimental efficiency is higher than the efficiency presented by the manufacturer.
- 5. 40 35 30 25 20 15 10 5 0 0 10 20 30 40 50 60 70 80 Pump Head, hp, (ft) Volumetric Flowrate, Q, (gpm) 1750 Pump Head (manuf) 1740 Pump Head (expt) 1150 Pump Head (manuf) 1140 Pump Head (expt) Figure 1: Pump Head Performance Chart Cal Poly Pomona Mechanical Engineering Department Thomas Gross Nov. 08, 2014 Figure 1: Bell & Gossett Model 1510 1.25AC 5.625in Diam. impeller Centrifugal Pump pump head vs flowrate when ran at 1140 &1740 rpm plotted against the manufactures given pump head when ran at 1150&1750 rpm.
- 6. 0.8 0.7 0.6 0.5 0.4 0.3 0.2 0.1 0 0 10 20 30 40 50 60 70 Power in, W, (hp) Flowrate, Q, (gpm) 1750 Power In (Manuf) 1740 Power In (expt) 1140 Power In (expt) Figure 2: Power In(bhp) Performance Chart Cal Poly Pomona Mechanical Engineering Department Thomas Gross Nov. 08, 2014 Figure 2: Bell & Gossett Model 1510 1.25AC 5.625in Diam. impeller Centrifugal Pump experimental brake horsepower at different flowrates when ran at 1140 &1740 rpm plotted against the manufactures given bhp when ran at 1150&1750 rpm.
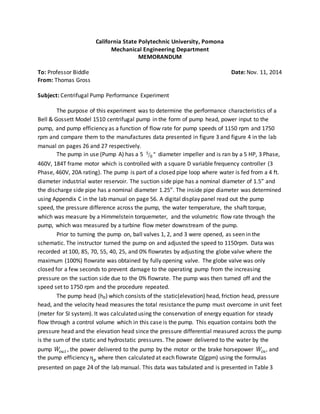
- 7. 60 50 40 30 20 10 0 0 10 20 30 40 50 60 70 80 Efficiency, nth, (%) Flowrate, Q, (gpm) 1750rpm Efficiency (manuf) 1740rpm Efficiency (expt) 1150rpm Efficiency (manuf) 1140rpm Efficiency (expt) Figure 3: Pump Efficiency vs Flowrate Curve Cal Poly Pomona Mechanical Engineering Department Thomas Gross Nov. 08, 2014 Figure 3: Bell & Gossett Model 1510 1.25AC 5.625in Diam. impeller Centrifugal Pump experimental efficency at 1140 &1740 rpm plotted against the manufactures given efficiency when ran at 1150&1750 rpm.
- 8. Schematic
- 9. Sample Calculations From ME313L Fluids Laboratory Manual: Appendix C Nominal Diam. (in) Inside Diam. (in) Outside Diam. (in) Discharge Side 1.25 1.380 1.660 Suction Side 1.50 1.610 1.900 From Fundamentals of Fluid Mechanics, 7th by Munson: Table B.1 Using linear interpolation to solve for γ at 62.9°F: 훾 = ( 푇 − 푇2) ( 훾2 − 훾1 푇2 − 푇1 ) + 훾1 = (62.9 − 60) ( 62.30 − 62.37 70 − 60 ) + 62.37 = 62.3497 푙푏/푓푡3 For Run Number 3 at 1140 rpm: Flow Rate ( 풇풕ퟑ 풔 ): 푄 [ 푓푡3 푠 ] = 푄[푔푝푚] 푥 [ 푓푡3 7.48 푔푎푙 1 푚푖푛 60 푠푒푐 ] 푥 [ ] = 26.3 푔푎푙 푚푖푛 푥 [ 푓푡3 7.48 푔푎푙 1 푚푖푛 60 푠푒푐 ] 푥 [ ] 푄 = 0.0586 푓푡3 푠 풇풕 풔 푽풔풖풄풕풊풐풏( ): 푉푠푢푐푡푖표푛 = 푄 퐴푠푢푐푡푖표푛 = 푄 휋 4 (퐼퐷)2 = 푓푡3 푠 0.0586 휋 4 (1.610 푖푛)2 [ 144푖푛2 푓푡2 ] = 4.15 푓푡 푠 풇풕 풔 푽풅풊풔풄풉풂풓품풆 ( ): 푉푑푖푠푐ℎ푎푟푔푒 = 푄 퐴푑푖푠ℎ푐푎푟푔푒 = 푄 휋 4 (퐼퐷)2 = 0.0586 푓푡3 푠 휋 4 144푖푛2 푓푡2 ] = 5.65 ( 1.380 푖푛)2 [ 푓푡 푠 Pump Head (풇풕): ℎ푝 = 훥푝 훾@62.9°퐹 + 2 − 푉푠푢푐푡푖표푛 푉푑푖푠푐ℎ푎푟푔푒 2 2푔 Where: 훥푝 = 4.84 Psi 푉푑푖푠푐ℎ푎푟푔푒 = 5.65 푓푡/푠 푉푠푢푐푡푖표푛 = 4.15 푓푡/푠 ℎ푝 = 144푖푛2 푓푡2 ] 4.84 [ lb 푖푛2 62.35 푙푏 푓푡3 + [ (5.65 푓푡 푠 2 − (4.15 ) 푓푡 푠 2 ] ) 2 푥 32.3 푓푡 푠2 ℎ푝 = 11.41 푓푡 Temp. °F γ (lb/ft3) 60 62.37 70 62.30
- 10. Power Delivered to Water by the Pump (풉풑): 푊̇ 표푢푡 = 훾@62.9°퐹푄ℎ푝 Where: 훾 = 62.35 푙푏/푓푡3 푄 = 0.0586 푓푡3 푠 ℎ푝 = 11.41 푓푡 푊̇ 표푢푡 = (62.35 푙푏 푓푡3) (0.0586 푓푡3 푠 ) (11.41 푓푡) = 41.66 푓푡 · 푙푏 푠 [ 1 ℎ푝 550 푓푡 · 푙푏 푠 ] 푊̇ 표푢푡 = 0.08 ℎ푝 Power Delivered to the Pump by The Motor (the Brake Horsepower): 푊̇ 푖푛 = 휔푇 Where: 휔 = 푁 [ 푟푒푣 푚푖푛 ] [ 2휋푟푎푑 푟푒푣 푚푖푛 60푠푒푐 ] [ ] = 1140 푟푒푣 푚푖푛 [ 2휋푟푎푑 푟푒푣 ] [ 푚푖푛 60푠푒푐 ] = 119.38 1 푠푒푐 T = 12.4 in · lb 푊̇ 푖푛 = (119.38 1 푠푒푐 )(12.4 in · lb) 푊̇ 푖푛 = 1480.318 푖푛 · 푙푏 푠 푓푡 12 푖푛 [ ][ 1 ℎ푝 550 푓푡 · 푙푏 푠 ] 푊̇ 푖푛 = 0.22 ℎ푝 Pump Efficiency(%): ηp = 푊̇표푢푡 푊̇푖푛 = 0.08 ℎ푝 0.22 ℎ푝 ηp = 33.5%
- 11. For Run Number 3 at 1740 rpm: Flow Rate ( 풇풕ퟑ 풔 ): 푄 [ 푓푡3 푠 ] = 푄[푔푝푚] 푥 [ 푓푡3 7.48 푔푎푙 1 푚푖푛 60 푠푒푐 ] 푥 [ ] = 46.10 푔푎푙 푚푖푛 푥 [ 푓푡3 7.48 푔푎푙 ] 푥 [ 1 푚푖푛 60 푠푒푐 ] 푄 = 0.103 푓푡3 푠 풇풕 풔 푽풔풖풄풕풊풐풏( ): 푉푠푢푐푡푖표푛 = 푄 퐴푠푢푐푡푖표푛 = 푄 휋 4 (퐼퐷)2 = 0.103 푓푡3 푠 휋 4 (1.610 푖푛)2 [ 144푖푛2 푓푡2 ] = 7.27 푓푡 푠 풇풕 풔 푽풅풊풔풄풉풂풓품풆 ( ): 푉푑푖푠푐ℎ푎푟푔푒 = 푄 퐴푑푖푠ℎ푐푎푟푔푒 = 푄 휋 4 (퐼퐷)2 = 0.103 푓푡3 푠 휋 4 144푖푛2 푓푡2 ] = 9.89 ( 1.380 푖푛)2 [ 푓푡 푠 Pump Head (풇풕): ℎ푝 = 훥푝 훾@62.9°퐹 + 2 − 푉푠푢푐푡푖표푛 푉푑푖푠푐ℎ푎푟푔푒 2 2푔 Where: 훥푝 = 10.65 Psi 푉푑푖푠푐ℎ푎푟푔푒 = 9.89 푓푡/푠 푉푠푢푐푡푖표푛 = 7.27 푓푡/푠 ℎ푝 = [ 144푖푛2 푓푡2 ]10.65 lb 푖푛2 62.35 푙푏 푓푡3 + [ (9.89 푓푡 푠 2 − (7.27 ) 푓푡 푠 ) 2 ] 2 푥 32.3 푓푡 푠2 ℎ푝 = 25.30 푓푡 Power Delivered to Water by the Pump (풉풑): 푊̇ 표푢푡 = 훾@62.9°퐹푄ℎ푝 Where: 훾 = 62.35 푙푏/푓푡3 푄 = 0.103 푓푡3 푠 ℎ푝 = 25.30 푓푡 푊̇ 표푢푡 = (62.35 푙푏 푓푡3) (0.103 푓푡3 푠 ) (25.30 푓푡) = 162.48 푓푡 · 푙푏 푠 [ 1 ℎ푝 550 푓푡 · 푙푏 푠 ] 푊̇ 표푢푡 = 0.29 ℎ푝
- 12. Power Delivered to the Pump by The Motor (the Brake Horsepower): 푊̇ 푖푛 = 휔푇 Where: 휔 = 푁 [ 푟푒푣 푚푖푛 ] [ 2휋푟푎푑 푟푒푣 푚푖푛 60푠푒푐 ] [ ] = 1740 푟푒푣 푚푖푛 [ 2휋푟푎푑 푟푒푣 ] [ 푚푖푛 60푠푒푐 ] = 182.21 1 푠푒푐 T = 22.10 in · lb 푊̇ 푖푛 = (182.21 1 푠푒푐 )(22.10 in · lb) 푊̇ 푖푛 = 4026.89 푖푛 · 푙푏 푠 푓푡 12 푖푛 [ ][ 1 ℎ푝 550 푓푡 · 푙푏 푠 ] 푊̇ 푖푛 = 0.61 ℎ푝 Pump Efficiency(%): ηp = 푊̇ 표푢푡 푊̇ 푖푛 = 0.29 ℎ푝 0.61 ℎ푝 ηp = 48.3%
- 13. CALIFORNIA STATE POLYTECHNIC UNIVERSITY, POMONA Mechanical Engineering Department CENTRIFUGAL PUMP PERFORMANCE DATA Test Personnel Thomas Gross Date Oct. 29, 2014 Test Location Fluids Lab, 17-1468 Ambient Conditions: Pressure Temperature Data Recorded by Thomas Gross Data Sheet Prepared by Thomas Gross TEST EQUIPMENT/INSTRUMENTAION USED: Description Variable Measured Inventory or Serial No. Calibration Due Date TEST DATA Table 1: Run No. Pump Speed, N (RPM) Shaft Torque, T (lb·in) Shaft Angular Speed, ω (RPM) Pressure Rise, △P (Psi) Flow Rate, Q (gpm) 1 1150 2 1150 3 1150 4 1150 5 1150 6 1150 7 1150 8 1150 Table 2: Run No. Pump Speed, N (RPM) Shaft Torque, T (lb·in) Shaft Angular Speed, ω (RPM) Pressure Rise, △P (Psi) Flow Rate, Q (gpm) 1 1740 2 1740 3 1740 4 1740 5 1740 6 1740 7 1740 8 1740
- 14. References Biddle, Dr. John R. “Experiment 3 – Centrifugal Pump Performance Experiment.” ME313L Fluids Laboratory, Bldg 17 Rm 1468: Mechanical Engineering Department, California State Polytechnic University, 2013-2014. 22-27, 52-53, 56. Print. Munson, Bruce R, et al. Fundamentals of fluid mechanics 7th Edition. John Wiley & Sons, Inc.: United States of America, 2013. Print