SlideShare uma empresa Scribd logo
1 de 31
Diving Into the Hudson  Without Getting Wet Steve Stanne, Hudson River Estuary Program Jean Valla McAvoy, Hudson River Research Reserve
Remote sensing Taking the river’s vital signs from a distance 1. Up to the minute information on specific parameters water temperature at Norrie Point July 24-27, 2011
Remote sensing Taking the river’s vital signs from a distance 2. Observe patterns/cycles High and low tides at the George Washington Bridge; July 28 - 30, 2009
Remote sensing Taking the river’s vital signs from a distance 3. Show relationships between parameters or cycles Tides vs salinity at George Washington Bridge; July 28 - 30, 2009
Remote sensing Taking the river’s vital signs from a distance 4. Collects data during short-term events or in inclement conditions when scientists may not be able to collect samples  Turbidity (muddiness) of the water at Schodack Island following heavy rains in early July, 2009
Remote sensing Taking the river’s vital signs from a distance 5. Create line graphs with website interfaces or download data to further customize graphs
www.youtube.com/watch?v=z5aG5f-Rlaw   Click to view video about HRECOS system HRECOS  Hudson River Environmental Conditions Observing System
HRECOS  Hudson River Environmental Conditions Observing System
Click here to go to HRECOS home page  www.hrecos.org   The site offers resources including lesson plans, stories about phenomena that can visualized using HRECOS graphs, and forecasts of river conditions.  Click on Current Conditions to access data from remote sensors in  the river.
HRECOS  Current Conditions page Use dropdown menus to choose station, parameter, etc. Choose Units and whether to plot Continous readings or Daily averages. Use Start Date/End Date or Set Start/Set End to choose time periods (within limits - click on ? for more details). Plot one parameter or compare two in one graph.
For younger students just starting to learn about graphs, choose parameters that illustrate well-known phenomena:  Water temperature rising and falling over a 24 hour period from the cool of early  morning to the heat of mid-afternoon to the cool of evening. Water temperature rising and falling over several days. Why did temperatures not go as high on 7/18? Link to sunlight (listed as total radiation in the list of meteorological parameters). It was cloudy on 7/18.
Water temperature rising and falling over the seasons through 2010-2011 school year (note that plot uses daily averages, not continuous readings). On a sunny day, have students observe water temperature graph early in the school day and predict what it will look like later in the day.
Look for this 24 hour pattern of  DO levels due to photosynthesis in daylight hours and respiration at night. Use dates in the growing season from mid-May to late September.  With older students, exploring dissolved oxygen [DO] concentrations offers interesting windows on photosynthesis and river ecology.  Though plants die back in winter, DO levels rise then as water cools (cold water holds more DO than warm water) and winds grow stronger. Plot shows daily DO averages.
In the upper estuary (north of the Highlands) DO levels in the growing season reflect photosynthesis by rooted submerged aquatic vegetation [SAV]. Note impacts of cloudiness on 7/18/11.  In the lower estuary (south of the Highlands) DO levels are more likely to reflect photosynthesis by phytoplankton. There are occasional spikes in DO when phytoplankton blooms occur.
If you want to change the format of the graphs or have students draw graphs by hand, then use the Download button to download data displayed on a graph (single parameter graphs only) into an Excel  data table.  Note: If students will plot their own graphs by hand, then choose Daily Average readings, as was done here for a DO peak due to a plankton bloom at the George Washington Bridge. Continuous data is overwhelming; four 15 minute data points every hour X 24 hours in a day equals 96 numbers!
Simplify downloaded data as desired.  Now have students plot their own graphs by hand … Delete column B decimals, for example.  or select columns A & B, then choose Insert Column ...  to display this graph.
Earth science students can study tidal cycles.  A pattern of two high and two low tides each day is typical of the Hudson estuary, as seen here for Norrie Point.  Tides travel all the way to Albany; the surface of the river is at sea level even there.  How do tide events at Albany differ from the same tide events at Norrie? A given tide event happens later in Albany than at Norrie, and is more extreme (highs are higher, lows lower). Set up math problems with the graphs. How much higher is the first high tide of 7/31 when it reaches Albany than it was at Norrie? How much later is this event in Albany? What was the velocity of the tidal wave between Norrie and Albany?
http://ny.water.usgs.gov/projects/dialer_plots/saltfront.html   Click this URL to visit the actual U.S. Geological Survey salt front website Another good source of salinity, temperature, and tide data; also has links to stream level gauges on Hudson River tributaries.
Map and table show salt front location
NOAA: remotely sensed data from other estuaries  http://estuaries.gov/ScienceData/Home.aspx   Click this URL to visit the actual NOAA data website
HRECOS  Hudson River Environmental Conditions Observing System Use the graphs to tell stories, pose questions, solve mysteries. Create hypotheses and find evidence to support them. Here are some examples. ,[object Object],[object Object],The propellers of ships and powerful tugs churn up mud, causing sudden peaks in turbidity at Schodack Island.
[object Object],[object Object],[object Object],Plotting a graph of rainfall (in mm) shows that runoff could have caused elevated water levels. Flooding occurred in the Adirondacks at this time.  The high and low tide cycle is superimposed on the higher base level.
[object Object],[object Object],[object Object],The surface of the Hudson is at sea level virtually all the way to Troy. River level is controlled by sea level. Flooding due to runoff is rare below Catskill (Hudson River Mile 112). The 4/29-4/30 peak, lower at Schodack, was not evident at all at Norrie.
[object Object],[object Object],[object Object],Water chestnut photosynthesis puts oxygen into the air; shading by chesnut prevents photosynthesis in the water below. DO rises as rising tides flood the bay with water from the open river; it falls as respiration depletes oxygen and the tide goes down .
[object Object],[object Object],[object Object],Since river level at Norrie is controlled by sea level, surges in water level caused by coastal storms impact the Hudson. The wind direction/speed vector plot for Castle Point, NJ (the HRECOS site closest to the ocean) shows strong winds from the southeast due to a coastal storm passing on 12/01/10. (The arrows show wind direction as though the graph area were a compass dial; their vertical position indicates speed.) The peak in water level at Norrie was caused by storm surge.
[object Object],[object Object],[object Object],In this case, the wind direction/speed vector plot for Castle Point shows sustained strong northerly winds 12/26/10 – 12/27/10. These winds literally pushed ocean waters away from the coast, causing “blowout tides” there and along the Hudson .
[object Object],[object Object],[object Object]
Hint : Can you think of a cycle affecting the river in which a seven day interval plays a role? The cycle of spring  tides (greatest tidal range-higher highs/lower lows) and neap tides (least tidal range-lower highs/higher lows) is tied to the moon’s phases and relative positions of moon, sun, and earth over a 28 (7 X 4) day period.  The graph is fairly “noisy,” but it shows the approximate times of spring tides (indicated by this arrow  ) and neap tides (indicated by this arrow  ).
This graph plots salinity against the lunar tidal cycle. At what points in the cycle is salinity  highest ?  This graph plots temperature against the lunar tidal cycle. When in the cycle is temperature  lowest ? Salinity peaks at times of spring tides. Temperature is lowest at times of spring tides.
Tidal currents are strongest during spring tides. They mix the layers, making water near the surface saltier and cooler. During neap tides, stratification is more pronounced, so water near the surface is fresher and warmer. Graphic copyright www.chemgapedia.de The last piece of the puzzle involves currents and their effect on stratification - layering  of water masses – in the estuary.  The lower Hudson is a partially mixed estuary. Denser, saltier (and colder) water layers underneath fresher (and warmer) water at the surface.
For more information, contact Steve Stanne, Education Coordinator NYSDEC – Hudson River Estuary Program in cooperation with the NYS Water Resources Institute at  Cornell University 21 South Putt Corners Road New Paltz, NY 12561 845 256-3077 [email_address] Jean McAvoy, Education Coordinator NYSDEC - Hudson River Research Reserve in cooperation with the New England Interstate Water Pollution Control Commission Norrie Point Environmental Center PO Box 315 Staatsburg, NY  12580 845-889-4745 x 105 [email_address]

Mais conteúdo relacionado

Mais procurados

OBSERVING OCEAN SURFACE WIND AND STRESS BY SCATTEROMETER CONSTELLATION
OBSERVING OCEAN SURFACE WIND AND STRESS BY SCATTEROMETER CONSTELLATIONOBSERVING OCEAN SURFACE WIND AND STRESS BY SCATTEROMETER CONSTELLATION
OBSERVING OCEAN SURFACE WIND AND STRESS BY SCATTEROMETER CONSTELLATION
grssieee
 
Hydrology and water management(EVAPORATION & INFILTRATION)...
Hydrology and water management(EVAPORATION & INFILTRATION)...Hydrology and water management(EVAPORATION & INFILTRATION)...
Hydrology and water management(EVAPORATION & INFILTRATION)...
Nasir Uddin
 

Mais procurados (20)

L7 hydrograph
L7 hydrographL7 hydrograph
L7 hydrograph
 
Hydrology Chapter 1
Hydrology Chapter 1Hydrology Chapter 1
Hydrology Chapter 1
 
Poster for BIOS
Poster for BIOSPoster for BIOS
Poster for BIOS
 
OBSERVING OCEAN SURFACE WIND AND STRESS BY SCATTEROMETER CONSTELLATION
OBSERVING OCEAN SURFACE WIND AND STRESS BY SCATTEROMETER CONSTELLATIONOBSERVING OCEAN SURFACE WIND AND STRESS BY SCATTEROMETER CONSTELLATION
OBSERVING OCEAN SURFACE WIND AND STRESS BY SCATTEROMETER CONSTELLATION
 
Hydrology introduction ( catchment area)
Hydrology introduction ( catchment area)Hydrology introduction ( catchment area)
Hydrology introduction ( catchment area)
 
Ch3 hydrological losses
Ch3 hydrological lossesCh3 hydrological losses
Ch3 hydrological losses
 
CE-235 EH Lec 1
CE-235 EH Lec 1CE-235 EH Lec 1
CE-235 EH Lec 1
 
Hyetograph and hydrograph analysis
Hyetograph and hydrograph analysisHyetograph and hydrograph analysis
Hyetograph and hydrograph analysis
 
Assessing Sensitivity to Drought and Climate Change with an Integrated Surfac...
Assessing Sensitivity to Drought and Climate Change with an Integrated Surfac...Assessing Sensitivity to Drought and Climate Change with an Integrated Surfac...
Assessing Sensitivity to Drought and Climate Change with an Integrated Surfac...
 
Hydrology seminar ppt
Hydrology seminar pptHydrology seminar ppt
Hydrology seminar ppt
 
Assessing Cumulative Effects with Integrated Modelling
Assessing Cumulative Effects with Integrated ModellingAssessing Cumulative Effects with Integrated Modelling
Assessing Cumulative Effects with Integrated Modelling
 
Research plan- The Impact of Land-Use in Lowland and Coastal Area on The Grou...
Research plan- The Impact of Land-Use in Lowland and Coastal Area on The Grou...Research plan- The Impact of Land-Use in Lowland and Coastal Area on The Grou...
Research plan- The Impact of Land-Use in Lowland and Coastal Area on The Grou...
 
SterliniEtAl2015
SterliniEtAl2015SterliniEtAl2015
SterliniEtAl2015
 
Arsaln abid
Arsaln abidArsaln abid
Arsaln abid
 
Module 1 introduction
Module 1 introductionModule 1 introduction
Module 1 introduction
 
(3) irrigation hydrology
(3) irrigation hydrology(3) irrigation hydrology
(3) irrigation hydrology
 
Engineering Hydrology
Engineering HydrologyEngineering Hydrology
Engineering Hydrology
 
Baseflow
BaseflowBaseflow
Baseflow
 
Hydrology
HydrologyHydrology
Hydrology
 
Hydrology and water management(EVAPORATION & INFILTRATION)...
Hydrology and water management(EVAPORATION & INFILTRATION)...Hydrology and water management(EVAPORATION & INFILTRATION)...
Hydrology and water management(EVAPORATION & INFILTRATION)...
 

Destaque

Destaque (20)

Finding Free Primary Sources Online and Using them in Your Classroom
Finding Free Primary Sources Online and Using them in Your ClassroomFinding Free Primary Sources Online and Using them in Your Classroom
Finding Free Primary Sources Online and Using them in Your Classroom
 
Karla Purcell: JFK Magnet School Garden, Port Chester, NY
Karla Purcell: JFK Magnet School Garden, Port Chester, NYKarla Purcell: JFK Magnet School Garden, Port Chester, NY
Karla Purcell: JFK Magnet School Garden, Port Chester, NY
 
Materials Management, Terry Laibach, NYS Dept. of Environmental Conservation
Materials Management, Terry Laibach, NYS Dept. of Environmental ConservationMaterials Management, Terry Laibach, NYS Dept. of Environmental Conservation
Materials Management, Terry Laibach, NYS Dept. of Environmental Conservation
 
Investigating Sea level rise in the Hudson Valley
Investigating Sea level rise in the Hudson ValleyInvestigating Sea level rise in the Hudson Valley
Investigating Sea level rise in the Hudson Valley
 
The Hudson River--Journey into Inquiry, by Jill Leinung and Linda Kaminski
The Hudson River--Journey into Inquiry, by Jill Leinung and Linda KaminskiThe Hudson River--Journey into Inquiry, by Jill Leinung and Linda Kaminski
The Hudson River--Journey into Inquiry, by Jill Leinung and Linda Kaminski
 
[THVInstitute13] Uncommon Approaches to the Common Core
[THVInstitute13] Uncommon Approaches to the Common Core[THVInstitute13] Uncommon Approaches to the Common Core
[THVInstitute13] Uncommon Approaches to the Common Core
 
Using Media Arts to Build Literacy Skills, with Children's Media Project
Using Media Arts to Build Literacy Skills, with Children's Media ProjectUsing Media Arts to Build Literacy Skills, with Children's Media Project
Using Media Arts to Build Literacy Skills, with Children's Media Project
 
Teachers and Site Staff - Ideas for Collaborating
Teachers and Site Staff - Ideas for CollaboratingTeachers and Site Staff - Ideas for Collaborating
Teachers and Site Staff - Ideas for Collaborating
 
Frederic Church's Olana
Frederic Church's OlanaFrederic Church's Olana
Frederic Church's Olana
 
[THVInstitute13] Social Studies Tool Kit for Dutchess County Educators
[THVInstitute13] Social Studies Tool Kit for Dutchess County Educators[THVInstitute13] Social Studies Tool Kit for Dutchess County Educators
[THVInstitute13] Social Studies Tool Kit for Dutchess County Educators
 
Sea Level Rise in the Hudson Valley
Sea Level Rise in the Hudson Valley Sea Level Rise in the Hudson Valley
Sea Level Rise in the Hudson Valley
 
What Can We Do
What Can We Do What Can We Do
What Can We Do
 
The Hudson during & after extreme weather events. What do they tell us about ...
The Hudson during & after extreme weather events. What do they tell us about ...The Hudson during & after extreme weather events. What do they tell us about ...
The Hudson during & after extreme weather events. What do they tell us about ...
 
Common Core lesson planning
Common Core lesson planningCommon Core lesson planning
Common Core lesson planning
 
How and why the Hudson Valley's climate is changing
How and why the Hudson Valley's climate is changingHow and why the Hudson Valley's climate is changing
How and why the Hudson Valley's climate is changing
 
Web quest: Sea level rise in the Hudson Valley
Web quest: Sea level rise in the Hudson ValleyWeb quest: Sea level rise in the Hudson Valley
Web quest: Sea level rise in the Hudson Valley
 
Storm King: Cornerstone of the Environmental Movement
Storm King: Cornerstone of the Environmental MovementStorm King: Cornerstone of the Environmental Movement
Storm King: Cornerstone of the Environmental Movement
 
These maps are for the birds
These maps are for the birdsThese maps are for the birds
These maps are for the birds
 
Bénéfices des blogs dans votre communication sur les médias sociaux
Bénéfices des blogs dans votre communication sur les médias sociauxBénéfices des blogs dans votre communication sur les médias sociaux
Bénéfices des blogs dans votre communication sur les médias sociaux
 
A12 reporters de territoires - #et9
A12 reporters de territoires - #et9A12 reporters de territoires - #et9
A12 reporters de territoires - #et9
 

Semelhante a Diving into the Hudson Without Getting Wet

Observed Climate–Snowpack Relationships in California and thei.docx
Observed Climate–Snowpack Relationships in California and thei.docxObserved Climate–Snowpack Relationships in California and thei.docx
Observed Climate–Snowpack Relationships in California and thei.docx
cherishwinsland
 
UCLA THESIS_Vrsalovich_condensed
UCLA THESIS_Vrsalovich_condensedUCLA THESIS_Vrsalovich_condensed
UCLA THESIS_Vrsalovich_condensed
John Vrsalovich
 
Abruptclimatechange 7229
Abruptclimatechange 7229Abruptclimatechange 7229
Abruptclimatechange 7229
www.thiiink.com
 
Sea level rise and storm surge tools and datasets supporting Municipal Resili...
Sea level rise and storm surge tools and datasets supporting Municipal Resili...Sea level rise and storm surge tools and datasets supporting Municipal Resili...
Sea level rise and storm surge tools and datasets supporting Municipal Resili...
GrowSmart Maine
 
36002 Topic SCI 207 Our Dependence upon the EnvironmentNumber.docx
36002 Topic SCI 207 Our Dependence upon the EnvironmentNumber.docx36002 Topic SCI 207 Our Dependence upon the EnvironmentNumber.docx
36002 Topic SCI 207 Our Dependence upon the EnvironmentNumber.docx
rhetttrevannion
 

Semelhante a Diving into the Hudson Without Getting Wet (20)

EOPS_2018_11_06.pdf
EOPS_2018_11_06.pdfEOPS_2018_11_06.pdf
EOPS_2018_11_06.pdf
 
EOPS_2018_09_17.pdf
EOPS_2018_09_17.pdfEOPS_2018_09_17.pdf
EOPS_2018_09_17.pdf
 
Eops 2016 03_16
Eops 2016 03_16Eops 2016 03_16
Eops 2016 03_16
 
Eops 2017 8_28
Eops 2017 8_28Eops 2017 8_28
Eops 2017 8_28
 
EOPS_2018_05_22.pdf
EOPS_2018_05_22.pdfEOPS_2018_05_22.pdf
EOPS_2018_05_22.pdf
 
EOPS_2020_03_16.pdf
EOPS_2020_03_16.pdfEOPS_2020_03_16.pdf
EOPS_2020_03_16.pdf
 
Eops 2016 02_08
Eops 2016 02_08Eops 2016 02_08
Eops 2016 02_08
 
Pristov - 2016
Pristov - 2016Pristov - 2016
Pristov - 2016
 
Eops 2016 04_06
Eops 2016 04_06Eops 2016 04_06
Eops 2016 04_06
 
Observed Climate–Snowpack Relationships in California and thei.docx
Observed Climate–Snowpack Relationships in California and thei.docxObserved Climate–Snowpack Relationships in California and thei.docx
Observed Climate–Snowpack Relationships in California and thei.docx
 
UCLA THESIS_Vrsalovich_condensed
UCLA THESIS_Vrsalovich_condensedUCLA THESIS_Vrsalovich_condensed
UCLA THESIS_Vrsalovich_condensed
 
EOPS_2019_02_21.pdf
EOPS_2019_02_21.pdfEOPS_2019_02_21.pdf
EOPS_2019_02_21.pdf
 
Abruptclimatechange 7229
Abruptclimatechange 7229Abruptclimatechange 7229
Abruptclimatechange 7229
 
Abruptclimatechange 7229
Abruptclimatechange 7229Abruptclimatechange 7229
Abruptclimatechange 7229
 
Eops 2014 03_24
Eops 2014 03_24Eops 2014 03_24
Eops 2014 03_24
 
Eops 2016 07_20
Eops 2016 07_20Eops 2016 07_20
Eops 2016 07_20
 
EOPS_2021_03_11.pdf
EOPS_2021_03_11.pdfEOPS_2021_03_11.pdf
EOPS_2021_03_11.pdf
 
Sea level rise and storm surge tools and datasets supporting Municipal Resili...
Sea level rise and storm surge tools and datasets supporting Municipal Resili...Sea level rise and storm surge tools and datasets supporting Municipal Resili...
Sea level rise and storm surge tools and datasets supporting Municipal Resili...
 
EOPS_2018_06_28.pdf
EOPS_2018_06_28.pdfEOPS_2018_06_28.pdf
EOPS_2018_06_28.pdf
 
36002 Topic SCI 207 Our Dependence upon the EnvironmentNumber.docx
36002 Topic SCI 207 Our Dependence upon the EnvironmentNumber.docx36002 Topic SCI 207 Our Dependence upon the EnvironmentNumber.docx
36002 Topic SCI 207 Our Dependence upon the EnvironmentNumber.docx
 

Mais de Teaching the Hudson Valley

[THVInstitute13] Cadmium at Foundry Cove: An Ecology & Evolution Story
[THVInstitute13] Cadmium at Foundry Cove: An Ecology & Evolution Story[THVInstitute13] Cadmium at Foundry Cove: An Ecology & Evolution Story
[THVInstitute13] Cadmium at Foundry Cove: An Ecology & Evolution Story
Teaching the Hudson Valley
 
[THVInstitute13] Visual Thinking Strategies & the Common Core State Standards
[THVInstitute13] Visual Thinking Strategies & the Common Core State Standards[THVInstitute13] Visual Thinking Strategies & the Common Core State Standards
[THVInstitute13] Visual Thinking Strategies & the Common Core State Standards
Teaching the Hudson Valley
 

Mais de Teaching the Hudson Valley (20)

Climate change true false
Climate change true falseClimate change true false
Climate change true false
 
Rubric for letter to an elected official
Rubric for letter to an elected officialRubric for letter to an elected official
Rubric for letter to an elected official
 
Sea level rise in the Hudson Valley
Sea level rise in the Hudson ValleySea level rise in the Hudson Valley
Sea level rise in the Hudson Valley
 
What can we do?
What can we do?What can we do?
What can we do?
 
Sea level rise science
Sea level rise scienceSea level rise science
Sea level rise science
 
How communities are taking action on climate change
How communities are taking action on climate changeHow communities are taking action on climate change
How communities are taking action on climate change
 
Helping Youth Eat Real: Classroom Lessons to Transform Youth & their Communities
Helping Youth Eat Real: Classroom Lessons to Transform Youth & their CommunitiesHelping Youth Eat Real: Classroom Lessons to Transform Youth & their Communities
Helping Youth Eat Real: Classroom Lessons to Transform Youth & their Communities
 
Recycling and Composting, Ann Jaffe-Holmes, Greenburgh Nature Center
Recycling and Composting, Ann Jaffe-Holmes, Greenburgh Nature CenterRecycling and Composting, Ann Jaffe-Holmes, Greenburgh Nature Center
Recycling and Composting, Ann Jaffe-Holmes, Greenburgh Nature Center
 
Nutrition Education DESIGN Procedure: Pam Koch, Tisch Center for Food, Educa...
Nutrition Education DESIGN Procedure: Pam Koch, Tisch Center for Food, Educa...Nutrition Education DESIGN Procedure: Pam Koch, Tisch Center for Food, Educa...
Nutrition Education DESIGN Procedure: Pam Koch, Tisch Center for Food, Educa...
 
Conventional vs organic agriculture: Cornelia Harris, Cary Institute of Ecosy...
Conventional vs organic agriculture: Cornelia Harris, Cary Institute of Ecosy...Conventional vs organic agriculture: Cornelia Harris, Cary Institute of Ecosy...
Conventional vs organic agriculture: Cornelia Harris, Cary Institute of Ecosy...
 
Why Garden at School? Cornelia Harris, Cary Institute of Ecosystem Studies
Why Garden at School? Cornelia Harris, Cary Institute of Ecosystem StudiesWhy Garden at School? Cornelia Harris, Cary Institute of Ecosystem Studies
Why Garden at School? Cornelia Harris, Cary Institute of Ecosystem Studies
 
Cathy Law: Courtyard Gardens at New Paltz HS
Cathy Law: Courtyard Gardens at New Paltz HSCathy Law: Courtyard Gardens at New Paltz HS
Cathy Law: Courtyard Gardens at New Paltz HS
 
Natural Inclinations: Illustrating Food and Farms with Gina Palmer
Natural Inclinations: Illustrating Food and Farms with Gina PalmerNatural Inclinations: Illustrating Food and Farms with Gina Palmer
Natural Inclinations: Illustrating Food and Farms with Gina Palmer
 
[THVInstitute13] Sea captain, soldier and slave
[THVInstitute13] Sea captain, soldier and slave[THVInstitute13] Sea captain, soldier and slave
[THVInstitute13] Sea captain, soldier and slave
 
[THVInstitute13] Cadmium at Foundry Cove: An Ecology & Evolution Story
[THVInstitute13] Cadmium at Foundry Cove: An Ecology & Evolution Story[THVInstitute13] Cadmium at Foundry Cove: An Ecology & Evolution Story
[THVInstitute13] Cadmium at Foundry Cove: An Ecology & Evolution Story
 
[THVInstitute13] A Question of Interest: Knox's Headquarters field experience
[THVInstitute13] A Question of Interest: Knox's Headquarters field experience[THVInstitute13] A Question of Interest: Knox's Headquarters field experience
[THVInstitute13] A Question of Interest: Knox's Headquarters field experience
 
[THVInstitute13] Visual Thinking Strategies & the Common Core State Standards
[THVInstitute13] Visual Thinking Strategies & the Common Core State Standards[THVInstitute13] Visual Thinking Strategies & the Common Core State Standards
[THVInstitute13] Visual Thinking Strategies & the Common Core State Standards
 
[THVInstitute13] Shifting Perspectives: Making History Relevant and Relatable...
[THVInstitute13] Shifting Perspectives: Making History Relevant and Relatable...[THVInstitute13] Shifting Perspectives: Making History Relevant and Relatable...
[THVInstitute13] Shifting Perspectives: Making History Relevant and Relatable...
 
[THVInstitute13] Resource Page for Promoting Historical Thinking with Place-B...
[THVInstitute13] Resource Page for Promoting Historical Thinking with Place-B...[THVInstitute13] Resource Page for Promoting Historical Thinking with Place-B...
[THVInstitute13] Resource Page for Promoting Historical Thinking with Place-B...
 
[THVInstitute13] Visual Thinking Strategies and the Common Core State Standards
[THVInstitute13] Visual Thinking Strategies and the Common Core State Standards[THVInstitute13] Visual Thinking Strategies and the Common Core State Standards
[THVInstitute13] Visual Thinking Strategies and the Common Core State Standards
 

Último

Salient Features of India constitution especially power and functions
Salient Features of India constitution especially power and functionsSalient Features of India constitution especially power and functions
Salient Features of India constitution especially power and functions
KarakKing
 
Spellings Wk 3 English CAPS CARES Please Practise
Spellings Wk 3 English CAPS CARES Please PractiseSpellings Wk 3 English CAPS CARES Please Practise
Spellings Wk 3 English CAPS CARES Please Practise
AnaAcapella
 
Vishram Singh - Textbook of Anatomy Upper Limb and Thorax.. Volume 1 (1).pdf
Vishram Singh - Textbook of Anatomy  Upper Limb and Thorax.. Volume 1 (1).pdfVishram Singh - Textbook of Anatomy  Upper Limb and Thorax.. Volume 1 (1).pdf
Vishram Singh - Textbook of Anatomy Upper Limb and Thorax.. Volume 1 (1).pdf
ssuserdda66b
 

Último (20)

2024-NATIONAL-LEARNING-CAMP-AND-OTHER.pptx
2024-NATIONAL-LEARNING-CAMP-AND-OTHER.pptx2024-NATIONAL-LEARNING-CAMP-AND-OTHER.pptx
2024-NATIONAL-LEARNING-CAMP-AND-OTHER.pptx
 
Basic Civil Engineering first year Notes- Chapter 4 Building.pptx
Basic Civil Engineering first year Notes- Chapter 4 Building.pptxBasic Civil Engineering first year Notes- Chapter 4 Building.pptx
Basic Civil Engineering first year Notes- Chapter 4 Building.pptx
 
Food safety_Challenges food safety laboratories_.pdf
Food safety_Challenges food safety laboratories_.pdfFood safety_Challenges food safety laboratories_.pdf
Food safety_Challenges food safety laboratories_.pdf
 
How to Manage Global Discount in Odoo 17 POS
How to Manage Global Discount in Odoo 17 POSHow to Manage Global Discount in Odoo 17 POS
How to Manage Global Discount in Odoo 17 POS
 
How to Give a Domain for a Field in Odoo 17
How to Give a Domain for a Field in Odoo 17How to Give a Domain for a Field in Odoo 17
How to Give a Domain for a Field in Odoo 17
 
Google Gemini An AI Revolution in Education.pptx
Google Gemini An AI Revolution in Education.pptxGoogle Gemini An AI Revolution in Education.pptx
Google Gemini An AI Revolution in Education.pptx
 
ComPTIA Overview | Comptia Security+ Book SY0-701
ComPTIA Overview | Comptia Security+ Book SY0-701ComPTIA Overview | Comptia Security+ Book SY0-701
ComPTIA Overview | Comptia Security+ Book SY0-701
 
Kodo Millet PPT made by Ghanshyam bairwa college of Agriculture kumher bhara...
Kodo Millet  PPT made by Ghanshyam bairwa college of Agriculture kumher bhara...Kodo Millet  PPT made by Ghanshyam bairwa college of Agriculture kumher bhara...
Kodo Millet PPT made by Ghanshyam bairwa college of Agriculture kumher bhara...
 
Dyslexia AI Workshop for Slideshare.pptx
Dyslexia AI Workshop for Slideshare.pptxDyslexia AI Workshop for Slideshare.pptx
Dyslexia AI Workshop for Slideshare.pptx
 
Application orientated numerical on hev.ppt
Application orientated numerical on hev.pptApplication orientated numerical on hev.ppt
Application orientated numerical on hev.ppt
 
Sociology 101 Demonstration of Learning Exhibit
Sociology 101 Demonstration of Learning ExhibitSociology 101 Demonstration of Learning Exhibit
Sociology 101 Demonstration of Learning Exhibit
 
Salient Features of India constitution especially power and functions
Salient Features of India constitution especially power and functionsSalient Features of India constitution especially power and functions
Salient Features of India constitution especially power and functions
 
Spellings Wk 3 English CAPS CARES Please Practise
Spellings Wk 3 English CAPS CARES Please PractiseSpellings Wk 3 English CAPS CARES Please Practise
Spellings Wk 3 English CAPS CARES Please Practise
 
Understanding Accommodations and Modifications
Understanding  Accommodations and ModificationsUnderstanding  Accommodations and Modifications
Understanding Accommodations and Modifications
 
Explore beautiful and ugly buildings. Mathematics helps us create beautiful d...
Explore beautiful and ugly buildings. Mathematics helps us create beautiful d...Explore beautiful and ugly buildings. Mathematics helps us create beautiful d...
Explore beautiful and ugly buildings. Mathematics helps us create beautiful d...
 
On National Teacher Day, meet the 2024-25 Kenan Fellows
On National Teacher Day, meet the 2024-25 Kenan FellowsOn National Teacher Day, meet the 2024-25 Kenan Fellows
On National Teacher Day, meet the 2024-25 Kenan Fellows
 
Spatium Project Simulation student brief
Spatium Project Simulation student briefSpatium Project Simulation student brief
Spatium Project Simulation student brief
 
General Principles of Intellectual Property: Concepts of Intellectual Proper...
General Principles of Intellectual Property: Concepts of Intellectual  Proper...General Principles of Intellectual Property: Concepts of Intellectual  Proper...
General Principles of Intellectual Property: Concepts of Intellectual Proper...
 
Unit-V; Pricing (Pharma Marketing Management).pptx
Unit-V; Pricing (Pharma Marketing Management).pptxUnit-V; Pricing (Pharma Marketing Management).pptx
Unit-V; Pricing (Pharma Marketing Management).pptx
 
Vishram Singh - Textbook of Anatomy Upper Limb and Thorax.. Volume 1 (1).pdf
Vishram Singh - Textbook of Anatomy  Upper Limb and Thorax.. Volume 1 (1).pdfVishram Singh - Textbook of Anatomy  Upper Limb and Thorax.. Volume 1 (1).pdf
Vishram Singh - Textbook of Anatomy Upper Limb and Thorax.. Volume 1 (1).pdf
 

Diving into the Hudson Without Getting Wet

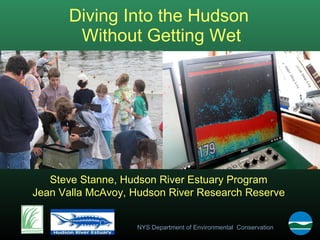
  • 1. Diving Into the Hudson Without Getting Wet Steve Stanne, Hudson River Estuary Program Jean Valla McAvoy, Hudson River Research Reserve
  • 2. Remote sensing Taking the river’s vital signs from a distance 1. Up to the minute information on specific parameters water temperature at Norrie Point July 24-27, 2011
  • 3. Remote sensing Taking the river’s vital signs from a distance 2. Observe patterns/cycles High and low tides at the George Washington Bridge; July 28 - 30, 2009
  • 4. Remote sensing Taking the river’s vital signs from a distance 3. Show relationships between parameters or cycles Tides vs salinity at George Washington Bridge; July 28 - 30, 2009
  • 5. Remote sensing Taking the river’s vital signs from a distance 4. Collects data during short-term events or in inclement conditions when scientists may not be able to collect samples Turbidity (muddiness) of the water at Schodack Island following heavy rains in early July, 2009
  • 6. Remote sensing Taking the river’s vital signs from a distance 5. Create line graphs with website interfaces or download data to further customize graphs
  • 7. www.youtube.com/watch?v=z5aG5f-Rlaw Click to view video about HRECOS system HRECOS Hudson River Environmental Conditions Observing System
  • 8. HRECOS Hudson River Environmental Conditions Observing System
  • 9. Click here to go to HRECOS home page www.hrecos.org The site offers resources including lesson plans, stories about phenomena that can visualized using HRECOS graphs, and forecasts of river conditions. Click on Current Conditions to access data from remote sensors in the river.
  • 10. HRECOS Current Conditions page Use dropdown menus to choose station, parameter, etc. Choose Units and whether to plot Continous readings or Daily averages. Use Start Date/End Date or Set Start/Set End to choose time periods (within limits - click on ? for more details). Plot one parameter or compare two in one graph.
  • 11. For younger students just starting to learn about graphs, choose parameters that illustrate well-known phenomena: Water temperature rising and falling over a 24 hour period from the cool of early morning to the heat of mid-afternoon to the cool of evening. Water temperature rising and falling over several days. Why did temperatures not go as high on 7/18? Link to sunlight (listed as total radiation in the list of meteorological parameters). It was cloudy on 7/18.
  • 12. Water temperature rising and falling over the seasons through 2010-2011 school year (note that plot uses daily averages, not continuous readings). On a sunny day, have students observe water temperature graph early in the school day and predict what it will look like later in the day.
  • 13. Look for this 24 hour pattern of DO levels due to photosynthesis in daylight hours and respiration at night. Use dates in the growing season from mid-May to late September. With older students, exploring dissolved oxygen [DO] concentrations offers interesting windows on photosynthesis and river ecology. Though plants die back in winter, DO levels rise then as water cools (cold water holds more DO than warm water) and winds grow stronger. Plot shows daily DO averages.
  • 14. In the upper estuary (north of the Highlands) DO levels in the growing season reflect photosynthesis by rooted submerged aquatic vegetation [SAV]. Note impacts of cloudiness on 7/18/11. In the lower estuary (south of the Highlands) DO levels are more likely to reflect photosynthesis by phytoplankton. There are occasional spikes in DO when phytoplankton blooms occur.
  • 15. If you want to change the format of the graphs or have students draw graphs by hand, then use the Download button to download data displayed on a graph (single parameter graphs only) into an Excel data table. Note: If students will plot their own graphs by hand, then choose Daily Average readings, as was done here for a DO peak due to a plankton bloom at the George Washington Bridge. Continuous data is overwhelming; four 15 minute data points every hour X 24 hours in a day equals 96 numbers!
  • 16. Simplify downloaded data as desired. Now have students plot their own graphs by hand … Delete column B decimals, for example. or select columns A & B, then choose Insert Column ... to display this graph.
  • 17. Earth science students can study tidal cycles. A pattern of two high and two low tides each day is typical of the Hudson estuary, as seen here for Norrie Point. Tides travel all the way to Albany; the surface of the river is at sea level even there. How do tide events at Albany differ from the same tide events at Norrie? A given tide event happens later in Albany than at Norrie, and is more extreme (highs are higher, lows lower). Set up math problems with the graphs. How much higher is the first high tide of 7/31 when it reaches Albany than it was at Norrie? How much later is this event in Albany? What was the velocity of the tidal wave between Norrie and Albany?
  • 18. http://ny.water.usgs.gov/projects/dialer_plots/saltfront.html Click this URL to visit the actual U.S. Geological Survey salt front website Another good source of salinity, temperature, and tide data; also has links to stream level gauges on Hudson River tributaries.
  • 19. Map and table show salt front location
  • 20. NOAA: remotely sensed data from other estuaries http://estuaries.gov/ScienceData/Home.aspx Click this URL to visit the actual NOAA data website
  • 21.
  • 22.
  • 23.
  • 24.
  • 25.
  • 26.
  • 27.
  • 28. Hint : Can you think of a cycle affecting the river in which a seven day interval plays a role? The cycle of spring tides (greatest tidal range-higher highs/lower lows) and neap tides (least tidal range-lower highs/higher lows) is tied to the moon’s phases and relative positions of moon, sun, and earth over a 28 (7 X 4) day period. The graph is fairly “noisy,” but it shows the approximate times of spring tides (indicated by this arrow ) and neap tides (indicated by this arrow ).
  • 29. This graph plots salinity against the lunar tidal cycle. At what points in the cycle is salinity highest ? This graph plots temperature against the lunar tidal cycle. When in the cycle is temperature lowest ? Salinity peaks at times of spring tides. Temperature is lowest at times of spring tides.
  • 30. Tidal currents are strongest during spring tides. They mix the layers, making water near the surface saltier and cooler. During neap tides, stratification is more pronounced, so water near the surface is fresher and warmer. Graphic copyright www.chemgapedia.de The last piece of the puzzle involves currents and their effect on stratification - layering of water masses – in the estuary. The lower Hudson is a partially mixed estuary. Denser, saltier (and colder) water layers underneath fresher (and warmer) water at the surface.
  • 31. For more information, contact Steve Stanne, Education Coordinator NYSDEC – Hudson River Estuary Program in cooperation with the NYS Water Resources Institute at Cornell University 21 South Putt Corners Road New Paltz, NY 12561 845 256-3077 [email_address] Jean McAvoy, Education Coordinator NYSDEC - Hudson River Research Reserve in cooperation with the New England Interstate Water Pollution Control Commission Norrie Point Environmental Center PO Box 315 Staatsburg, NY 12580 845-889-4745 x 105 [email_address]