1. The role of solid phases in nutrient cycling in a restored coastal marsh
Taylor Barto1, François Birgand1, Randall Etheridge1, Michael Burchell1 and Matthew Polizzotto2
1Biological & Agricultural Engineering, 2Soil Science, North Carolina State University, Raleigh, NC 27695
1- Introduction
2- Objectives
4- Methods
10- Conclusions
With rising sea levels around the globe, coastal marshes are among the
most vulnerable coastal ecosystems. This project aims at quantifying the
fluxes of total suspended solids (TSS) and particulate organic matter (POM)
in tidal marshes. The fluxes were measured in a salt marsh restored from
agricultural land near Otway, North Carolina on North River Farms.
•Marsh imported TSS from upstream agricultural waters and from
the estuary
•TSS imports were visible at the tidal cycle scale
•TSS imports were visible at the longer-term scale
To determine whether and how salt marshes are coping with sea level rise
and if they are sources or sinks of solids, food, and nutrients. Apply method
over a three week period
• Conduct a mass balance within the marsh by calculating inputs and
outputs of TSS and POM at the upstream and downstream stations
• Flow and concentrations in these systems vary dramatically within
minutes because of tidal flows
• Flow and concentrations were measured continuously using wooden
flumes and visual absorbance data obtained from in UV - visual
spectrophotometers
• Calibrations of visible absorbance data with TSS and POM were obtained
from discrete samples analyzed in the laboratory and used to calculate
continuous concentrations from the 15-min absorbance data
• Establish Relationship of POM versus TSS, TSS versus flow, and TSS loads
versus time
Acknowledgements The author acknowledges the EPA 319 Grant delivered through NC DENR that funded the
project entitled: 'Quantification of In-Stream Water Quality Benefits of a Restored Coastal
Marsh' for funding this research. Special thanks to Elizabeth Allen for help with the work.
5- Calibration of Optical Instruments
Schematic of North River marsh restoration project showing the 5.7 ha
isolated marsh project (within the red perimeter) where the TSS and POM
mass balance is performed.
3- The Site
6- Extremely Variable Flow
7- Concentrations Coincide with Water Level
• Flow changes constantly and rapidly.
• This graph displays flow at the
downstream station over eight tidal
cycles.
• Positive flow depicts ebbing tide and
negative flow depicts flowing tide.
• These figures show that
concentrations change rapidly
with flow.
• The variation in POM closely
mirrors that of TSS, showing
the concentrations of each
directly correlated with the
water level of the stream.
8- Marsh tends to retain TSS
• These figures show the cumulative
TSS and POM loads over two
weeks at the upstream and
downstream stations. POM load
equaled 21% of TSS load.
• The TSS mass balance shows an
import of 302.5 kg of solids to the
marsh over the monitoring period,
which mainly occurred over one
flooding tide. 38% TSS retention.
• The POM mass balance shows an
import of 64.7 kg of solids, which
corresponds to 30% retention.
Positive values are input to the marsh and negative
values export from the marsh.
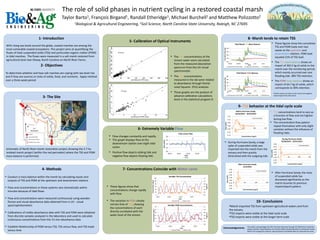
9- TSS behavior at the tidal cycle scale
• TSS concentrations tend to vary as
a function of flow and are highest
during low flow.
• The concentration flow pattern
repeat themselves with only slight
variation without the influence of
flooding tides.
• The TSS concentrations of the
stream water were calculated
from the measured absorption
spectrum from the UV-visual
spectrometer.
• The TSS concentrations
measured in the lab were related
to absorbance through Partial
Least Squares (PLS) analyses
• These graphs are the product of
advance calibration calculations
done in the statistical program R.
• During Hurricane Sandy, a large
spike of suspended solids was
imported into the marsh from the
estuary and then quickly
diminished with the outgoing tide.
• After Hurricane Sandy, the mass
of suspended solids has
decreased significantly as the
marsh resumes its previous
import/export pattern.
-0.30
-0.20
-0.10
0.00
0.10
0.20
0.30
0.40
0 50 100 150
Flow(m³/s)
Concentration (mg/L)
After Hurricane Sandy
11/5/2012
Concentration
-0.15
-0.10
-0.05
0.00
0.05
0.10
0.15
0 50 100 150
Flow(m³/s)
Concentration (mg/L)
Before Hurricane Sandy
10/24/2012 - 10/25/2012
Concentration
-0.60
-0.40
-0.20
0.00
0.20
0.40
0.60
0.80
0 50 100 150
Flow(m³/s)
Concentration (mg/L)
During Hurricane Sandy
10/30/2012 - 10/31/2012
Concentration
-100
100
300
500
700
10/23 10/26 10/29 11/1 11/4
CumulativeMass(kg)
Date
Tidal Marsh TSS Mass Balance
Downstream Flume Mass Upstream Flume Mass TSS Balance
-50
0
50
100
150
200
10/23 10/26 10/29 11/1 11/4
CumulativeMass(kg)
Date
Tidal Marsh POM Balance
Downstream Flume POM Upstream Flume POM POM Balance
-0.8
-0.4
0.0
0.4
0.8
10/24 10/25 10/26 10/27
Flow(m3/s)
Date
Time versus Flow
Flow
0.0
0.2
0.4
0.6
0.8
1.0
1.2
0
5
10
15
20
25
30
10/24 10/25 10/26 10/27
Stage(m)
Concentration(mg/L)
Date
Variable POM Concentrations
Derived POM Water Level
0.0
0.2
0.4
0.6
0.8
1.0
1.2
0
20
40
60
80
100
120
10/24 10/25 10/26 10/27
Stage(m)
Concentration(mg/L)
Date
Variable TSS Concentration
Derived TSS Water Level