Financia managment project slides
•Transferir como PPTX, PDF•
3 gostaram•827 visualizações

Last work of Master degree. Great Contribution of Rashid to follow a standards. Helpful For Finance students. Horizontal, vertical and all Ratios are covered and also interprets their results. we have also excel sheet of its if any one needed let me confirm

Recomendados
Recomendados
Mais conteúdo relacionado
Mais procurados
Mais procurados (19)
Destaque
Destaque (11)
Semelhante a Financia managment project slides
Semelhante a Financia managment project slides (20)
Último
Último (20)
Financia managment project slides
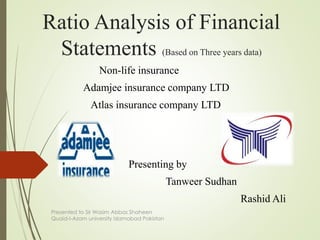
- 1. Ratio Analysis of Financial Statements (Based on Three years data) Non-life insurance Adamjee insurance company LTD Atlas insurance company LTD Presenting by Tanweer Sudhan Rashid Ali Presented to Sir Wasim Abbas Shaheen Quaid-I-Azam university Islamabad Pakistan
- 2. Presented to Sir Wasim Abbas Shaheen
- 3. Economic Indicators The economy of Pakistan is the 26th largest in the world in terms of purchasing power parity (PPP), and 44th largest in terms of nominal GDP GDP growth 2011 to 2014 Real GDP growth for 2011-12 was 3.7% 2012-13 was 3.6% 4.14% in 2013-14 Agriculture sector growth in 2011-2014 3.13% in 2011-2012 3.5% in 2012-2013 2.9% in 2013-2014Presented to Sir Wasim Abbas Shaheen
- 4. Economic Indicators Industrial sector growth 2011-2014 Service Sector 4.02% in 2011-12 3.7% in 2012-13 5.2% in2013-2014 PER CAPITA INCOME $ 1368 in 2012-13 $ 1,386 in 2013-14 Presented to Sir Wasim Abbas Shaheen
- 5. Economic Indicators INFLATION 13.8% 2011-2012 10.8% 2012-2013 8.7% 2013-14 Money and credit 14% in 2011-12 10% in 2012-2013 10% till Nov and 9.5% in last 2 months of 2014 Presented to Sir Wasim Abbas Shaheen
- 6. Non-life Insurance Sector Introduction There are 30 registered companies operating in non-life insurance sector according to 2011 data release by SECP The Pakistani non-life insurance segment recorded robust growth during the review period (2008-12) Reason of growth increasing levels of risk awareness and risk avoidance knowledge among consumers positive economic outlook and favorable government regulations for the segment Due to security issues Presented to Sir Wasim Abbas Shaheen
- 7. Companies Introduction Adamjee insurance company Adamjee Insurance Company Ltd. [AIC] established in 1960 It is the leader amongst 30 general insurance companies and commands a 38% market share 1000 employees at its 84 branches all over Pakistan Product and services Engineering Insurance Fire & Property Insurance Retail Insurance Marine Insurance Financial Lines Insurance Motor Insurance Presented to Sir Wasim Abbas Shaheen
- 8. COMPANIES INTRODUCTION ATLAS INSURANCE COMPANY The Company was founded in 1934 by Dr. Sir Muhammad Iqbal, the founder thinker of Pakistan The Company was taken over by the Atlas Group in 1980 PRODUCT AND SERVICES Fire Insurance Marine Insurance Motor Insurance Atlas Insurance Health Plan Money Insurance Presented to Sir Wasim Abbas Shaheen
- 9. LITERATURE REVIEW Five definitions for each tools used in analysis of financial statements and five definitions for their sub items. Main source of literature review Books Web Articles Our literature review based on Books web Presented to Sir Wasim Abbas Shaheen
- 10. METHODOLOGY Tools used Horizontal analysis Vertical analysis Ratio analysis Objectives of the tools Converting financial data into some useful information for further decision making Judge the present and future profitability Judge the operational efficiency Judge the short-term and long-term solvency Make a comparative study within inter-firm, within inter-department, to assess a firm’s financial health Presented to Sir Wasim Abbas Shaheen
- 11. METHODOLOGY Reason to use the tools • Horizontal analysis is used to measure the percentage change and amount change in different items of balance sheet and income statement by comparing series financial years • Vertical analysis is used to measure the percentage of different items of balance sheet and income statement to their respective base amount • Ratio analysis is used to compare the relationship between different items of balance sheet to measure liquidity, activity, solvency and profitability of a firms Presented to Sir Wasim Abbas Shaheen
- 12. METHODOLOGY Significance of tools The horizontal analysis of financial statements are good in determining performance of companies and are a great tool in deciding factors for management of all level The importance ofvertical analysis is that it makes comparisons between companies of different sizes within the same industry easier to prepare. It also allows a company to weigh its current reports against reports from its past, revealing possible trends or areas that need improvement Ratio analysis Measures Liquidity Position Measures operational Efficiency Measures Profitability Trend Analysis Presented to Sir Wasim Abbas Shaheen
- 13. Horizontal Analysis Assets Liability and Owner Equity Inc/Dec % Inc/Dec Inc/Dec % Inc/Dec Inc/Dec % Inc/Dec Inc/Dec % Inc/Dec cash and other assets 58 580.00% 44 64.71% Share capital and revenues current and other accounts 227,364 416.56% (119,894) -42.52% Authorized share capital 300,000 60.00% - 0.00% Depositing Maturing with in twelve Months - 0.00% - 0.00% (50,000,000 ) odinary shares of Rs 10 each - 0.00% - 0.00% 227,422 416.59% (119,850) -42.50% Issued, subscribed and paidup capital 88,588 20.00% 106,305 20.00% Loans to employee secured considered goods 53 45.30% (8) -4.71% (44,293,800) ordinary shares of Rs 10 each - 0.00% - 0.00% Investment 166,630 15.30% 294,486 23.45% Reserves 36,000 13.58% 43,000 14.28% Deferred taxation (1,297) -12.67% 11,316 126.56% Retained earnings 60,454 20.02% 93,765 25.88% Current Assets others - 0.00% - 0.00% 185,042 18.32% 243,070 20.34% Premium due but Unpaid (84,109) -26.79% 30,330 13.20% Underwriting Provisions - 0.00% - 0.00% Amount due from others insurance/reinsurance (14,504) -12.79% 11,673 11.80% Provision for outstanding claims (58,602) -22.58% 108,617 54.06% salvage recovries accured 5,165 153.26% (1,725) -20.21% Provision for unearned premium 332,149 74.93% (42,565) -5.49% Accured investment income 1,455 109.56% (2,435) -87.50% commission income unearned 21,940 47.43% (5,270) -7.73% Reinsurance recovries against outstanding claims (32,236) -21.00% 115,209 95.02% Total underwriting provision 295,487 39.45% 60,782 5.82% Deferred commission expense 44,424 194.03% (3,647) -5.42% - 0.00% - 0.00% prepayments 279,772 110.45% 615 0.12% Creditiors and Accurals - 0.00% - 0.00% Taxation-payments less provision 6,387 0.00% (6,387) -100.00% premium receive in advance 2,814 102.03% 2,480 44.51% Sundary receivables 3,778 24.76% (5,097) -26.78% Amount due to other insures / reinsurers 87,994 51.84% (21,080) -8.18% 210,132 23.96% 138,536 12.74% Accured expenses 3,461 6.71% 21,981 39.93% Fixed Assets - 0.00% - 0.00% Taxation provission less payments (11,193) -100.00% 30,488 0.00% Tangible - 0.00% - 0.00% Others creditors and Accurals 54,015 88.26% (37,345) -32.41% Freehold land - 0.00% - 0.00% 137,091 46.24% (3,476) -0.80% Building on freehold land (654) -5.00% (622) -5.00% Others liabilities - 0.00% - 0.00% Furniture and fixtures 723 29.16% (265) -8.28% Deposit Against performance Bonds 474 25.12% 7,092 300.38% office equipmenst 6,423 119.72% (1,227) -10.41% Unclaimed devidens 4,364 21.02% 6,725 26.77% Computers owned 1,788 39.52% 1,308 20.72% 4,838 21.36% 13,817 50.27% Motor vechiles - owned 11,804 62.55% (10,914) -35.58% - 0.00% - 0.00% 20,084 44.15% (11,720) -17.87% - 0.00% - 0.00% Intangible - 0.00% - 0.00% - 0.00% - 0.00% computer software (566) -39.94% 1,433 168.39% Total liabilities 437,416 40.95% 71,123 4.72% - 0.00% - 0.00% - 0.00% - 0.00% Total Assets 622,458 29.95% 314,193 11.63% Total Equity and liabilities 622,458 29.95% 314,193 11.63% Atlas Insurance company Horizontal analysis of Balance sheets for the year ended 31st dec 2011, 2012 & 2013 (Rupees in thousands) 2012 20132012 2013 (Rupees in thousands) Presented to Sir Wasim Abbas Shaheen
- 14. Horizontal Analysis of Profit & Loss . Inc/Dec % Change Inc/Dec % Change Net premium revenue 12,327 2.08% 152,068 25.19% Net claims 20,057 -13.08% (30,181) 22.65% Expenses (6,602) 2.90% (70,449) 30.09% Net commission 11,810 27.41% 278 0.51% Under writing results 37,592 14.82% 51,716 17.76% Investment income 47,120 35.28% 65,707 36.36% Rental income 128 2.41% 1,070 19.64% Other income (20,881) -63.30% 13,156 108.68% Financila charges (43) 10.14% 30 -6.42% General and adminestration expense (376) 1.51% (7,731) 30.52% 25,948 17.71% 72,232 41.89% - 0.00% - 0.00% Profit before taxation 63,540 15.88% 123,948 26.73% Provision for taxation (2,491) 2.52% (30,192) 29.77% profit after taxation 61,049 20.27% 93,756 25.88% - - profit and loss appropriation account - 0.00% - 0.00% - 0.00% - 0.00% Balnce at commencement year 58,699 24.13% 59,966 19.86% Profit after taxation for the year 61,049 20.27% 93,756 25.88% final dividend for 2010 @ 4 /share (2009: Rs 4/share) (29,529) 20.00% (35,435) 20.00% Transfer to general reserve (15,000) 71.43% (7,000) 19.44% Transfer to reserve for issue of bonuse share (14,765) 20.00% (17,717) 20.00% - 0.00% - 0.00% Balance unappropriated Profit at the end of year 60,454 20.02% 93,570 25.82% - - Basic and dialuted earning/ share _ Rupees - 0.00% - 0.00% (Rupees in thousands) 2012 2013 Atlas Insurance company Horizontal Analysis of Profit and loss account for the year ended 31 dec 2012 & 2013 Presented to Sir Wasim Abbas Shaheen
- 15. Vertical Analysis of B-S Assets 2011 2012 2013 Liabilites and owner Equity 2011 2012 2013 (Rupees in thousand) (Rupees in thousands) cash and other assets 0.00% 0.00% 0.00% Share capital and revenues current and other accounts 2.63% 10.44% 5.38% Authorized share capital 24.06% 29.62% 26.54% Depositing Maturing with in twelve Months 0.00% 0.00% 0.00% (50,000,000 ) odinary shares of Rs 10 each 0.00% 0.00% 0.00% 2.63% 10.44% 5.38% Issued, subscribed and paidup capital 21.31% 19.68% 21.16% Loans to employee secured considered goods0.01% 0.01% 0.01% (44,293,800) ordinary shares of Rs 10 each 0.00% 0.00% 0.00% Investment 52.42% 46.50% 51.43% Reserves 12.76% 11.15% 11.41% Deferred taxation 0.49% 0.33% 0.67% Retained earnings 14.53% 13.42% 15.13% Current Assets others 48.60% 44.25% 47.70% Premium due but Unpaid 15.11% 8.51% 8.63% Underwriting Provisions Amount due from others insurance/reinsurance5.46% 3.66% 3.67% Provision for outstanding claims 12.49% 7.44% 10.27% salvage recovries accured 0.16% 0.32% 0.23% Provision for unearned premium 21.33% 28.71% 24.31% Accured investment income 0.06% 0.10% 0.01% commission income unearned 2.23% 2.53% 2.09% Reinsurance recovries against outstanding claims7.39% 4.49% 7.84% Total underwriting provision 36.04% 38.68% 36.66% Deferred commission expense 1.10% 2.49% 2.11% prepayments 12.19% 19.74% 17.70% Creditiors and Accurals Taxation-payments less provision 0.00% 0.24% 0.00% premium receive in advance 0.13% 0.21% 0.27% Sundary receivables 0.73% 0.70% 0.46% Amount due to other insures / reinsurers 8.17% 9.54% 7.85% 42.20% 40.26% 40.66% Accured expenses 2.48% 2.04% 2.55% Fixed Assets Taxation provission less payments 0.54% 0.00% 1.01% Tangible Others creditors and Accurals 2.94% 4.27% 2.58% Freehold land 0.06% 0.04% 0.04% 14.27% 16.06% 14.27% Building on freehold land 0.63% 0.46% 0.39% Others liabilities Furniture and fixtures 0.12% 0.12% 0.10% Deposit Against performance Bonds 0.09% 0.09% 0.31% office equipmenst 0.26% 0.44% 0.35% Unclaimed devidens 1.00% 0.93% 1.06% Computers owned 0.22% 0.23% 0.25% 1.09% 1.02% 1.37% Motor vechiles - owned 0.91% 1.14% 0.66% 2.19% 2.43% 1.79% Intangible computer software 0.07% 0.03% 0.08% Total liabilities 51.40% 55.75% 52.30% Total Assets 100.00% 100.00% 100.00% Total Equity and liabilities 100.00% 100.00% 100.00% Atlas Insurance company Vertical Analysis of Balance sheets As on 31st of dec 2011, 2012 & 2014 Presented to Sir Wasim Abbas Shaheen
- 16. Vertical Analysis of Profit & loss . 2011 2012 2013 (Rupees in thousands) Net premium revenue 100.00% 100.00% 100.00% Net claims -25.93% -22.07% -21.63% Expenses -38.47% -38.78% -40.30% Net commission 7.29% 9.09% 7.30% Under writing results 42.89% 48.24% 45.38% Investment income 22.59% 29.93% 32.61% Rental income 0.90% 0.90% 0.86% Other income 5.58% 2.01% 3.34% Financila charges -0.07% -0.08% -0.06% General and adminestration expense -4.22% -4.20% -4.38% 24.78% 28.57% 32.38% Profit before taxation 67.66% 76.81% 77.75% Provision for taxation -16.73% -16.80% -17.41% profit after taxation 50.93% 60.01% 60.34% profit and loss appropriation account Balnce at commencement year 41.13% 50.02% 47.89% Profit after taxation for the year 50.93% 60.01% 60.34% final dividend for 2010 @ 4 /share (2009: Rs 4/share) -24.97% -29.35% -28.13% Transfer to general reserve -3.55% -5.96% -5.69% Transfer to reserve for issue of bonuse share -12.49% -14.68% -14.07% Balance unappropriated Profit at the end of year 51.06% 60.03% 60.33% Basic and dialuted earning/ share _ Rupees 0.00% 0.00% 0.00% Atlas Insurance company Vertical Analysis of Profit and Loss Account for the year ended 2011, 2012 & 2013 Presented to Sir Wasim Abbas Shaheen
- 17. Adamjee Insurance company Horizontal analysis of balance sheet Liabilities and owners Equity ASSETS Inc/Dec % Inc/Dec Inc/Dec % Inc/Dec Cash and bank deposits Inc/Dec % Inc/Dec Inc/Dec % Inc/Dec Share capital and reserves Cash and other equivalents 3,331 278% (20,397) -94.44% Authorized share capital 2,250,000 150.00% 0 0.00% Current and other accounts (6,406) -0.38% 178,296 11.68% Deposits meturing with in twelve months 129,817 12.65% 68,679 7.17% Paid-up share capital 2,262,955 182.93% - - 126,742 4.64% 226,578 9.04% Retained earnings (746,073) -8.40% 252,935 2.93% Loans - - Reserves (25,798) -2.27% 111,138 10.86% To Employees 3,360 26.27% (4,384) -25.53% (771,871) -7.70% 364,073 3.77% Investments 4,238,999 36.60% 1,624,931 16.32% Equity Attributable to equity holders of parent 1,491,084 13.25% 364,073 3.34% - - Non controlling intrest (6,188) -21.42% (48,859) -62.84% Deffered Taxation (139,719) -56.55% 45,461 22.55% Total Equity 1,484,896 13.16% 315,214 2.87% Current Assets - others - - Premiums due but un paid (543,263) -16.89% (381,698) -10.61% Balance of stature funds Amount due from other insurers / reinsurers 488,355 80.51% (73,072) -10.75% {including policy holdres liabilities of Rs 4,824.672 mill 2,842,653 140.89% 1,508,103 295.95% salvage Recovries accured 10,032 5.91% 3,953 2.39% Premium and claim reserves retained by cedents - 0.00% - 0.00% undrerwriting provisions Accured investment income 3,505 13.17% (13,917) -34.33% Provisions for outstanding claims 994,191 15.50% 836,290 15.00% Reinsurence recovries against outstanding claims 1,244,199 28.73% 530,863 13.97% Provisions for unearned 83,538 2.11% (367,053) -8.48% Taxation - payments less (5,702) -6.12% 80,106 615.06% Commission income (131,095) -41.85% (58,408) -15.71% Deffered commisiion (31,554) -7.47% (50,196) -10.63% 946,634 8.86% 410,829 4.00% Prepayments 37,968 2.17% (296,536) -14.52% Deferred liabilities Sundary Receivables (2011: (3,471) -1.66% 1,380 0.67% Staff retairments benefit 18,465 49.00% 11,229 42.44% 1,200,069 11.07% (199,117) -1.80% Creditors and accurals Fixed assets - tengible and intengible owned - - Premium receive in 100,792 78.66% 39,983 45.35% land and buildings (18,843) -4.06% 192,319 70.78% Amount due to other 157,783 31.26% (698,847) -58.06% furniture and fixtures 41,824 36.58% 37,672 49.14% Accured expenses (4,976) -4.15% (41,178) -25.57% Motor vechiles 48,061 21.46% 6,103 2.80% Other creditors and (7,300) -0.42% 219,843 14.50% Mechinary and Equipments 16,866 16.94% (114,357) -53.46% 246,299 9.90% (480,199) -16.17% Computers and related 4,159 8.26% (7,003) -12.21% Borrowings Intengible asset - computers 22,589 36.92% 2,290 3.89% Liabiliities against Assets subject to finance lease (18,304) -73.25% (33,580) -57.34% Capital work in progress Tengible (2,545) -2.77% (41,523) -31.13% Other liabilities 112,111 10.14% 75,501 7.33% Unclaimed dividends 2,117 5.95% 2,063 6.16% leased - - TOTAL LIBILITIES 1,195,211 9.00% (89,658) -0.67% Motor vechiles (18,802) -35.86% (35,311) -40.25% TOTAL EQUITY AND 5,522,760 20.78% 1,733,659 6.98% TOTAL ASSETS 5,522,760 20.78% 1,733,659 6.98% 2013 2012 2013 2012 Presented to Sir Wasim Abbas Shaheen
- 18. Horizontal Analysis of Profit & Loss REVENUE ACCOUNT Inc/Dec % Inc/Dec Inc/Dec % Inc/Dec Net premium revenue 1,956,826 24.89% 87,124 1.12% Net claims -Restated 202,676 -4.72% 481,176 -10.07% Expenses (23,367) 1.31% (388,554) 27.74% Net commission (308,018) 31.59% (110,925) 12.83% Net investment income - statutary refunds 162,357 105.08% 131,703 577.59% Add : Policy Holders liability at begning of the years 1,475,113 307.60% 380,083 382.07% Less : Policy holders liability at the end of the years (2,869,996) 146.83% (1,475,114) 307.60% Capital constribution from share holders' fund (107,094) -75.94% (43,428) -23.54% surplus of policy holders fund 60,334 -182.89% (2,968) 9.89% Under writing Rsults 548,831 -133.12% (940,903) -177.99% - - Investment income - others 1,269,031 113.70% 352,583 46.18% Rental income 4,402 807.71% (112) -17.05% other income (15,647) -9.46% 6,798 4.29% 1,806,617 207.70% (581,634) -40.07% - - General and Adminestration Expense (28,332) 6.59% 1,147,636 -72.74% Exchange gain / (loss) 7,857 281.41% 2,402 615.90% Finance charge on lease libilities 3,800 -68.09% 9,598 -63.23% Share of profit from Associated companies (47,627) -100.00% (170,983) -78.21% Profit before tax 1,742,315 359.51% 407,019 524.43% Provision for taxation (205,622) 477.27% (213,921) -125.22% Profit after tax 1,536,693 348.02% 193,098 77.72% Profit attributable to : - - Equity holders of parent 1,536,328 350.37% 198,354 82.60% Non controlling intrest 365 11.94% (5,256) -63.23% 1,536,693 348.02% 193,098 77.72% Profit and loss appropriation Account - parent company - - - - - - Balance at the commencement of the year 198,886 2.30% (69,124) -0.79% profit after tax for the year attributable to equity holders of the parent 1,536,328 350.37% 198,354 82.60% Final dividends for the year ended 31st dec 2010 @ 15% Rs 1.5/share (123,705) 185,557 -100.00% Issue of the bonus share for the year ended 31st dec 2010 nil (2009 : 10%) - - Interium dividend @10% (Rs 1/share) (123,705) 66.67% (61,852) 50.00% issue of bonus share @182.93% (2012: nill) (2,262,955) - other comprehensive income : remeasurment of defined benefit obligation-Restated 29,078 - Balance unappropriated Profit at the end of the year (746,073) -8.40% 252,935 2.93% - - Earning per share 2 59.32% 2 82.47% 2013 2012 Presented to Sir Wasim Abbas Shaheen
- 19. Vertical Analysis of Balance Sheet Liabilities and owners Equity 2013 2012 2011 ASSETS 2013 2012 2011 Cash and bank deposits Share capital and reserves Cash and other equivalents 0.01% 0.00% 0.09% Authorized share capital 11.68% 5.64% 6.04% Current and other accounts 5.29% 6.42% 6.15% Deposits meturing with in twelve months 3.60% 3.86% 3.85% Paid-up share capital 10.90% 4.65% 4.98% 8.91% 10.28% 10.09% Retained earnings 25.36% 33.43% 34.75% Loans Reserves 3.45% 4.27% 4.12% To Employees 0.05% 0.05% 0.07% 28.81% 37.70% 38.87% Investments 49.29% 43.58% 40.08% Equity Attributable to equity holders of parent 39.71% 42.35% 43.84% 0.00% 0.00% 0.00% Non controlling intrest 0.07% 0.11% 0.31% Deffered Taxation 0.33% 0.93% 0.81% Total Equity 39.78% 42.46% 44.16% Current Assets - others Premiums due but un paid 8.33% 12.10% 14.49% Balance of stature funds Amount due from other insurers / reinsurers 3.41% 2.28% 2.74% {including policy holdres liabilities of Rs 4,824.672 mill (2012:RS 1,954.675 mill)} 15.14% 7.59% 2.05% salvage Recovries accured 0.56% 0.64% 0.67% Premium and claim reserves retained by cedents 0.07% 0.09% 0.09% undrerwriting provisions Accured investment income 0.09% 0.10% 0.16% Provisions for outstanding claims (including IBNR) 23.07% 24.13% 22.44% Reinsurence recovries against outstanding claims 17.37% 16.29% 15.29% Provisions for unearned premium 12.60% 14.90% 17.42% Taxation - payments less provision 0.27% 0.35% 0.05% Commission income unearned 0.57% 1.18% 1.50% Deffered commisiion expense 1.22% 1.59% 1.90% 36.24% 40.21% 41.36% Prepayments 5.56% 6.57% 8.22% Deferred liabilities Sundary Receivables (2011: restated) 0.64% 0.79% 0.83% Staff retairments benefit 0.17% 0.14% 0.11% 37.52% 40.80% 44.45% Creditors and accurals Fixed assets - tengible and intengible owned Premium receive in advance 0.71% 0.48% 0.35% land and buildings 1.39% 1.75% 1.09% Amount due to other insurers/ reinsurers 2.06% 1.90% 4.84% furniture and fixtures 0.49% 0.43% 0.31% Accured expenses 0.36% 0.45% 0.65% Motor vechiles 0.85% 0.84% 0.88% Other creditors and Accurals- Restated 5.39% 6.53% 6.10% Mechinary and Equipments 0.36% 0.37% 0.86% 8.52% 9.36% 11.95% Computers and related accessories 0.17% 0.19% 0.23% Borrowings Intengible asset - computers softwares 0.26% 0.23% 0.24% Liabiliities against Assets subject to finance lease 0.02% 0.09% 0.24% Capital work in progress Tengible 0.28% 0.35% 0.54% Other liabilities 3.79% 4.16% 4.15% Unclaimed dividends 0.12% 0.13% 0.13% leased TOTAL LIBILITIES 45.08% 49.95% 53.79% Motor vechiles 0.10% 0.20% 0.35% TOTAL EQUITY AND LIBILITIES 100.00% 100.00% 100.00% TOTAL ASSETS 100.00% 100.00% 100.00% (Rupees in thousand) (Rupees in Thousand) Presented to Sir Wasim Abbas Shaheen
- 20. Vertical Analysis of Income Statement REVENUE ACCOUNT 2013 2012 2011 Net premium revenue 100.00% 100.00% 100.00% Net claims -Restated -41.70% -54.66% -61.46% Expenses -18.46% -22.76% -18.01% Net commission -13.07% -12.40% -11.12% Net investment income - statutary refunds 3.23% 1.97% 0.29% Add : Policy Holders liability at begning of the years 19.91% 6.10% 1.28% Less : Policy holders liability at the end of the years -49.13% -24.86% -6.17% Capital constribution from share holders' fund 0.35% 1.79% 2.37% surplus of policy holders fund 0.28% -0.42% -0.39% Under writing Rsults 1.39% -5.24% 6.80% Investment income - others 24.29% 14.20% 9.82% Rental income 0.05% 0.01% 0.01% other income 1.53% 2.10% 2.04% 27.26% 11.06% 18.67% General and Adminestration Expense -4.67% -5.47% -20.29% Exchange gain / (loss) 0.11% 0.04% 0.01% Finance charge on lease libilities -0.02% -0.07% -0.20% Share of profit from Associated companies 0.00% 0.61% 2.81% Profit before tax 22.68% 6.16% 1.00% Provision for taxation -2.53% -0.55% 2.20% Profit after tax 20.15% 5.62% 3.20% Profit attributable to : 0.00% 0.00% 0.00% Equity holders of parent 20.11% 5.58% 3.09% Non controlling intrest 0.03% 0.04% 0.11% 20.15% 5.62% 3.20% Profit and loss appropriation Account - parent company Balance at the commencement of the year 89.94% 109.79% 111.91% profit after tax for the year attributable to equity holders of the parent 20.11% 5.58% 3.09% Final dividends for the year ended 31st dec 2010 @ 15% Rs 1.5/share -1.26% 0.00% -2.39% Issue of the bonus share for the year ended 31st dec 2010 nil (2009 : 10%) 0.00% 0.00% 0.00% Interium dividend @10% (Rs 1/share) -3.15% -2.36% -1.59% issue of bonus share @182.93% (2012: nill) -23.05% 0.00% 0.00% other comprehensive income : remeasurment of defined benefit obligation-Restated 0.30% 0.00% 0.00% Balance unappropriated Profit at the end of the year 82.89% 113.01% 111.02% Rupees Rupees Rupee Earning per share 0.00% 0.00% 0.00% Profit and loss for the years ended 31st dec 2011 2012 2013 Presented to Sir Wasim Abbas Shaheen
- 21. Ratio Analysis • Liquidity Ratio • Activity Ratio • Leverage Ratio • Profitability Ratio • Market Ratio Presented to Sir Wasim Abbas Shaheen
- 22. Liquidity Ratio companies 2011 2012 2013 Average Atlas Inc company 2.56 2.17 2.49 2.40 Adam jee Inc company 3.72 4.36 4.40 4.16 Average 3.14 3.26 3.44 3.28 Current Ratio 0.00 0.50 1.00 1.50 2.00 2.50 3.00 3.50 4.00 4.50 5.00 Atlas Inc company Adam jee Inc company Average companies 2011 2012 2013 Average Atlas Inc company 2.56 2.17 2.49 2.40 Adamjee Inc company 3.72 4.36 4.40 4.16 Average 3.14 3.26 3.44 3.28 CurrentRatio 0.00 1.00 2.00 3.00 4.00 5.00 Atlas Inc company Adam jee Inc company Average Presented to Sir Wasim Abbas Shaheen
- 23. Activity Ratio companies 2011 2012 2013 Average Atlas Inc company 38.76 35.21 45.84 40 Adam jee Inc company 37.49 37.78 37.49 38 Average 38 36 42 39 Account receivable Turn over companies 2011 2012 2013 Average Atlas Inc company 9.42 10.37 7.96 9 Adam jee Inc company 9.60 9.53 7.59 9 Average 10 10 8 9 Average Collection Period companies 2011 2012 2013 Average Atlas Inc company 37.78 53.34 46.63 46 Adam jee Inc company 70.21 74.47 63.52 69 Average 54 64 55 58 Average payment period 0.00 20.00 40.00 60.00 80.00 Atlas Inc company Adam jee Inc company Average 0.00 2.00 4.00 6.00 8.00 10.00 12.00 Atlas Inc company Adam jee Inc company Average 0.00 10.00 20.00 30.00 40.00 50.00 Atlas Inc company Adam jee Inc company Average Presented to Sir Wasim Abbas Shaheen
- 24. Cont…. companies 2011 2012 2013 Average Atlas Inc company 9.42 10.37 7.96 9 Adam jee Inc company 9.60 9.53 7.59 9 Average 10 10 8 9 Operating cycle 0.00 5.00 10.00 15.00 Atlas Inc company Adam jee Inc company Average companies 2011 2012 2013 Average Atlas Inc company -28.36 -42.97 -38.67 -37 Adam jee Inc company -60.61 -64.94 -39.84 -55 Average -44 -54 -39 -46 Cash Conversion Cycle -80.00 -60.00 -40.00 -20.00 0.00 Atlas Inc company Adam jee Inc company Average companies 2011 2012 2013 Average Atlas Inc company 0.28 0.22 0.25 0.25 Adam jee Inc company 0.31 0.59 0.33 0.41 Average 0.30 0.41 0.29 0.33 TotalAssets turn over 0.00 0.20 0.40 0.60 0.80 Atlas Inc company Adam jee Inc company Average Presented to Sir Wasim Abbas Shaheen
- 25. Leverage Ratio 2011 2012 2013 Average Atlas insurance co 2.171 0.000 0.000 0.724 Adam jee insurance co 1.384 1.354 0.667 1.135 Average 1.777 0.677 0.334 0.929 Debt to equity ratio 2011 2012 2013 Average Atlas insurance co 0.51 1.00 1.00 0.84 Adam jee insurance co 0.54 0.52 0.47 0.51 Average 0.52 0.76 0.74 0.67 Debt ratio 0.00 0.20 0.40 0.60 0.80 1.00 1.20 Atlas insurance co Adam jee insurance co Average 0.000 0.500 1.000 1.500 2.000 2.500 Atlas insurance co Adam jee insurance co Average Presented to Sir Wasim Abbas Shaheen
- 26. ProfitabilityRatios 2011 2012 2013 Average Atlas insurance co 45.38% 0.00% 0.00% 15.13% Adam jee insurance co 6.80% -5.24% 1.39% 0.98% Average 26.09% -2.62% 0.70% 8.05% Gross Profit Margin 2011 2012 2013 Average Atlas insurance co 51.06% 60.03% 60.33% 57.14% Adam jee insurance co 3.20% 5.62% 20.15% 9.65% Average 27.13% 32.82% 40.24% 33.40% Net Profit Margin -50.00% 0.00% 50.00% 2011 2012 2013 Average Gross Profit Margin Atlas insurance co Adam jee insurance co Average 0.00% 50.00% 100.00% 2011 2012 2013 Average Net Profit Margin Atlas insurance co Adam jee insurance co Average Presented to Sir Wasim Abbas Shaheen
- 27. Cont.. 2011 2012 2013 Average Atlas insurance co 28.45% 25.26% 26.44% 26.72% Adam jee insurance co 31.30% 1.72% 6.74% 13.25% Average 29.87% 13.49% 16.59% 19.99% Retun on Assets 2011 2012 2013 Average Atlas insurance co 29.90% 32.87% 34.63% 32.47% Adam jee insurance co 2.57% 4.49% 47.22% 18.09% Average 16.23% 18.68% 40.93% 25.28% Return on Equity 0.00% 20.00% 40.00% 2011 2012 2013 Average Return on Assets Atlas insurance co Adam jee insurance co Average 0.00% 20.00% 40.00% 60.00% 2011 2012 2013 Average Return on Equity Atlas insurance co Adam jee insurance co Average Presented to Sir Wasim Abbas Shaheen
- 28. Market Value Ratio 2011 2012 2013 Average Atlas insurance co 3.26 3.90 4.65 3.94 Adam jee insurance co 2.465 1.48 1.231 1.73 Average 2.86 2.69 2.94 2.83 Dividend per share 2011 2012 2013 Average Atlas insurance co 6.82 6.82 7.15 6.93 Adam jee insurance co 2 4 6 3.74 Average 4.41 5.19 6.40 5.34 Earning per share 2011 2012 2013 Average Atlas insurance co 0.48 0.57 0.65 0.57 Adamjee insurance co 1.23 0.42 1.23 0.96 Average 0.85 0.49 0.94 0.76 Dividend payement ratio 0.00 1.00 2.00 3.00 4.00 5.00 2011 2012 2013 Average Atlas insurance co Adam jee insurance co Average 0.00 2.00 4.00 6.00 8.00 Atlas insurance co Adam jee insurance co Average 0.00 0.50 1.00 1.50 Atlas insurance co Adam jee insurance co Average Presented to Sir Wasim Abbas Shaheen
- 29. Cont…. 2011 2012 2013 Average Atlas insurance co 9.97 9.97 9.51 9.81 Adam jee insurance co 15.16 45.94 36.97 32.69 Average 12.57 27.95 23.24 21.25 Price or Earning ratio 0.00 10.00 20.00 30.00 40.00 50.00 2011 2012 2013 Average Atlas insurance co Adam jee insurance co Average Presented to Sir Wasim Abbas Shaheen
- 30. RECOMMENDATION • Both the companies need to improve their liquidity positions • Both companies should use more debt to reduce WACC. • Cash conversion cycle of both the companies should near to positive so that more people will trust • Adamjee insurance company should increase it gross profit margin by controlling the operating cost. • Adamjee insurance company should increase its net profit margin by reducing different administration cost. • Both companies need to improve their average collection period.Presented to Sir Wasim Abbas Shaheen
- 31. Presented to Sir Wasim Abbas Shaheen