January 2014 revenue data, State of Virginia
•
0 gostou•736 visualizações

January 2014 revenue data, State of Virginia. Gloucester, Virginia Links and News website attachment information. Visit us for the uncommon in the Commonwealth of Virginia.

Recomendados
Recomendados
Mais conteúdo relacionado
Mais procurados
Mais procurados (18)
Destaque
Destaque (14)
Semelhante a January 2014 revenue data, State of Virginia
Semelhante a January 2014 revenue data, State of Virginia (20)
Mais de Chuck Thompson
Mais de Chuck Thompson (20)
Último
Último (20)
January 2014 revenue data, State of Virginia
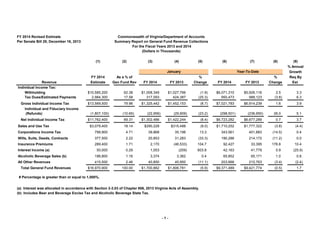
- 1. FY 2014 Revised Estimate Per Senate Bill 29, December 16, 2013 Commonwealth of Virginia/Department of Accounts Summary Report on General Fund Revenue Collections For the Fiscal Years 2013 and 2014 (Dollars in Thousands) (1) (2) FY 2014 Estimate As a % of Gen Fund Rev (3) (4) (5) (6) January Revenue Individual Income Tax: Withholding Tax Dues/Estimated Payments FY 2014 FY 2013 (7) (8) Year-To-Date % Change FY 2014 FY 2013 % Change (9) % Annual Growth Req By Est $10,585,200 2,984,300 62.38 17.58 $1,008,349 317,093 $1,027,766 424,387 (1.9) (25.3) $6,071,310 950,473 $5,926,116 988,123 2.5 (3.8) 3.3 6.3 Gross Individual Income Tax Individual and Fiduciary Income (Refunds) $13,569,500 79.96 $1,325,442 $1,452,153 (8.7) $7,021,783 $6,914,239 1.6 3.9 26.0 5.1 Net Individual Income Tax $11,762,400 69.31 $1,302,486 $1,422,244 (8.4) $6,723,282 $6,677,289 0.7 3.7 $3,079,400 18.14 $290,228 $315,488 (8.0) $1,710,252 $1,777,322 (3.8) (4.4) Corporations Income Tax 799,900 4.71 39,868 35,196 13.3 343,561 401,883 (14.5) 0.4 Wills, Suits, Deeds, Contracts 377,500 2.22 20,853 31,283 (33.3) 190,286 214,172 (11.2) 0.0 Insurance Premiums 289,400 1.71 2,170 (46,533) 104.7 92,427 33,395 176.8 50,000 0.29 1,053 (209) 603.8 42,163 41,779 0.9 (25.9) 196,800 1.16 3,374 3,362 0.4 65,852 65,171 1.0 0.8 Sales and Use Tax Interest Income (a) Alcoholic Beverage Sales (b) All Other Revenues Total General Fund Revenues (1,807,100) (10.65) (22,956) (29,909) (23.2) (298,501) (236,950) 10.4 415,500 2.46 40,850 45,950 (11.1) 203,666 210,763 (3.4) (2.4) $16,970,900 100.00 $1,700,882 $1,806,781 (5.9) $9,371,489 $9,421,774 (0.5) 1.7 # Percentage is greater than or equal to 1,000%. (a) Interest was allocated in accordance with Section 3-3.03 of Chapter 806, 2013 Virginia Acts of Assembly. (b) Includes Beer and Beverage Excise Tax and Alcoholic Beverage State Tax. -1-
- 2. Commonwealth of Virginia/Department of Accounts General Fund Statement of Revenue Collections and Estimates For the Fiscal Years 2013 and 2014 (Dollars in Thousands) FY 2014 Revised Estimate Per Senate Bill 29, December 16, 2013 (1) Revenue Taxes: Individual Income Tax - Withholding Tax Dues/Estimated Payments Gross Individual Income Tax Individ and Fiduc Income (Refunds) Net Individual Income Tax Sales and Use Tax Corporations Income Public Service Corporations Insurance Premiums Alcoholic Beverage Excise Beer and Beverage Excise Wills, Suits, Deeds, Contracts Inheritance, Gift, and Estate Bank Franchise Other Taxes Total Taxes Rights and Privileges: Licenses and Permits Corp. Franchise and Charters Fees for Misc. Privileges & Services Total Rights and Privileges Other Revenues: Sales of Property & Commodities Assessmts & Rcpts for Support of Special Svcs Institutional Revenue Interest (a) Dividends and Rent Fines, Forfeitures & Fees Other Revenue Excess Fees Private Donations, Gifts & Cont. Cities, Counties, and Towns Total Other Revenues Total General Fund Revenues FY 2014 Estimate $10,585,200 2,984,300 $13,569,500 (1,807,100) $11,762,400 3,079,400 799,900 97,700 289,400 154,500 42,300 377,500 0 20,000 (700) $16,622,400 (2) As a % of Total Gen Fund Rev 62.38 17.58 79.96 (10.65) 69.31 18.14 4.71 0.58 1.71 0.91 0.25 2.22 0.00 0.12 0.00 97.95 (3) (4) January FY 2014 FY 2013 $1,008,349 317,093 $1,325,442 (22,956) $1,302,486 290,228 39,868 8,409 2,170 0 3,374 20,853 0 3 1,173 $1,668,564 $1,027,766 424,387 $1,452,153 (29,909) $1,422,244 315,488 35,196 7,965 (46,533) 0 3,362 31,283 853 0 94 $1,769,952 (5) (6) % Change FY 2014 FY 2013 $6,071,310 950,473 $7,021,783 (298,501) $6,723,282 1,710,252 343,561 47,623 92,427 40,465 25,387 190,286 29 530 1,349 $9,175,191 $5,926,116 988,123 $6,914,239 (236,950) $6,677,289 1,777,322 401,883 47,740 33,395 39,509 25,662 214,172 899 79 3,301 $9,221,251 (1.9) (25.3) (8.7) (23.2) (8.4) (8.0) 13.3 5.6 104.7 0.4 (33.3) (100.0) # (5.7) (7) Year-To-Date (8) % Change (9) % Annual Growth Req By Est 2.5 (3.8) 1.6 26.0 0.7 (3.8) (14.5) (0.2) 176.8 2.4 (1.1) (11.2) (96.8) 570.9 (59.1) (0.5) 3.3 6.3 3.9 5.1 3.7 (4.4) 0.4 1.5 10.4 1.1 0.0 0.0 100.0 (2.2) (33.3) 1.9 $4,300 47,900 10,800 $63,000 0.03 0.28 0.06 0.37 $141 12,015 1,583 $13,739 $153 11,451 1,330 $12,934 (7.8) 4.9 19.0 6.2 $2,183 15,007 6,161 $23,351 $2,270 14,285 5,601 $22,156 (3.8) 5.1 10.0 5.4 3.0 1.7 (0.8) 1.4 $100 400 5,600 50,000 300 219,100 11,600 (9,400) 0 7,800 $285,500 0.00 0.00 0.03 0.29 0.00 1.29 0.07 (0.06) 0.00 0.06 1.68 $0 18 492 1,053 18 16,451 387 (437) 0 597 $18,579 $0 30 414 (209) 17 18,521 5,042 (794) 0 874 $23,895 (40.0) 18.8 603.8 5.9 (11.2) (92.3) 45.0 (31.7) (22.2) $2,330 180 3,060 42,163 254 123,474 1,946 (5,202) 3 4,739 $172,947 $0 188 3,439 41,779 236 126,483 7,706 (5,914) 0 4,450 $178,367 (4.3) (11.0) 0.9 7.6 (2.4) (74.7) 12.0 6.5 (3.0) 78.6 23.1 (1.7) (25.9) (12.5) (2.5) (40.4) 13.0 (100.0) (1.6) (9.4) $16,970,900 100.00 $1,700,882 $1,806,781 # Percentage is greater than or equal to 1,000%. (a) Interest was allocated in accordance with Section 3-3.03 of Chapter 806, 2013 Virginia Acts of Assembly. -2- (5.9) $9,371,489 $9,421,774 (0.5) 1.7
- 3. Commonwealth of Virginia/Department of Lottery Summary Report on Lottery Collections For the Fiscal Years 2013 and 2014 (Dollars in Thousands) January FY 2014 Estimate (a) Year-To-Date FY 2014 (b) FY 2013 % Change FY 2014 (b) FY 2013 % Annual Growth % Required Change (c) By Estimate Lottery Collections Total Lottery Sales Other Income Total Income $1,744,200 1,500 $1,745,700 $141,635 20 $141,655 $133,589 70 $133,659 6.0 (71.4) 6.0 Less: Prize Expenses Retailer Commissions Operating Expenses Total Expenses $1,059,658 99,362 91,679 $1,250,699 $81,028 8,078 7,344 $96,450 $74,268 7,728 6,127 $88,123 $495,001 22,199 $517,200 $45,205 0 $45,205 $45,536 0 $45,536 Net Proceeds from Operations Net Lottery Ticket Profits Prior Year Residual Profit Transfer Available to Lottery Proceeds Fund $1,033,776 1,048 $1,034,824 $945,505 1,016 $946,521 9.3 3.1 9.3 3.3 (5.5) 3.2 9.1 4.5 19.9 9.4 $606,024 57,443 50,543 $714,010 $560,081 53,284 49,022 $662,387 8.2 7.8 3.1 7.8 3.4 4.6 8.9 3.9 (0.7) (0.7) $320,814 22,199 $343,013 $284,134 22,971 $307,105 12.9 (3.4) 11.7 (a) Estimate established by Senate Bill 29, December 16, 2013. Prior Year Residual Profit Transfer of $22,199,087 was made on August 20, 2013, and is included in the total revenue estimate. (b) Amounts reported are accrual-based estimates (unaudited closing). (c) The current year figures on this chart, including growth percentages, are not an indicator of the probable outcome for the fiscal year. Lottery revenues can have dramatic swings up and down month to month depending on the lotto jackpots, prize expense, and game related administrative expenses. -3- 6.6 6.1
- 4. Commonwealth of Virginia/Department of Accounts Highway Maintenance and Operating Fund and Transportation Trust Fund Revenues Summary Statement of Selected Revenue Estimates & Collections For the Fiscal Years 2013 and 2014 (Dollars in Thousands) % Annual January As a % FY 2014 Revenue Motor Fuel Taxes (b) of Total Estimate Fund Year-To-Date Growth % FY 2014 FY 2013 % Change Required Change By Estimate FY 2014 FY 2013 $350,878 $442,399 (20.7) (27.8) - 130,769 130,064 0.5 0.6 $607,500 15.24 $48,373 $71,701 Priority Transportation Fund (PTF) (b) 130,800 3.28 0 0 Motor Vehicle Sales and Use Tax 859,200 21.55 69,863 54,174 29.0 471,532 356,424 32.3 38.0 State Sales and Use Tax (a) 837,800 21.01 83,544 53,442 56.3 473,501 303,016 56.3 60.8 Motor Vehicle License Fees 250,700 6.29 18,157 19,512 (6.9) 137,294 137,377 (0.1) 2.1 International Registration Plan 62,300 1.56 4,556 6,521 (30.1) 28,927 27,744 4.3 0.9 Recordation Tax 45,500 1.15 2,511 3,876 (35.2) 22,968 26,210 (12.4) (1.8) Interest Earnings 13,100 0.33 1,615 2,095 (22.9) 3,578 4,733 (24.4) 41.1 Misc. Taxes, Fees, and Revenues 16,100 0.40 1,288 1,409 (8.6) 9,558 7,739 23.5 8.7 $2,823,000 70.81 $229,907 $212,730 $1,629,005 $1,435,706 13.5 13.2 Total State Taxes and Fees (32.5) 8.1 # Percentage is greater than or equal to 1,000%. (a) New revenue streams for State Sales and Use Tax are included in the Fiscal Year 2014 Highway Maintenance and Operating Fund Revenue Forecast. As there were no collections for state sales and use tax recorded in the Highway Maintenance and Operating Fund during Fiscal Year 2013, a comparison between Fiscal Years 2013 and 2014 may not be appropriate. Refer to the "State Sales and Use Tax" line item on page 5 for the detailed information pertaining to the "State Sales and Use Tax" line item. (b) Certain Fiscal Year 2013 monthly and year-to-date amounts have been reclassified. Refer to (b) on page 5 for additional information. -4-
- 5. Commonwealth of Virginia/Department of Accounts Highway Maintenance and Operating Fund and Transportation Trust Fund Revenues Statement of Revenue Estimates & Collections For the Fiscal Years 2013 and 2014 (Dollars in Thousands) Revenue HIGHWAY MAINTENANCE AND OPERATING FUND: Motor Fuel Taxes (Includes Road Tax) Motor Vehicle Sales and Use Tax State Sales and Use Tax (a) Motor Vehicle License Fees International Registration Plan Recordation Tax (1 cent) Misc. Taxes, Fees, and Revenues Total State Taxes and Fees Other Revenues: Federal Grants and Contracts Miscellaneous Revenues Transfer (to) / from Transportation Trust Fund Total Highway Maintenance and Operating Fund FY 2014 Estimate As a % of Total Fund January FY 2014 Year-To-Date % Change FY 2013 FY 2014 FY 2013 % Change % Annual Growth Required By Est $485,100 611,700 199,500 228,800 62,300 15,000 16,100 $1,618,500 12.17 15.34 5.00 5.74 1.56 0.39 0.40 40.60 $36,587 49,071 20,416 16,508 4,556 837 1,288 $129,263 $59,979 33,165 0 17,682 6,521 1,292 1,409 $120,048 (39.0) 48.0 (6.6) (30.1) (35.2) (8.6) 7.7 $279,635 333,446 108,569 125,365 28,927 7,665 9,558 $893,165 $371,896 220,331 0 125,220 27,744 8,737 7,739 $761,667 (24.8) 51.3 0.1 4.3 (12.3) 23.5 17.3 (31.3) 57.9 2.2 0.9 (2.9) 8.7 14.8 $0 18,658 0.00 0.47 $2,146 1,663 $2,337 1,243 (8.2) 33.8 $17,082 10,386 $15,186 8,975 12.5 15.7 (100.0) 11.5 313,942 7.87 0 0 - 190,000 170,000 11.8 (10.4) $1,951,100 48.94 $133,072 $123,628 7.6 $1,110,633 $955,828 16.2 8.3 TRANSPORTATION TRUST FUND: Motor Fuel Taxes (Includes Aviation & Road Taxes) (b) PTF Insurance Premiums Tax Motor Vehicle Sales and Use Tax (Includes Rental Tax) State Sales and Use Tax Motor Vehicle License Fees Recordation Tax (2 cents) Interest Earnings Total State Taxes and Fees $122,400 130,800 3.07 3.28 $11,786 0 $11,722 0 0.5 - $71,243 130,769 $70,503 130,064 1.0 0.5 (9.5) 0.6 247,500 638,300 21,900 30,500 13,100 $1,204,500 6.21 16.01 0.55 0.76 0.33 30.21 20,792 63,128 1,649 1,674 1,615 $100,644 21,009 53,442 1,830 2,584 2,095 $92,682 (1.0) 18.1 (9.9) (35.2) (22.9) 8.6 138,086 364,932 11,929 15,303 3,578 $735,840 136,093 303,016 12,157 17,473 4,733 $674,039 1.5 20.4 (1.9) (12.4) (24.4) 9.2 5.2 22.5 1.1 (1.3) 41.1 11.2 Other Revenues: Federal Grants and Contracts Receipts from Cities/Counties Toll Revenues (Includes Route 28) Miscellaneous Revenues Total Other Revenues $929,928 178,614 16,768 19,854 $1,145,164 23.33 4.48 0.42 0.49 28.72 $54,354 5,870 835 882 $61,941 $90,874 3,236 897 288 $95,295 (40.2) 81.4 (6.9) 206.3 (35.0) $863,510 51,640 6,964 13,101 $935,215 $915,309 43,375 6,686 34,986 $1,000,356 (5.7) 19.1 4.2 (62.6) (6.5) (28.8) 208.5 (5.0) (57.6) (19.9) Transfer (to) / from Highway Maintenance and Operating Fund Total Transportation Trust Fund ($313,942) $2,035,722 (7.87) 51.06 $0 $162,585 $0 $187,977 (13.5) ($190,000) $1,481,055 ($170,000) $1,504,395 (11.8) (1.6) 10.4 (5.8) $295,657 $311,605 (5.1) $2,591,688 $2,460,223 5.3 0.6 TOTAL HIGHWAY MAINTENANCE AND OPERATING AND TRANSPORTATION TRUST FUND $3,986,822 100.00 # Percentage is greater than or equal to 1,000%. (a) This line item was added to the Fiscal Year 2014 Revenue Forecast. Since there were no collections for this line item during Fiscal Year 2013, the Monthly and Year-To-Date % Change columns do not provide comparable data. (b) The "PTF Motor Fuels" line item was removed from the Transportation Trust Fund Revenue Forecast. The amount previously reported in "PTF Motor Fuels" was reclassified to "Motor Fuel Taxes (Includes Aviation & Roads Taxes)." In order to provide comparable data, the Fiscal Year 2013 monthly and year-to-date amounts were likewise reclassified. -5-
- 6. Total General Fund Revenues 2000 1800 1600 $ Millions 1400 FY 2014 1200 FY 2013 FY 2012 1000 800 600 400 200 0 JUL AUG SEP OCT NOV DEC JAN FY 2012 Actual = $15,846.7 Million FY 2013 Actual = $16,684.6 Million FY 2014 Estimate = $16,970.9 Million -6- FEB MAR APR MAY JUN
- 7. Net Individual Income Tax 1600 1400 1200 $ Millions 1000 FY 2014 FY 2013 800 FY 2012 600 400 200 0 JUL AUG SEP OCT NOV DEC JAN FY 2012 Actual = $10,612.8 Million FY 2013 Actual = $11,340.0 Million FY 2014 Estimate = $11,762.4 Million -7- FEB MAR APR MAY JUN
- 8. Individual and Fiduciary Income Tax Refunds 500 450 400 $ Millions 350 FY 2014 300 FY 2013 FY 2012 250 200 150 100 50 0 JUL AUG SEP OCT NOV DEC FY 2012 Actual = $1,784.7 Million FY 2013 Actual = $1,719.1 Million FY 2014 Estimate = $1,807.1 Million -8- JAN FEB MAR APR MAY JUN
- 9. DEPARTMENT OF THE TREASURY General Account Investment Portfolio Monthly Average Balances and Rates For the Fiscal Year 2014 (Dollars in Millions) MONTH PRIMARY LIQUIDITY COMPOSITE EXTERNAL MANAGEMENT EXTENDED DURATION TREASURY 1 YR. CONSTANT MATURITY1 Avg. Balance Yield Avg. Balance Annualized Total Return Avg. Balance Rate Yield July, 2013 $4,340.0 0.23% $1,157.6 2.22% $5,497.6 0.65% 0.12% August $3,872.1 0.25% $1,156.3 -4.33% $5,028.4 -0.80% 0.13% September $4,217.5 0.25% $1,158.0 8.23% $5,375.5 1.97% 0.12% October $4,601.1 0.24% $1,165.3 7.17% $5,766.4 1.64% 0.12% November $4,167.9 0.25% $1,168.4 -0.26% $5,336.3 0.14% 0.12% December $4,028.8 0.25% $1,165.8 -4.96% $5,194.6 -0.92% 0.13% January, 2014 $4,439.3 0.23% $1,169.5 12.92% $5,608.8 2.88% 0.12% $4,238.1 0.24% $1,163.0 3.00% $5,401.1 0.84% 0.12% February March April May June Year-to-Date Average ▪ Performance on the extended duration portion of the General Account is reported on an annualized total return basis. Total return includes unrealized gains and losses, which in the short term can make returns more volatile. Over an extended time period the fluctuations average out and total return approaches the portfolio yield. ▪ Unaudited. 1 Federal Reserve Bank H.15 Release. -9-
- 10. Commonwealth of Virginia/Department of Accounts Report on the Revenue Stabilization Fund For the Fiscal Year 2014 Month Beginning Balance Deposits Withdrawals Interest Allocated (A) Ending Balance July $439,971,765 $0 $0 $0 $439,971,765 August $439,971,765 $0 $0 $0 $439,971,765 September $439,971,765 $0 $0 $0 $439,971,765 October $439,971,765 $0 $0 $865,753 $440,837,518 November $440,837,518 $0 $0 $0 $440,837,518 December $440,837,518 $0 $0 $0 $440,837,518 January $440,837,518 $0 $0 $611,764 $441,449,282 February March April May June Notes: (A) Interest is earned monthly but credited to the Revenue Stabilization Fund on a quarterly basis. -10-