SlideShare uma empresa Scribd logo
1 de 60
Baixar para ler offline
Swedbank – Interim report January-June 2014 Page 1 of 60
Second quarter 2014
Compared with first quarter 2014
 The result for continuing operations amounted to SEK 4 369m (3 980m)
1)
 Earnings per share for continuing operations amounted to SEK 3.96 (3.62)
before dilution and SEK 3.94 (3.59) after dilution
 The return on equity for continuing operations was 16.6 per cent (14.6)
 The cost/income ratio was 0.47 (0.45), excluding Sparbanken Öresund
0.43
 Net interest income amounted to SEK 5 521m (5 483), excluding
Sparbanken Öresund SEK 5 473m
 Profit before impairments increased by 9 per cent to SEK 5 536m (5 094)
Excluding Sparbanken Öresund it amounted to SEK 5 698m
 Swedbank reported credit impairments of SEK 30m (recoveries 100)
 The Common Equity Tier 1 ratio was 20.9 per cent (18.3 per cent as of 31
December 2013), including use of the advanced internal ratings-based
approach
3)
January-June 2014
Compared with January-June 2013
 The result for the period for continuing operations amounted to SEK
8 349m (7 394)
1)
 Earnings per share for continuing operations amounted to SEK 7.58 (6.73)
before dilution and SEK 7.53 (6.69) after dilution
2)
 The return on equity for continuing operations was 15.5 per cent (14.7)
 The cost/income ratio was 0.46 (0.45), excluding Sparbanken Öresund
0.44
 Net interest income increased by 2 per cent to SEK 11 004m (10 762),
excluding Sparbanken Öresund SEK 10 956m
 Profit before impairments increased by 7 per cent to SEK 10 630m (9 892),
excluding Sparbanken Öresund SEK 10 792m
 Swedbank reported recoveries of SEK 70m (credit impairments 148)
1)
Russia and Ukraine are reported as discontinued operations. The Ukrainian operations were
divested during the second quarter 2013.
2)
Including deduction of preference share dividend, earnings per share for Jan-Jun 2013 were
SEK 3.07 for total operations after dilution. The calculations are specified on page 53.
3)
The Common Equity Tier 1 ratios for 2013 are based on Swedbank’s previous calculations
according to the new regulations.
0
500
1 000
1 500
2 000
2 500
3 000
3 500
4 000
4 500
5 000
Q2-
2013
Q3-
2013
Q4-
2013
Q1-
2014
Q2-
2014
SEKm
Profit for the quarter, continuing
operations
0,0
0,5
1,0
1,5
2,0
2,5
3,0
3,5
4,0
4,5
5,0
Q2-
2013
Q3-
2013
Q4-
2013
Q1-
2014
Q2-
2014
SEK
Earnings per share after dilution,
continuing operations
0,0
2,0
4,0
6,0
8,0
10,0
12,0
14,0
16,0
18,0
20,0
Q2-
2013
Q3-
2013
Q4-
2013
Q1-
2014
Q2-
2014
%
Return on equity, continuing
operations
14,0
15,0
16,0
17,0
18,0
19,0
20,0
21,0
22,0
Q2-
2013
Q3-
2013
Q4-
2013
Q1-
2014
Q2-
2014
%
Common Equity Tier 1 capital ratio, %,
Basel 3
Swedbank – Interim report January-June 2014 Page 2 of 60
CEO Comment
The global recovery is continuing, albeit at a slower
pace – the US economy is growing steadily, whereas
growth in Europe is more divided. Economic activity in
Sweden continued to grow during the second quarter,
and in addition to strong domestic demand we saw
signs of increased credit demand in the commercial
sector for the first time in a while.
Higher profit and strong volume growth
Swedbank’s profit for the second quarter was strong.
Lower market interest rates affected net interest income
negatively, while increased lending and deposit volumes
contributed positively. Notably, the quarter saw
increased activity among our corporate customers and
growth in urban areas. Lending volumes rose by nearly
SEK 50bn during the quarter, with Sparbanken Öresund
accounting for just over SEK 16bn. At the same time
increased savings, coupled with a favourable stock
market climate, strengthened the profit.
Swedbank’s acquisition of Sparbanken Öresund was
finalised in May and integration work has begun. In the
near term we are focusing on our new customers and
on capitalising on cost synergies.
The bank’s low risk entails lower funding costs
Swedbank’s Common Equity Tier 1 ratio was 20.9 per
cent at the end of the quarter. In May the Swedish
Financial Supervisory Authority published its proposed
capital requirements, but we need further clarification
before we set a new capital target. It seems
contradictory, however, that Swedbank, which according
to the Swedish Financial Supervisory Authority’s and the
Riksbank’s own stress tests has the lowest aggregate
risks of any major Swedish bank, should have the
highest capital requirement.
The bank's low risk and solid capitalisation were noted
by the ratings agencies Fitch and S&P during the
quarter. Fitch raised its outlook for Swedbank’s credit
rating to positive and S&P upgraded the bank's
individual rating by one notch to A while at the same
time reaffirming Swedbank’s long-term rating of A+. The
bank’s low risk further reduced our funding costs during
the quarter.
New head office will increase customer value
In early June we moved into our new head office in
Sundbyberg. The move supports our aim to be the most
cost-effective bank and offers a new way of working.
The new, open-plan offices invite cooperation and
discussion between employees, which in the long run
will increase customer value.
During the quarter we introduced new solutions that
make daily life a little easier for our customers: card
payments by smartphone (Babs Micro), Swish corporate
for mobile payments between consumers and
businesses, and a spending tracker, “Utgiftskollen”,
which attracted 150 000 customers in its first month.
“Swish” payments between retail customers continue to
grow, with 144 000 new customers during the quarter
and a 90 per cent increase in the number of
transactions. Moreover, we decided to keep the Swish
service free for retail customers.
Swedish housing shortage – more to be done
The political debate leading up to this autumn's
parliamentary election in Sweden has intensified. The
Riksbank’s rate cut puts the burden on legislators and
regulators to take action to slow the growth in household
debt and to build more housing. New construction and
opportunities for increased mobility in the housing
market are key issues for Sweden, especially since a
solution to the severe housing shortage is critical to the
country’s long-term growth prospects.
Requiring homeowners to amortise their mortgages,
which has also been on the agenda, will have a
sustainable, positive effect on our customer finances
and will benefit Sweden in the long term.
Global changes required greater cost efficiencies
Despite our strong profit, the banking sector is in a
tumultuous stage where low interest rates, regulatory
changes, technological developments and increased
competition are making it necessary to quickly adapt,
especially in the Swedish retail market. Cutting costs
through efficiencies when developing our offerings and
ensuring that the underlying processes our customers
rely on when using our services are as automated as
possible is critical in order to create sustainable value
for both our customers and shareholders. Our cost-
savings goals for 2014 remain firm. Costs will be held at
the same level as in 2013, excluding additional costs for
the acquisition of Sparbanken Öresund.
Michael Wolf
President and CEO
Swedbank – Interim report January-June 2014 Page 3 of 60
Table of contents
Page
Financial summary 4
Overview 6
Market 6
Important events during the quarter 6
Second quarter 2014 compared with first quarter 2014 6
Result 6
January-June 2014 compared with January-June 2013 8
Result 8
Credit and asset quality 9
Stress test – Capital Adequacy Process 2014 10
Funding and liquidity 10
Ratings 10
Capital and capital adequacy 11
Market risk 12
Operational risks 12
Other events 13
Events after 30 June 2014 13
Business segments
Swedish Banking 14
Large Corporates & Institutions 16
Baltic Banking 18
Group Functions & Other 20
Eliminations 22
Product areas 23
Financial information
Group
Income statement, condensed 28
Statement of comprehensive income, condensed 29
Key ratios 30
Balance sheet, condensed 31
Statement of changes in equity, condensed 32
Cash flow statement, condensed 33
Notes 33
Parent company 55
Signatures of the Board of Directors and the President 59
Review report 59
Contact information 60
More detailed information can be found in Swedbank’s fact book, www.swedbank.com/ir, under Financial information and
publications.
Swedbank – Interim report January-June 2014 Page 4 of 60
Financial summary
Income statement Q2 Q1 Q2 Jan-Jun Jan-Jun
SEKm 2014 2014 % 2013 % 2014 2013 %
Net interest income 5 521 5 483 1 5 409 2 11 004 10 762 2
Net commission income 2 813 2 693 4 2 525 11 5 506 4 913 12
Net gains and losses on financial items at fair value 773 345 296 1 118 853 31
Other income 1 348 799 69 749 80 2 147 1 533 40
Total income 10 455 9 320 12 8 979 16 19 775 18 061 9
Staff costs 2 901 2 437 19 2 391 21 5 338 4 749 12
Other expenses 2 018 1 789 13 1 735 16 3 807 3 420 11
Total expenses 4 919 4 226 16 4 126 19 9 145 8 169 12
Profit before impairments 5 536 5 094 9 4 853 14 10 630 9 892 7
Impairment of intangible assets 1 0 170 -99 1 170 -99
Impairment of tangible assets 69 135 -49 202 -66 204 287 -29
Credit impairments 30 -100 88 -66 -70 148
Operating profit 5 436 5 059 7 4 393 24 10 495 9 287 13
Tax expense 1 063 1 074 -1 913 16 2 137 1 889 13
Profit for the period from continuing operations 4 373 3 985 10 3 480 26 8 358 7 398 13
Profit for the period from discontinued operations, after tax -230 -27 -1 887 -88 -257 -2 277 -89
Profit for the period 4 143 3 958 5 1 593 8 101 5 121 58
Profit for the period attributable to the shareholders of
Swedbank AB 4 139 3 953 5 1 592 8 092 5 117 58
Income statement for the Group excluding Sparbanken
Öresund Q2 Q1 Q2 Jan-Jun Jan-Jun
SEKm 2014 2014 % 2013 % 2014 2013 %
Net interest income 5 473 5 483 0 5 409 1 10 956 10 762 2
Net commission income 2 795 2 693 4 2 525 11 5 488 4 913 12
Net gains and losses on financial items at fair value 775 345 296 1 120 853 31
Other income 872 799 9 749 16 1 671 1 533 9
Total income 9 915 9 320 6 8 979 10 19 235 18 061 7
Staff costs 2 461 2 437 1 2 391 3 4 898 4 749 3
Other expenses 1 757 1 789 -2 1 735 1 3 546 3 420 4
Total expenses 4 218 4 226 0 4 126 2 8 444 8 169 3
Profit before impairments 5 697 5 094 12 4 853 17 10 791 9 892 9
Impairment of intangible assets 1 0 170 -99 1 170 -99
Impairment of tangible assets 69 135 -49 202 -66 204 287 -29
Credit impairments 26 -100 88 -70 -74 148
Operating profit 5 601 5 059 11 4 393 27 10 660 9 287 15
Tax expense 1 200 1 074 12 913 31 2 274 1 889 20
Profit for the period from continuing operations 4 401 3 985 10 3 480 26 8 386 7 398 13
Profit for the period from discontinued operations, after tax -230 -27 -1 887 -88 -257 -2 277 -89
Profit for the period 4 171 3 958 5 1 593 8 129 5 121 59
Profit for the period attributable to the shareholders of
Swedbank AB 4 167 3 953 5 1 592 8 120 5 117 59
Cost/income ratio 0.43 0.45 0.46 0.00 0.44 0.45
Swedbank – Interim report January-June 2014 Page 5 of 60
Key ratios and data per share including
Sparbanken Öresund Q2 Q1 Q2 Jan-Jun Jan-Jun
2014 2014 2013 2014 2013
Return on equity, continuing operations, % 16.6 14.6 14.1 15.5 14.7
Return on equity, total operations, % 15.8 14.5 6.5 15.1 10.1
Earnings per share before dilution,
continuing operations, SEK 1)
3.96 3.62 3.16 7.58 6.73
Earnings per share after dilution,
continuing operations, SEK 1)
3.94 3.59 3.15 7.53 6.69
Cost/income ratio 0.47 0.45 0.46 0.46 0.45
Loan/deposit ratio, % 189 195 186 189 186
Common Equity Tier 1 capital ratio, %, Basel 3 2)
20.9 18.3 17.2 20.9 17.2
Tier 1 capital ratio, %, Basel 3 2)
22.1 19.4 18.6 22.1 18.6
Total capital ratio, %, Basel 3 2)
25.3 22.0 19.6 25.3 19.6
Credit impairment ratio, % 0.01 -0.03 0.03 -0.01 0.02
Share of impaired loans, gross, % 0.44 0.45 0.76 0.44 0.76
Total provision ratio for impaired loans, % 56 60 54 56 54
Balance sheet data including Sparbanken Öresund 30 Jun 31 Dec 30 Jun
SEKbn 2014 2013 % 2013 %
Loans to the public 1 323 1 265 5 1 246 6
Deposits and borrowings from the public 697 621 12 673 4
Shareholders' equity 108 110 -2 101 6
Total assets 2 052 1 824 12 1 886 9
Risk exposure amount, Basel 3 2)
407 441 -8 459 -11
1)
Including deduction of the preference share dividend, earnings per share for January-Jun 2013 were SEK 3.07 for total operations after dilution. The
calculations are specified on page 53.
2)
The capital ratios for 2013 are based on Swedbank knowledge of the new regulations at that point in time.
The key ratios are based on profit and shareholders’ equity attributable to shareholders of Swedbank.
Swedbank – Interim report January-June 2014 Page 6 of 60
Overview
Market
The global economic recovery is continuing, though at a
slower pace. North America and Europe are the
engines, while growth has slowed in most emerging
markets. Growth in China has stabilised, however, and
concerns about a sharp deceleration have diminished.
In the eurozone, the slow recovery is continuing, but
with considerable differences between countries.
The Swedish economy is generating solid growth. The
driver is domestic demand, primarily consumer
spending and construction investment. Exports are
being held in check by weak external demand. During
the first quarter GDP growth was 1.9 per cent. At the
same time recent economic indicators point to a
continued recovery in the Swedish economy.
Due to weak international growth and low resource
utilisation, global inflation is very low. To address the
risk of deflation, monetary policies in Europe and North
America have been highly expansive. The Riksbank and
the European Central Bank (ECB) both recently cut their
benchmark rates, and a further stimulus from the ECB
remains a possibility. Higher growth in the US is
allowing the Federal Reserve (Fed) to continue tapering
its bond buying, which is expected to come to an end
this autumn.
Long-term bond yields fell, mainly in Europe but also in
the US, despite the Fed’s reduced bond purchases. Low
global inflation, geopolitical uncertainty in Ukraine and
the Middle East, and expectations of continued low
interest rates are keeping pressure on yields. US short-
term yields have risen slightly of late, however.
Growth in the Baltic economies slowed during the first
quarter to 3.2 per cent in Lithuania, 2.8 per cent in
Latvia and turned negative in Estonia at -1.4 per cent.
With weak demand in major export markets, domestic
demand is again driving growth, though to varying
degrees. Investment was highest in Lithuania and
moderate in Estonia and Latvia. Household
consumption growth was also slightly faster in Lithuania,
but slowed down in all three countries. Exports started
to recover in Estonia and Latvia but fell in Lithuania in
early 2014 owing to problems in certain sectors. One
threat to growth in the Baltic countries is weaker
economic performance in key export markets, especially
in Finland and Russia. The biggest domestic risk stems
from the labour market. Productivity growth in the Baltic
countries has recently lagged behind wage growth,
especially in Estonia and Latvia, implying a rise in
labour costs. Rapid wage growth has not yet pushed
prices higher, however.
The Stockholm stock exchange (OMXSPI) gained 6 per
cent during the first half-year. The Tallinn stock
exchange (OMXTGI) fell by 1.9 per cent and the Riga
stock exchange (OMXRGI) by 2.6 per cent, while the
Vilnius stock exchange (OMXVGI) gained 11.9 per cent.
Important events during the quarter
During the first quarter Swedbank acquired Sparbanken
Öresund as a way of strengthening its market position in
its home markets. The Swedish Financial Supervisory
Authority approved the acquisition on 16 May and,
having received all the necessary approvals, the
acquisition was finalised on 20 May and the integration
process begun. Sparbanken Öresund affects
Swedbank’s profit as of 21 May to 30 June, as indicated
in the table below and throughout the report. The
financial effects are in line with the analysis conducted
at the time of acquisition, but with adjustments between
certain items. Integration costs in the form of
restructuring costs have been slightly higher than
previously estimated. At the same time greater surplus
values have been identified in the acquired business
and credit quality proved to be higher. As of the third
quarter the acquisition of Sparbanken Öresund will no
longer be shown separately in Swedbank’s financial
reports. Costs associated with the acquisition are
slightly higher than previously estimated and the
Group’s cost objective for 2014 have been adjusted to
SEK 17.7bn. Costs excluding Sparbanken Öresund will
be unchanged compared with 2013, in accordance with
previous guidance.
Impact of Sparbanken
Öresund Running
SEKm business One-offs Total
Net interest income 48 0 48
Net commission income 18 0 18
Net gains and losses on
financial items at fair value -2 0 -2
Other income 15 461 476
Total income 79 461 540
Staff costs 47 393 440
Other expenses 39 222 261
Total expenses 86 615 701
Credit impairments 4 0 4
Tax expense -2 -135 -137
Profit for the period
attributable to the
shareholders of
Swedbank AB -9 -19 -28
On 13 June Swedbank received approval from the
Swedish Financial Supervisory Authority to use the
advanced internal ratings-based (A-IRB) approach for
its corporate exposures in Sweden and Norway. This
reduced the risk exposure amount by SEK 72.9bn,
slightly more than previously estimated.
In early June Swedbank moved into its new head office
in Sundbyberg. The move will reduce costs and the
new, open-plan offices will encourage greater internal
cooperation. This will lead to efficiencies in the
development of new and better offerings for our
customers.
Second quarter 2014
Compared with first quarter 2014
Result
The quarterly result rose by 5 per cent to SEK 4 139m
(3 953). Income and expenses both increased.
Expenses, excluding the acquisition of Sparbanken
Öresund, were stable. Credit impairments were reported
during the quarter, compared with net recoveries during
the first quarter. Profit for continuing operations
amounted to SEK 4 369m (3 980). Discontinued
operations generated a loss of SEK 230m (-27), of
which SEK 223m is a cumulative negative exchange
rate difference that was reclassified to profit and loss
from other comprehensive income and relates to the
Swedbank – Interim report January-June 2014 Page 7 of 60
winding down of the Russian operations. This does not
affect equity or the 2014 dividend. Remaining equity in
the Russian operations amounts to SEK 212m, with
remaining negative FX differences of SEK 11m as of
30 June.
Profit before impairments increased by 9 per cent to
SEK 5 536m (5 094). Sparbanken Öresund reported a
loss before impairments of SEK 162m, excluding this
Swedbank’s profit increased by 12 per cent. Group
Treasury within Group Functions & Other and Swedish
Banking and Baltic Banking contributed to the increase,
while LC&I’s profit decreased from a high level.
Profit before
impairments
by business segment Q2 Q1 Q2
SEKm 2014 2014 2013
Swedish Banking
excl Sparbanken Öresund 3 198 2 979 2 924
Sparbanken Öresund -161 0 0
Large Corporates &
Institutions 1 141 1 277 1 091
Baltic Banking 975 885 838
Group Functions & Other 383 -5 55
Total excl FX effects 5 536 5 136 4 908
FX effects 0 -42 -55
Total 5 536 5 094 4 853
Credit impairments amounted to SEK 30m (net
recoveries 100). Swedish Banking and LC&I reported
low credit impairments, while Baltic Banking reported
continued net recoveries, albeit lower than in the
previous quarter.
Tangible asset writedowns decreased to SEK 69m (135)
and primarily relate to the writedown of Ektornet’s
property values, the large part of which is attributable to
the US.
The return on equity for continuing operations was
16.6 per cent (14.6). The cost/income ratio was 0.47
(0.45). Excluding Sparbanken Öresund the cost/income
ratio was 0.43.
Income increased by 12 per cent to SEK 10 455m
(9 320). Excluding Sparbanken Öresund income rose by
6 per cent. Sparbanken Öresund accounted for
SEK 540m. Net gains and losses on financial items at
fair value, net commission income and other income all
increased, while net interest income was stable.
Net interest income was stable in all business segments
at SEK 5 521m (5 483). Sparbanken Öresund
contributed SEK 48m. Lower market interest rates
affected Swedish Banking’s net interest income
negatively, while higher lending volumes in Swedish
Banking and LC&I contributed positively. The margin on
corporate lending within LC&I was stable, but increased
slightly in Baltic Banking. Mortgage margins for the
Swedish portfolio as a whole were stable, but increased
slightly at the end of the quarter.
Net commission income rose to SEK 2 813m (2 693).
Sparbanken Öresund accounted for SEK 18m. The
trend for Swedish Banking and Baltic Banking was
positive, while net commission income decreased within
LC&I. The increase in net commission income was
mainly due to higher income from cards and asset
management. Payment commissions increased due to
the reversal of a previous provision of SEK 35m in
Lithuania. Income from Corporate Finance remained
strong and was in line with the previous quarter.
Net gains and losses on financial items at fair value rose
to SEK 773m (345). Group Treasury, which accounted
for the largest increase, benefited from the positive
effects of falling interest rates, and also from lower
covered bond repurchases and a change in valuation of
SEK 80m related to a strategic shareholding. Net gains
and losses on financial items at fair value within LC&I
remained strong, in line with the first quarter. A negative
translation difference of SEK 74m was recognised
during the first quarter in Ektornet within Group
Functions & Other related to the depreciation of the
Ukrainian currency, the hryvnia.
Other income increased by 69 per cent to SEK 1 348m
(799). Sparbanken Öresund accounted for SEK 461m
due to a bargain purchase gain in connection with the
acquisition. During the second quarter one-off income of
SEK 230m was recognised in Share related to
associates for Entercard (see also page 24).
Expenses rose by 16 per cent to SEK 4 919m (4 226).
Expenses attributable to Sparbanken Öresund
amounted to SEK 701m, of which SEK 615m refers to
one-off expenses in connection with the acquisition.
Excluding Sparbanken Öresund expenses were stable
with slightly higher staff costs and marketing expenses.
SEK 57m (79) was expensed during the second quarter
related to the move of the head office to Sundbyberg.
Expense analysis
Group Q2 Q1 Q2
SEKm 2014 2014 2013
Swedish Banking
excl Sparbanken Öresund 2 491 2 443 2 392
Sparbanken Öresund 701 0 0
Large Corporates &
Institutions 804 834 834
Baltic Banking 621 623 628
Group Functions & Other and
eliminations 302 343 309
Total excl FX effects 4 919 4 243 4 163
FX effects 0 -17 -37
Total 4 919 4 226 4 126
The number of full-time employees increased during the
quarter due to the acquisition of Sparbanken Öresund.
Excluding Sparbanken Öresund the number of full-time
employees declined by 36.
The tax expense amounted to SEK 1 063m (1 074),
corresponding to an effective tax rate of 19.6 per cent
(21.2). The first quarter was negatively affected by non-
deductible property writedowns in the US and Ukraine.
The second quarter was positively affected by the
acquisition of Sparbanken Öresund. The bargain
purchase gain is not taxable.
Swedbank – Interim report January-June 2014 Page 8 of 60
January-June 2014
Compared with January-June 2013
Result
The result for the period increased by 58 per cent to
SEK 8 092m (5 117). Income and expenses both
increased, while credit impairments decreased.
Fluctuations in exchange rates, primarily the
depreciation of the Swedish krona against the euro and
the Lithuanian litas, increased profit by SEK 79m. The
result for continuing operations was SEK 8 349m
(7 394) and for discontinued operations was SEK -257m
(-2 277). During the first half-year 2013 SEK -1 875m
was reclassified to profit or loss from other
comprehensive income related to the sale of the
Ukrainian operations, compared with a corresponding
reclassification of SEK -223m during the first half of this
year for the winding down of the Russian operations.
Profit before impairments increased by 7 per cent to
SEK 10 630m (9 892). Profit increased in all business
segments as a result of higher income. Profit increased
the most in Baltic Banking. Expenses excluding
Sparbanken Öresund increased slightly compared with
the previous year.
Net recoveries of SEK 70m were recognised during the
first half-year 2014, compared with credit impairments of
SEK 148m a year earlier. Baltic Banking reported
recoveries, while Swedish Banking reported minor credit
impairments. Tangible asset writedowns amounted to
SEK 204m (287), a decrease attributable to Ektornet.
Intangible asset writedowns decreased to SEK 1m
(170). During the first half year 2013 internally
developed software was written down by SEK 170m.
Profit before
impairments
by business segment Jan-Jun Jan-Jun ∆
SEKm 2014 2013 SEKm
Swedish Banking
excl Sparbanken Öresund 6 177 5 903 113
Sparbanken Öresund -161 0 0
Large Corporates &
Institutions 2 406 2 165 241
Baltic Banking 1 833 1 565 268
Group Functions & Other 375 345 30
Total excl FX effects 10 630 9 978 652
FX effects 0 -86 86
Total 10 630 9 892 738
The return on equity for continuing operations was 15.5
per cent (14.7). The cost/income ratio was 0.46 (0.45).
Excluding Sparbanken Öresund the cost/income ratio
was 0.44.
Income rose by 9 per cent to SEK 19 775m (18 061).
Sparbanken Öresund’s income amounted to SEK 540m.
All business segments contributed to the higher income.
Stronger commission income contributed the most,
while other income excluding one-off effects decreased.
Changes in exchange rates increased income by
SEK 136m.
Net interest income rose by 2 per cent to SEK 11 004m
(10 762). In Baltic Banking, increased deposit volumes,
higher market interest rates and the repricing of
corporate lending all contributed positively. LC&I
improved the margins on its lending portfolio slightly,
and higher volumes also contributed positively. In
Swedish Banking, net interest income was stable; the
positive effects of the higher lending volumes were
offset by margin pressure on deposits. Fluctuations in
exchange rates increased net interest income by
SEK 72m.
Net commission income rose by 12 per cent to SEK
5 506m (4 913). Higher commission income from asset
management due to a favourable stock market climate
and net inflows contributed the most to the increase.
Corporate finance and loan-related income within LC&I
increased as well.
Net gains and losses on financial items at fair value
increased by 31 per cent to SEK 1 118m (853). Net
gains and losses on financial items at fair value within
Group Treasury in Group Functions & Other improved.
During the first half-year 2014 a change in the value of a
strategic shareholding had a positive effect of SEK 80m.
In 2013 the repurchase of government guaranteed
bonds affected net gains and losses negatively. Net
gains and losses on financial items at fair value within
LC&I improved slightly.
Other income increased by 40 per cent to SEK 2 147m
(1 533). The acquisition of Sparbanken Öresund during
the second quarter 2014 resulted in a bargain purchase
gain of SEK 461m. In Share of the profit or loss of
associates a one-off income of SEK 230m was
recognised for Entercard (see also page 24). Sales
activity within Ektornet was lower during the first half
year than in the previous year since the portfolio is now
significantly smaller. This negatively affected other
income. Expenses increased by 12 per cent to
SEK 9 145m (8 169). Excluding Sparbanken Öresund
expenses rose by 3 per cent. Expenses increased the
most within LC&I. Staff costs within the Group rose as a
result of a higher number of advisors and IT-related staff
as well as salary adjustments. IT development
expenses increased as well. Reduced cash handling
and the outsourcing of ATMs led to lower expenses for
transport and security. During the first half-year 2014
SEK 136m was expensed within Group Functions &
Other for the move of the head office, at the same time
that expenses for Ektornet continued to decrease.
Changes in exchange rates raised expenses by
SEK 51m.
Expense analysis
Group Jan-Jun Jan-Jun ∆
SEKm 2014 2013 SEKm
Swedish Banking
excl Sparbanken Öresund 4 934 4 791 844
Sparbanken Öresund 701 0 0
Large Corporates &
Institutions 1 638 1 557 81
Baltic Banking 1 228 1 241 -13
Group Functions & Other and
eliminations 644 631 13
Total excl FX effects 9 145 8 220 925
FX effects 0 -51 51
Total 9 145 8 169 976
The number of full-time employees increased year-on-
year by 331. Excluding the acquisition of Sparbanken
Öresund, the number of full-time employees decreased
by 117. Baltic Banking reduced the number of full-time
Swedbank – Interim report January-June 2014 Page 9 of 60
employees by 417. Ektornet (Group Functions & Other)
also reduced its number of employees. IT-related
personnel within Group Functions & Other and the
number of full-time employees within Swedish Banking
and LC&I increased.
The tax expense amounted to SEK 2 137m (1 889),
corresponding to an effective tax rate of 20.4 per cent
(20.3). The first half-year 2014 was negatively affected
by the new policy on profit distributions from the Baltic
operations. This means that about 60 per cent of profits
generated by the Baltic subsidiaries from 2014 and
going forward will be distributed to the parent company,
Swedbank AB. Profit in Estonia is not taxed until its
distribution. This means that deferred tax is already
recognised on the estimated distribution from Estonia,
even though it will not be paid out until the first quarter
2015. At the same time, tax was positively, affected by
approximately the same amount due to the acquisition
of Sparbanken Öresund. Profit posted from the bargain
purchase is not taxable.
Credit and asset quality
The quality of the Group’s credit portfolio remains high.
Lending increased during the quarter, mainly in private
mortgages and corporate lending in Sweden. Conditions
in the bank's home markets were good, with a further
reduction in impaired loans and low credit impairments.
Continued political tensions in Russia and Ukraine did
not affect the credit portfolio. The bank is carefully
monitoring developments and taking preventive steps
closely with customers with business connections in the
region. The Group’s direct credit exposure to Russia
has decreased during the year and as of 30 June was
SEK 0.9bn. The bank has no direct credit exposures to
Ukraine.
Swedbank’s lending increased by SEK 51.3bn or
4.2 per cent during the first half-year to SEK 1 266bn,
of which SEK 4.7bn is due to currency effects. Of the
increase, SEK 47bn related to the second quarter. In
Sweden, mortgage lending rose by SEK 16.7bn.
Corporate lending within Swedish Banking and LC&I
increased by a total of SEK 28.8bn. The highest activity
was in property management and telecoms. The
acquisition of Sparbanken Öresund increased lending
by SEK 16.5bn, of which SEK 5.0bn was private lending
and SEK 11.5bn was corporate lending. In Baltic
Banking, the lending portfolio increased slightly in
Estonia and Latvia, calculated in local currency, while
decreasing slightly in Lithuania.
The average loan-to-value ratio for Swedbank’s
mortgages in Sweden, based on property level, was
62.0 per cent as of 30 June (62.2 as of 31 December).
Households with a loan-to-value ratio of over 75 per
cent represent 16.1 per cent (16.3) of the portfolio. The
average loan-to-value ratio for new mortgages in
Sweden was 70.8 per cent (69.9) in 2014. Of new
mortgages granted in Sweden in the last 12 months,
56.4 per cent have a loan-to-value ratio over 70 per
cent. With respect to new lending in Sweden in the last
12 months, 92 per cent of households with a loan-to-
value ratio over 75 per cent are amortising. For the
Swedish portfolio as a whole, 74 per cent (74) of
households with a loan-to-value ratio over 75 per cent
are amortising. For the mortgage portfolio as a whole,
59 per cent (60) of households are amortising. The
average loan-to-value ratio in Baltic Banking was 79.8
per cent (84.9), while the ratio for new lending was 53.8
per cent in 2014.
Impaired loans fell during the year by SEK 1.2bn to
SEK 6.3bn and correspond to 0.50 per cent (0.55) of
total lending. The average provision ratio for impaired
loans was 37.1 per cent. In addition there is portfolio
provisions for unidentified impaired loans as an added
safety margin, producing a total provision ratio of 56.3
per cent (54). The acquisition of Sparbanken Öresund
increased impaired loans by SEK 0.3bn. In Baltic
Banking, impaired loans fell by SEK 0.2bn to
SEK 4.5bn, mainly due to the winding down of problem
loans from 2008-2009 and improved quality in the loan
portfolio. In Swedish Banking, impaired loans were
unchanged during the first half-year.
The share of Swedish mortgages past due by more than
60 days remained low at 0.08 per cent of the portfolio
(0.09). The share of impaired mortgages in Baltic
Banking fell. The share of mortgages past due by more
than 60 days was 0.6 per cent in Estonia (0.7), 6.8
per cent in Latvia (7.4) and 4.0 per cent in Lithuania
(4.4).
Impaired loans,
by business segment Q2 Q1 Q2
SEKm 2014 2014 2013
Swedish Banking 1 522 1 389 1 667
Large Corporates &
Institutions 279 159 1 167
Baltic Banking 4 511 4 700 7 277
Estonia 1 297 1 322 1 835
Latvia 1 837 1 929 3 586
Lithuania 1 377 1 449 1 856
Total 6 312 6 248 10 111
Net recoveries during the first half-year amounted to
SEK 70m (credit impairments of SEK 148m). The
recoveries mainly relate to the Baltic mortgage portfolio
and because several commitments are no longer
classified as impaired owing to continued positive macro
development. Credit impairments in Sweden remained
low. The second quarter included credit impairments of
SEK 30m, mainly related to new provisions for
anticipated credit impairments within Swedish Banking.
Baltic Banking reported continued recoveries, though at
a lower level.
Credit impairments, net
by business segment Q2 Q1 Q2
SEKm 2014 2014 2013
Swedish Banking 25 31 36
Large Corporates &
Institutions 21 -30 94
Baltic Banking -16 -101 -43
Estonia -25 -9 -36
Latvia 13 -65 18
Lithuania -4 -27 -25
Group Functions & Other 0 0 1
Total 30 -100 88
Repossessed assets amounted to SEK 1 558m on
30 June, a decrease of SEK 556m since 31 December
2013. Of these repossessed assets, Ektornet accounted
for SEK 1 382m, of which SEK 17m relates to shares
and participations. Ektornet’s property values were
written down by SEK 204m during the first half-year,
mainly related to Ukraine and the US, of which
SEK 66m was in the second quarter. The remaining
repossessed properties in Ukraine amounted to
SEK 122m on 30 June. On the same date the number of
Swedbank – Interim report January-June 2014 Page 10 of 60
properties, including apartments and suchlike, was 1
140 (1 366), of which 626 were in Latvia (783). For more
information on repossessed assets, see page 35 of the
fact book.
Stress test – Internal Capital Adequacy
Assessment Process 2014
Positive economic development in Swedbank’s home
markets in 2013 improved the starting values for the
scenario analysis within the Internal Capital Adequacy
Assessment Process (ICAAP) for 2014. As a
consequence of this and continued work to improve
credit quality, the results of the scenario analysis
demonstrate that Swedbank’s resilience to severe
circumstances has further improved compared with the
2013 ICAAP.
The selected recession scenario extends over five
years, the first three of which show negative growth and
high unemployment in Sweden, Estonia, Latvia and
Lithuania. The trigger is a deepening crisis in the
European banking sector, which creates uncertainty
about the solvency of major financial institutions.
Sweden is hit especially hard due to its dependency on
exports, and SEK appreciates against EUR. In the Baltic
countries, falling export demand weakens both
investment and consumption.
In the ICAAP scenario, net interest income drops by
7.5 per cent in 2014, mainly due to lower interest rates.
Cumulative credit losses throughout the five-year
scenario amount to SEK 25bn, with losses reaching
their highest, SEK 9bn, in 2015.
Swedbank’s capitalisation is strengthened throughout
the scenario period thanks to continued profits and
because the risk exposure amount is in line with or
lower than the starting point. The improvement does not
take into account measures by Swedbank’s executive
management, which would have further improved the
capitalisation.
Swedbank’s resilience in a stress scenario is confirmed
by both the Swedish Financial Supervisory Authority’s
stress tests and the Riksbank’s most recent stability
report. In the latter Swedbank’s capital ratios are the
least affected among major Swedish banks and it is the
best capitalised bank in terms of both its Common
Equity Tier 1 capital ratio and leverage ratio at the end
of the scenario period.
For more information on Swedbank’s scenario
simulation and its outcome, see page 63 in the fact
book.
Funding and liquidity
During the first half-year 2014 Swedbank issued a total
of SEK 69bn in long-term debt instruments, of which
SEK 49bn related to covered bonds and SEK 20bn to
senior unsecured debt. During the second quarter a
total of SEK 32bn in long-term debt instruments was
issued, including SEK 28bn in covered bonds and SEK
4bn in senior unsecured debt. Of the covered bonds,
SEK 20bn was issued in SEK during the quarter.
Demand for private placements remained high. For the
full-year 2014 Swedbank plans to issue a total of about
SEK 120bn to meet maturing long-term funding with a
nominal value of SEK 103bn. Liquidity over and above
the refinancing need is used in day-to-day management
to repurchase covered bonds.
The average maturity of all capital market funding
arranged through the bank’s short- and long-term
programmes was 29 months on 30 June 2014 (29 as of
31 December 2013). The average maturity of long-term
funding issued during the first half-year was 61 months.
The bank’s short-term funding is mainly used as a cash
management tool, not to finance the bank’s lending to
the public. Demand for Swedbank’s short-term debt
instruments remained high and the outstanding volume
of short-term funding increased by SEK 83bn during the
first half-year to SEK 184bn.
Swedbank left the government guarantee programme in
April 2010 and in May 2014 the last government
guaranteed bonds, issued in 2009, matured.
Swedbank’s liquidity reserve, which is reported in
accordance with the Swedish Bankers’ Association’s
definition and is managed by Group Treasury,
amounted to SEK 281bn on 30 June 2014 (243 as of 31
March). In addition to the liquidity reserve, liquid
securities in other parts of the Group amounted to SEK
52bn (59 as of 31 March). The liquidity reserve and
Liquidity Coverage Ratio (LCR) will fluctuate over time
depending, among other things, on the maturity
structure of the bank’s issued securities. The Group’s
LCR was 123 per cent on 30 June (144 as of 31 March).
Distributed by USD and EUR, LCR was 195 per cent
(312 as of 31 March) and 289 per cent (586 as of 31
March) respectively. In early 2013 the Basel Committee
published a new definition of LCR. According to
Swedbank’s interpretation, LCR would have been 132
per cent as of 30 June (163 as of 31 December).
According to Swedbank’s interpretation of the Basel
Committee’s latest proposed revisions to the definition
from January 2014, the Group’s Net Stable Funding
Ratio (NSFR) was 102 per cent (102 as of 31 March).
The main liquidity measure used by the Board of
Directors and executive management is the so-called
survival horizon, which shows how long the bank could
manage when access to new financing were limited. At
present the bank would survive more than 12 months
with the capital markets completely shut down. This
applies to the Group’s total liquidity as well as liquidity in
USD and EUR.
For more information on the above, see page 67 in the
fact book.
Ratings
On 29 April Standard & Poor's (S&P) revised its outlook
for the ratings of Swedbank and 50 European banks to
negative. The revision was a consequence of the EU
Parliament’s approval of the EU’s Bank Recovery and
Resolution Directive (BRRD). S&P felt the directive
increases the risk that investors in senior uncovered
debt will be forced to absorb losses if a bank incurs
financial problems. At the same time S&P raised
Swedbank’s individual rating, mainly against the
backdrop of the bank’s solid capitalisation. As a direct
result, the rating on Swedbank’s subordinated debt was
raised as well.
On 29 May Moody’s also revised its outlook on
Swedbank and a number of other European banks to
negative due to the BRRD.
Fitch revised its outlook for Swedbank’s rating to
positive on 24 June. The revision was a direct result of
Swedbank – Interim report January-June 2014 Page 11 of 60
the bank’s credit quality, stable earnings and strong
capitalisation.
Capital and capital adequacy
On 13 June Swedbank received approval from the
Swedish Financial Supervisory Authority to use the
advanced internal ratings-based (A-IRB) approach for
its corporate exposures in Sweden and Norway. This
positively affected the Common Equity Tier 1 ratio by
3.8 percentage points as of 30 June. During the quarter
the acquisition of Sparbanken Öresund was finalised as
well, reducing the Common Equity Tier 1 ratio by 0.8
percentage points. Including these effects, the Common
Equity Tier 1 ratio increased to 20.9 per cent on 30 June
(18.3 per cent on 31 March and 31 December 2013).
Common Equity Tier 1 capital increased by SEK 2.8bn
during the quarter to SEK 84.9bn. The change was
mainly due to the bank’s profit after deducting the
anticipated dividend. The revisions in the recognition of
pensions (IAS 19), effective 2013, create volatility in the
estimated pension liability, which also affects equity
through other comprehensive income. During the
second quarter the calculated pension liability rose by
about SEK 0.3bn, where the falling discount rate
increased the debt, while a revised inflation assumption
reduced it. See the note Statement of comprehensive
income for more information. Other increases in the
Common Equity Tier 1 capital include approximately
SEK 0.5bn due to the approval of A-IRB.
Change in Common Equity Tier 1 capital Basel 3, second
quarter 2014, Swedbank consolidated situation
80.8
84.9
0.3
1.0
4.6
-3.1
82.1
40
45
50
55
60
65
70
75
80
85
90
SEKbn
Increase Decrease
The risk exposure amount (REA) decreased by SEK
42.1bn during the second quarter to SEK 406.7bn on 30
June (448.8 as of 31 March). The REA for credit risks
decreased by SEK 43.5bn. The Swedish Financial
Supervisory Authority’s approval allowing Swedbank to
use A-IRB for corporate exposures reduced the REA by
SEK 72.9bn, while the acquisition of Sparbanken
Öresund and investments in Sparbanken Skåne
increased the REA for credit risks by SEK 14.9bn.
Increased exposures, mainly to corporate customers in
Swedish Banking and LC&I, raised the REA by
SEK 12.3bn. Positive rating migrations, mainly among
corporate customers in Swedish Banking, reduced the
REA by SEK 1.6bn. Fluctuations in exchange rates,
mainly attributable to the Baltic credit portfolio, raised
the REA for credit risks by SEK 0.7bn due to the
depreciation of the Swedish krona against the euro.
Other increases in the REA for credit risks include
reclassifications of exposures and adjustments owing to
the implementation of Basel 3.
The REA for credit valuation adjustment (CVA risk),
which arose in connection with the introduction of Basel
3, decreased by SEK 0.3bn during the second quarter.
The REA for market risks was essentially unchanged.
The REA for currency risks decreased by just over
SEK 1bn, while market risks within LC&I increased by a
corresponding amount. The REA for operational risks
increased by SEK 1.6bn, mainly due to the acquisition
of Sparbanken Öresund.
Change in REA Basel 3, second quarter 2014, Swedbank
consolidated situation
-72.9
16.3
12.3
-1.6 -1.4
0.7
4.7
-0.3
0.1 0.2
440.6
448.8
406.7
360
370
380
390
400
410
420
430
440
450
460
SEKbn
Increase Decrease
Certain aspects of the EU’s new capital adequacy rules
(based on Basel 3), which took effect on 1 January
2014, require introduction on a national basis. The new
Swedish legislation takes effect in August 2014, at
which point the Swedish Financial Supervisory Authority
will be authorised to decide on the final Swedish capital
requirements.
On 8 May the Swedish Financial Supervisory Authority
published a memo on the future capital requirements for
Swedish banks. The memo covered the capital
requirements for systemic risks for Sweden's four major
banks, considerations regarding the countercyclical
capital buffer and raising the risk weight floor for
Swedish mortgages. It also clarified the process for
Pillar 2. In a separate June memo, the Swedish
Financial Supervisory Authority proposed a
countercyclical buffer of 1.0 per cent for Swedish
exposures, which will be applied as of September 2015.
The Swedish Financial Supervisory Authority expects to
decide on the future capital requirements and activation
of the countercyclical buffer this autumn. In the Baltic
countries, no decision has yet been made whether to
activate the countercyclical buffer. Swedbank’s
aggregate countercyclical buffer, based on a
geographical distribution of its exposures, is estimated
at just over 0.7 per cent.
Not until the Swedish Financial Supervisory Authority
has detailed its future capital requirements, including
standardised models and capital requirements for Pillar
2, can the Board of Directors set a capital target.
The Swedish Financial Supervisory Authority’s
regulations adopted in June require companies to
Swedbank – Interim report January-June 2014 Page 12 of 60
publish their internal assessment of the capital
requirement. Given the proposal on standardised
models for Pillar 2 risks, this will not be introduced
before 1 January 2015, however, and will require
publication as of the first quarter 2015.
The previously announced risk weight floor of 15 per
cent for the Swedish mortgage portfolio within Pillar 2
does not affect the reported capital ratios. Based,
however, on an average risk weight of 4.2 per cent
according to Pillar 1 in Swedbank’s Swedish mortgage
portfolio on 30 June and the Swedish Common Equity
Tier 1 capital requirement of 12 per cent (as of 2015),
Swedbank will have to maintain additional Common
Equity Tier 1 capital of SEK 9.6bn for Swedish
mortgages. This corresponds to 2.4 percentage points
of the Common Equity Tier 1 ratio according to Pillar 1.
In its internal controls, Swedbank allocates capital to its
mortgage business equivalent to the risk weight floor.
The Swedish Financial Supervisory Authority’s intent to
further increase the risk weight floor, to 25 per cent, and
to include the countercyclical buffer in the calculation,
means that Swedbank has to maintain additional
Common Equity Tier 1 capital of SEK 20bn for its
Swedish mortgages, corresponding to 4.9 percentage
points of the Common Equity Tier 1 capital ratio
according to Pillar 1.
Swedbank’s leverage ratio was 4.3 per cent on 30 June
(4.5 per cent on 31 March 2014 and 4.6 per cent on 31
December 2013). The decrease is due to the acquisition
of Sparbanken Öresund and volume increases.
According to the EU’s rules, the measure will be
evaluated by the authorities prior to the possible
introduction of a minimum requirement in 2018.
An announcement in early July detailed how the BRRD
will be implemented in Swedish law from January 2015.
The new directive is complex and extensive, so it is
unlikely that the Swedish law can take effect as early as
1 January 2015. The portions concerning capital and
debt write-downs, “bail-ins”, will not be introduced until
2016. The purpose of the directive is to prevent crisis
situations, improve crisis management and reduce the
risk of taxpayers having to bear the cost of another
banking crisis.
Market risk
The majority of the Group’s market risks are of a
structural or strategic nature and are managed by Group
Treasury. Structural interest rate risks arise when the
maturity of the Group’s assets and liabilities, such as
deposits and lending, do not coincide. The risks are
managed within the given mandates by matching
maturities directly or using various derivatives such as
interest rate swaps. Net interest income sensitivity is
also affected by structural risks in the bank’s deposit
operations, where various products show different
sensitivity to changes in market interest rates. Strategic
currency risks arise primarily through risks tied to
holdings in foreign subsidiaries and their financing.
Market risks also arise in LC&I’s trading operations in
connection with customer transactions and by
maintaining a secondary market for various types of
securities.
Swedbank measures market risks with a Value-at-Risk
(VaR
1)
) model, among other things.
VaR by risk category
30 Jun 31 Dec
SEKm Max Min Average 2014 2013
Interest risk 87 (97) 66 (65) 78(80) 78 66
Currency rate risk 16 (17) 3 (2) 9 (7) 6 10
Stock price risk 12 (9) 1 (2) 4 (5) 3 3
Diversification 0 0 -13 (-16) -10 -13
Total 87 (89) 67 (59) 78 (76) 77 66
Jan-Jun 2014 (2013)
1)
The VaR model was supplemented during the year with new risk
factors, due to which the figures for 2014 are not directly comparable
with those for 2013.
For individual risk types, VaR is complemented by
various risk measures based on sensitivity to changes in
market prices. Risk taking is also monitored with stress
tests. An increase in all market interest rates of one
percentage point as of 30 June 2014 would have
increased the value of the Group’s assets and liabilities,
including derivatives, by SEK 286m (75 as of 31
December 2013). This calculation includes parts of the
bank’s deposits with a duration of two to three years.
The effect on positions in SEK would have been SEK
337m (250), while the value of positions in foreign
currency would have decreased by SEK 51m (-175).
The Group’s net gains and losses on financial items at
fair value would have been reduced by SEK 630m
(-608), with the biggest contributions coming from the
Group’s liquidity portfolio as well as the trading
operations within LC&I.
Operational risks
The number of IT incidents fell year-on-year. The bank’s
customers were affected by two major disruptions to the
Internet Bank and Telephone Bank, however. This is in
addition to brief disruptions in shared ATMs on five
separate occasions, which affected the affiliated banks’
Swedish card customers. All the disruptions were
considered serious and have been reported to the
Swedish Financial Supervisory Authority. Swedbank has
taken action to improve stability and ensure that its
customers are not affected again. The bank’s direct
losses attributable to operational risks remained low.
Swedbank – Interim report January-June 2014 Page 13 of 60
Other events
During the quarter Swedbank was nominated in the
annual IR Magazine Awards for European companies in
three categories: best Investor Relations (IR) in
Northern Europe, best IR by a CEO (large cap) and best
corporate governance and disclosure policy. Swedbank
CEO Michael Wolf won first prize for best IR by a CEO.
Swedbank also won an award for best IR in Sweden.
On 17 June the Swedish Competition Authority sued the
subsidiary Swedbank Franchise regarding its acquisition
of Svensk Fastighetsförmedling. The Competition
Authority is of the opinion that the acquisition will
impede competition. Swedbank does not share the
Competition Authority’s view of the effects of the
acquisition and feels that the Competition Authority
incorrectly considers franchisees to be subsidiaries of
Swedbank Franchise. Swedbank therefore welcomes an
impartial ruling by the courts. The legal process in the
district court is expected to be completed by 17
December.
Events after 30 June 2014
The Swedish Riksbank cut the repo rate by 0.50 basis
points to 0.25 per cent on 9 July.
Swedbank – Interim report January-June 2014 Page 14 of 60
Swedish Banking
 Increased corporate and mortgage volumes
 Positive stock market performance and increased fund savings strengthen commission income
 Acquisition of Sparbanken Öresund improves market position in southern Sweden
Income statement
Q2 Q1 Q2 Jan-Jun Jan-Jun
SEKm 2014 2014 % 2013 % 2014 2013 %
Net interest income 3 362 3 314 1 3 368 0 6 676 6 699 0
Net commission income 1 790 1 649 9 1 548 16 3 439 3 138 10
Net gains and losses on financial items at fair value 54 50 8 33 64 104 67 55
Share of profit or loss of associates 410 256 60 197 666 401 66
Other income 613 153 170 766 389 97
Total income 6 229 5 422 15 5 316 17 11 651 10 694 9
Staff costs 1 360 919 48 871 56 2 279 1 732 32
Variable staff costs 52 51 2 67 -22 103 115 -10
Other expenses 1 746 1 442 21 1 424 23 3 188 2 884 11
Depreciation/amortisation 34 31 10 30 13 65 60 8
Total expenses 3 192 2 443 31 2 392 33 5 635 4 791 18
Profit before impairments 3 037 2 979 2 2 924 4 6 016 5 903 2
Credit impairments 25 31 -19 36 -31 56 91 -38
Operating profit 3 012 2 948 2 2 888 4 5 960 5 812 3
Tax expense 563 640 -12 623 -10 1 203 1 254 -4
Profit for the period 2 449 2 308 6 2 265 8 4 757 4 558 4
Profit for the period attributable to the shareholders of
Swedbank AB 2 445 2 304 6 2 264 8 4 749 4 555 4
Non-controlling interests 4 4 0 1 8 3
Return on allocated equity, % 29.7 28.3 27.8 29.0 27.9
Loan/deposit ratio, % 246 250 243 246 243
Credit impairment ratio, % 0.01 0.01 0.02 0.01 0.02
Cost/income ratio 0.51 0.45 0.45 0.48 0.45
Loans, SEKbn 987 949 4 919 7 987 919 7
Deposits, SEKbn 401 379 6 378 6 401 378 6
Full-time employees 5 446 4 996 9 4 921 11 5 446 4 921 11
Development January - June
The result for the period amounted to SEK 4 749m
(4 555). Sparbanken Öresund is consolidated in
Swedbank’s accounts from the 21 May; see also page
6. Income and expenses both increased, while credit
impairments were stable.
Impact of Sparbanken
Öresund
Running
business One-offs Total
SEKm
Net interest income 48 0 48
Net commission income 18 0 18
Net gains and losses on
financial items at fair value -2 0 -2
Other income 15 461 476
Total income 79 461 540
Staff costs 47 393 440
Other expenses 39 222 261
Total expenses 86 615 701
Credit impairments 4 0 4
Tax expense -2 -135 -137
Profit for the period
attributable to the
shareholders of
Swedbank AB -9 -19 -28
Net interest income was stable compared with the
previous year. Higher volumes of deposits and lending
largely offset lower deposit margins, which were
adversely affected by declining market interest rates.
Net interest income was also stable compared with the
first quarter. Increased lending margins and slightly
improved mortgage margins at the end of the quarter
were offset by lower deposit margins.
Household deposit volumes increased by SEK 11bn
since the beginning of the year, with volumes from the
acquisition of Sparbanken Öresund accounting for
SEK 8bn. Swedbank’s share of household deposits was
21 per cent at the end of the period (21 per cent as of
31 December 2013). Corporate deposits within Swedish
Banking increased by SEK 5bn since the beginning of
the year, or by 5 per cent. Sparbanken Öresund
accounted for SEK 4bn. Swedbank’s market share,
including corporate deposits within LC&I, was 19 per
cent as of 31 May (18 per cent as of 31 December
2013).
Household mortgage lending volume increased by
SEK 17bn since the beginning of the year, of which
SEK 12bn during the second quarter. Swedbank’s share
of new sales continued to improve during the second
quarter. Its share of net growth, excluding Sparbanken
Öresund, was 22 per cent, compared with 18 per cent in
the first quarter. Swedbank’s share of the total market
Swedbank – Interim report January-June 2014 Page 15 of 60
was 25 per cent (25 per cent as of 31 December 2013).
Corporate lending volume increased by SEK 26bn since
the beginning of the year, with Sparbanken Öresund
accounting for SEK 11bn. Swedbank’s market share,
including corporate lending within LC&I, was stable at
18 per cent (17 per cent as of 31 December 2013).
Net commission income rose by 10 per cent compared
with the same period in 2013. The increase was mainly
due to higher fund volumes in the wake of stock market
gains and increased net inflows. Swedbank’s market
share in terms of assets under management was 23 per
cent (24 per cent as of 31 December 2013). Increased
lending and guarantee commissions as well as real
estate brokerage and equity trading revenue contributed
as well. Compared with the first quarter, net commission
income rose by 9 per cent mainly due to higher asset
management revenue.
The share of associates’ profit increased due to one-off
income of SEK 230m from the credit card company
Entercard after a distribution partner terminated their
collaboration and recalled their outstanding credit cards.
Other income was positively affected during the second
quarter by the acquisition of Sparbanken Öresund.
During the second quarter of 2014 a bargain purchase
gain of SEK 461m was recognised.
Expenses for the first half-year increased mainly due to
the acquisition of Sparbanken Öresund. Excluding
Sparbanken Öresund they rose by 3 per cent year-on-
year. Staff costs were higher due to an increase in
advisors and higher salary costs. Cash handling
expenses fell. Expenses for the second quarter,
excluding Sparbanken Öresund, were stable. In
connection with the acquisition SEK 591m was
expensed for a restructuring reserve covering, among
other things, system solutions and the divestment of
branches. Total one-off costs from the acquisition were
SEK 615m.
Credit quality remained good. Credit impairments
decreased compared with the previous year and remain
at the same level as in the first quarter. The share of
impaired loans was 0.15 per cent (0.16).
The risk exposure amount was SEK 179bn, a decrease
of SEK 10bn during the quarter. The Swedish Financial
Supervisory Authority’s approval of A-IRB for corporate
exposures reduced the risk exposure amount by
SEK 34bn. The acquisition of Sparbanken Öresund and
investments in Sparbanken Skåne increased the risk
exposure amount by SEK 16bn. Excluding these one-off
effects the risk exposure amount rose by SEK 7bn,
mainly as a result of increased corporate lending.
A number of services with new or improved functions
were launched in the bank's digital channels during the
quarter. One example is Swish for corporates, which
allows small companies, organisations and associations
to manage payment flows between consumers and
companies. A new payment terminal introduced for
small retailers and non-profits, Babs Micro, can accept
card payments without access to a fixed terminal. The
mobile terminal connects wirelessly by mobile phone.
Additional functions have been added to the Mobile
Bank as well, including an expense tracker that makes it
easier for private customers to manage their spending.
Use of Swedbank’s digital channels continues to grow.
The Internet Bank had 3.6 million users as of 30 June,
an increase of 44 000 during the year. The Mobile Bank
had 1.8 million (+204 000) and the iPad Bank had
466 000 (+81 000).
As of 30 June there were 1.4 million Swish users across
Swedish banks, an increase of 641 000 in 2014.
Swedbank and the savings banks’ share was 41.3 per
cent.
Card usage continues to increase. As of 31 May 2014
the total number of card purchases in stores had
increased by 10 per cent, and the aggregate value by 8
per cent, compared with the same period a year earlier.
Sweden is Swedbank’s largest market, with around 4 million private customers and more than 250 000 corporate
customers. This makes it Sweden’s largest bank by number of customers. Through our digital channels (Telephone Bank,
Internet Bank and Mobile Bank) and branches, and with the support of savings banks and franchisees, we are always
available. Swedbank is part of the local community. Our branch managers have the mandate to act in their local
communities. The bank’s presence and engagement are expressed in various ways. A project called “Young Jobs”, which
has created several thousand trainee positions for young people, has played an important part in recent years. Swedbank
has 320 branches in Sweden. The various product areas are described on page 23.
Swedbank – Interim report January-June 2014 Page 16 of 60
Large Corporates & Institutions
 High lending activity among large corporates
 Continued strong IPO earnings
 Good bond issuance activity
Income statement
Q2 Q1 Q2 Jan-Jun Jan-Jun
SEKm 2014 2014 % 2013 % 2014 2013 %
Net interest income 846 867 -2 851 -1 1 713 1 634 5
Net commission income 496 630 -21 522 -5 1 126 942 20
Net gains and losses on financial items at fair value 575 565 2 503 14 1 140 1 082 5
Other income 28 37 -24 49 -43 65 80 -19
Total income 1 945 2 099 -7 1 925 1 4 044 3 738 8
Staff costs 323 322 0 293 10 645 581 11
Variable staff costs 75 75 0 104 -28 150 192 -22
Other expenses 392 415 -6 427 -8 807 771 5
Depreciation/amortisation 14 22 -36 12 17 36 25 44
Total expenses 804 834 -4 836 -4 1 638 1 569 4
Profit before impairments 1 141 1 265 -10 1 089 5 2 406 2 169 11
Impairment of intangible assets 0 0 56 0 56
Impairment of tangible assets 0 0 0 0 0
Credit impairments 21 -30 94 -78 -9 168
Operating profit 1 120 1 295 -14 939 19 2 415 1 945 24
Tax expense 225 292 -23 257 -12 517 473 9
Profit for the period 895 1 003 -11 682 31 1 898 1 472 29
Profit for the period attributable to the shareholders of
Swedbank AB 895 1 003 -11 682 31 1 898 1 472 29
Return on allocated equity, % 23.1 26.9 14.4 24.8 15.6
Loan/deposit ratio, % 161 153 219 161 219
Credit impairment ratio, % 0.04 -0.06 0.17 -0.01 0.14
Cost/income ratio 0.41 0.40 0.43 0.41 0.42
Loans, SEKbn 157 152 3 151 4 157 151 4
Deposits, SEKbn 98 99 -1 69 42 98 69 42
Full-time employees 1 120 1 094 2 1 032 9 1 120 1 032 9
Development January - June
The result for the period amounted to SEK 1 898m, an
increase of 29 per cent year-on-year. The result was
positively affected by increased lending-related income
as well as income from IPOs and bond issues. The
long-term strategy to strengthen expertise in specific
industrial sectors and improve customer relations in
these areas has produced results in the form of
increased business and new customers during the year.
Net interest income increased by 5 per cent during the
first half-year compared with the same period in 2013.
Higher average lending volumes and origination fees
also contributed to the improvement. Margins in the
lending portfolio improved slightly. Lending volume was
4 per cent higher year-on-year, gaining SEK 6bn. Net
interest income fell by 2 per cent on a quarterly basis to
SEK 846m mainly due to lower origination fees on the
capital market side. Lending volumes increased by
SEK 5bn during the quarter thanks to a higher take-up
rate and higher sales, mainly in the real estate and
telecoms sectors. Lending activity among large
corporates was high due to the refinancing of maturing
loans. The lending margin on the entire loan portfolio
was stable compared with the first quarter, but with
continued pressure on new loan margins. Deposit
volumes were higher than in the same period in 2013
and stable against the previous quarter. The year-on-
year gain is a result of increased business with existing
customers and temporary deposit increases from a few
major customers.
Net commission income rose by 20 per cent to
SEK 1 126m compared with the first half-year 2013. The
current low interest rate environment and high stock
prices have led to increased activity among the bank’s
corporate customers, which increased income from
corporate finance and lending-related commissions.
Swedbank participated in five of nine IPOs in Sweden
during the first half-year, making it one of the two market
leaders. During the second quarter net commission
income fell by 21 per cent to SEK 496m, partly due to
one-off income and high bond-related income in Norway
in the first quarter. Bond issuance and IPO activity was
high as well during the second quarter, with continued
strong earnings. During the second quarter Swedbank
participated as advisor in Recipharm’s and Akelius’
listings on the Swedish stock exchange. Several major
bond issues were completed as well, including for
Hemfosa in Sweden and Harkand in Norway.
Swedbank’s market share for Swedish issues was 18.4
per cent in 2014 (19.4). The corresponding figure in
Norway was 17.6 per cent (16.6). This made Swedbank
the third largest player in Sweden and second largest in
Norway.
Swedbank – Interim report January-June 2014 Page 17 of 60
Net gains and losses on financial items at fair value
increased by 5 per cent to SEK 1 140m compared with
the first half-year 2013. The biggest contributor to the
increase came from bond and fixed income trading,
where customer activity was higher than in the same
period in 2013. Compared with the first quarter net gains
and losses on financial items were stable despite low
volatility in the financial markets, which led to slightly
lower customer activity.
Total expenses increased by 4 per cent to SEK 1 638m
compared with the same period in 2013. Staff costs rose
as a result of wage increases and because of a
conscious effort to expand advisory services for bond
issues and corporate finance. The development of new
products as well as IT investments in the wake of
increased regulatory requirements raised expenses for
IT and IT-related personnel. Compared with the
previous quarter expenses decreased by 4 per cent.
Credit quality in the loan portfolio has remained good.
Net recoveries of SEK 9m were reported during the
quarter, compared with credit impairments of SEK 168m
in the same period in 2013. The share of impaired loans
was 0.11 per cent (0.49).
The risk exposure amount decreased by SEK 32bn
during the quarter to SEK 117bn. The risk exposure
amount for credit risk decreased by SEK 33bn. The
transition to A-IRB for corporate exposures accounted
for SEK 39bn of the decrease. Excluding A-IRB the risk
exposure rose by SEK 6bn, mainly as a result of
increased lending.
Large Corporates & Institutions is responsible for Swedbank’s offering to customers with revenues above SEK 2 billion
and those whose needs are considered complex due to multinational operations or a need for sophisticated financing
solutions. The business segment is also responsible for developing corporate and capital market products for other parts
of the bank and the Swedish savings banks. LC&I works closely with customers, who receive advice on decisions that
create sustainable profits and sustainable growth in the long-term. The business segment has around 1 100 employees at
branches in Sweden, Norway, Estonia, Latvia, Lithuania, Finland, Luxembourg, China and the US.
Swedbank – Interim report January-June 2014 Page 18 of 60
Baltic Banking
 Solid financial results and good business activity
 High cost efficiency
 No impact from conflict between Russia and Ukraine
Income statement
Q2 Q1 Q2 Jan-Jun Jan-Jun
SEKm 2014 2014 % 2013 % 2014 2013 %
Net interest income 894 874 2 763 17 1 768 1 505 17
Net commission income 522 429 22 445 17 951 833 14
Net gains and losses on financial items at fair value 62 53 17 72 -14 115 134 -14
Other income 118 109 8 98 20 227 188 21
Total income 1 596 1 465 9 1 378 16 3 061 2 660 15
Staff costs 193 187 3 197 -2 380 394 -4
Variable staff costs 19 20 -5 9 39 27 44
Other expenses 374 364 3 355 5 738 696 6
Depreciation/amortisation 35 36 -3 33 6 71 66 8
Total expenses 621 607 2 594 5 1 228 1 183 4
Profit before impairments 975 858 14 784 24 1 833 1 477 24
Impairment of intangible assets 1 0 0 1 0
Impairment of tangible assets 3 -5 2 50 -2 6
Credit impairments -16 -101 -84 -43 -63 -117 -113 4
Operating profit 987 964 2 825 20 1 951 1 584 23
Tax expense 158 137 15 67 295 127
Profit for the period 829 827 0 758 9 1 656 1 457 14
Profit for the period attributable to the shareholders of
Swedbank AB 829 827 0 758 9 1 656 1 457 14
Return on allocated equity, % 15.6 15.2 13.4 15.3 12.7
Loan/deposit ratio, % 99 101 108 99 108
Credit impairment ratio, % -0.06 -0.34 -0.15 -0.20 -0.20
Cost/income ratio 0.39 0.41 0.43 0.40 0.44
Loans, SEKbn 122 118 3 119 3 122 119 3
Deposits, SEKbn 122 117 4 110 11 122 110 11
Full-time employees 3 822 3 853 -1 4 239 -10 3 822 4 239 -10
Development January - June
Profit for the first half-year amounted to SEK 1 656m
(1 457) and the return on allocated equity reached 15.3
per cent (12.7). The increase was mainly due to higher
income, while expenses and recoveries were about the
same level year-on-year. The ongoing conflict between
Russia and Ukraine has affected profits.
Net interest income increased by 12 per cent in local
currency compared with the first half-year 2013.
Increased deposit volumes, higher Euribor rates and
repricing affected net interest income positively. The
repricing of corporate loans to reflect the higher costs of
capital and regulatory changes will continue throughout
2014. Fluctuations in exchange rates increased net
interest income by SEK 84m. Net interest income in
local currency were more or less unchangedin a
comparison of the first and second quarters.
Lending volumes decreased by 1 per cent in local
currency compared with 31 December 2013. This was
mainly due to portfolio amortisations and lower new
sales during the first quarter. The decrease came from
corporate lending and private mortgages, while
consumer finance increased. Lending portfolios
decreased in Estonia and Latvia, but increased in
Lithuania. During the second quarter the Baltic loan
portfolio increased slightly. Swedbank’s market share
for lending was 29 per cent as of 31 March (28 as of 31
December 2013).
Deposit volumes in local currency were stable during
the first half-year. Deposits increased in Estonia and
Lithuania, but decreased in Latvia as more cash than
usual was deposited in the fourth quarter 2013 ahead of
the country’s euro transition on 1 January 2014.
Swedbank’s market share in deposits was 29 per cent
as of 31 March (28 per cent as of 31 December 2013).
The loan-to-deposit ratio was 99 per cent (100 per cent
as of 31 December 2013).
Net commission income rose by 9 per cent in local
currency compared with the first half-year 2013. The
improvement was mainly due to increased customer
activity, as reflected by higher card related income, as
well as growing asset management volumes following
the stock market’s positive performance. The number of
active customers increased by 40 000 since 30 June
2013 to 2.6 million. During the second quarter one-off
income of SEK 35m was recognised for a previous fine
levied on the Lithuanian operations in the fourth quarter
2012, which was reversed on appeal. Net commission
income was negatively affected by about SEK 40m due
to the euro transition in Latvia, which resulted in fewer
international payments. Compared with the first quarter
net commission income rose by 19 cent in local
currency, mainly due to a one-off income in Lithuania
and seasonally higher card and payment commissions.
Swedbank – Interim report January-June 2014 Page 19 of 60
Net gains and losses on financial items at fair value
decreased by 19 per cent in local currency compared
with the first half-year 2013. The decrease was mainly
due to lower income from the Latvian FX trading
business of SEK 36m as a result of the euro transition.
Other income for the first half-year increased by 16 per
cent in local currency compared with the same period in
2013 due to higher insurance-related income and a VAT
refund on transfer pricing of invoices in Latvia.
Total expenses decreased by 1 per cent in local
currency year-on-year, mainly due to lower expenses for
staff, premises and marketing. The number of full time
employees on 30 June was 10 per cent lower than a
year earlier. At the same time the number of branches
has been reduced by 11 to 174 in the last 12 months, of
which 36 are now cash-smart branches with a focus on
advisory services. The cost-income ratio improved
during the first half-year to 0.40 (0.44).
Net recoveries amounted to SEK 117m, compared with
SEK 113m in the first six months of 2013. All three
countries reported recoveries. Swedbank is taking
preventive measures to help its customers affected by
the current geopolitical situation. No major spillover
effects have been observed as yet on business activity
or our customers’ finances.
Impaired loans continued to decrease in all three
countries during the first half-year to SEK 4.5bn (5.0 as
of 31 December 2013). Credit quality has improved to
such a level that the decrease in impaired loans is
expected to be moderate in 2014 compared with the last
two years.
The risk exposure amount rose by SEK 2bn during the
quarter to SEK 83bn. The whole increase is related to
credit risk, the majority of which is attributable to
increased corporate and FX exposures. At the same
time the Swedish Financial Supervisory Authority’s
approval to update the risk classification models for
retail customers and small businesses contributed to a
reduction in the risk exposure amount.
Lithuania is preparing to adopt the euro on 1 January
2015. A formal decision will be made at the end of July
2014. The likelihood of approval is considered high
since the relevant EU institutions have already
supported Lithuania’s euro adoption. The bank’s
expenses related to the euro transition in Latvia and
Lithuania are estimated at SEK 84m in 2014, of which
SEK 27m has been recognised during the first half-year.
In 2014 Swedbank adopted a new policy on profit
distributions from the Baltic operations, whereby around
60 per cent of earnings generated in the Baltic
subsidiaries as of 2014 will be distributed to the parent
company, Swedbank AB. Profit in Estonia is not taxed
until its distribution, which means that deferred tax is
now recognised on the estimated distribution from
Estonia, even though it will not be paid until the first
quarter 2015. For the first half-year 2014 deferred tax of
SEK 102m has been recognised for future distributions.
In brand reputation surveys in Estonia and Latvia during
the second quarter Swedbank ranked first among
financial institutions and number two among all
companies.
Swedbank is the largest bank by number of customers in Estonia, Latvia and Lithuania, with around 4 million private
customers and more than 250 000 corporate customers. According to surveys, Swedbank is also the most respected
company in the financial sector. Through its digital channels (Telephone Bank, Internet Bank and Mobile Bank) and
branches, the bank is always available. Swedbank is part of the local community. Its local social engagement is
expressed in many ways, with initiatives to promote education, entrepreneurship and social welfare. Swedbank has 50
branches in Estonia, 54 in Latvia and 70 in Lithuania. The various product areas are described on page 23.
Swedbank – Interim report January-June 2014 Page 20 of 60
Group Functions & Other
Income statement
Q2 Q1 Q2 Jan-Jun Jan-Jun
SEKm 2014 2014 % 2013 % 2014 2013 %
Net interest income 419 424 -1 425 -1 843 921 -8
Net commission income -14 -31 -55 -10 40 -45 -37 22
Net gains and losses on financial items at fair value 82 -323 -312 -241 -430 -44
Share of profit or loss of associates 0 0 0 0 2
Other income 249 322 -23 321 -22 571 621 -8
Total income 736 392 88 424 74 1 128 1 077 5
Staff costs 819 810 1 798 3 1 629 1 585 3
Variable staff costs 60 53 13 52 15 113 123 -8
Other expenses -615 -553 11 -575 7 -1 168 -1 162 -1
Depreciation/amortisation 89 90 -1 93 -4 179 188 -5
Total expenses 353 400 -12 368 -4 753 734 3
Profit before impairments 383 -8 56 375 343 9
Impairment of intangible assets 0 0 114 0 114
Impairment of tangible assets 66 140 -53 200 -67 206 281 -27
Credit impairments 0 0 1 0 2
Operating profit 317 -148 -259 169 -54
Tax expense 117 5 -34 122 35
Profit for the period from continuing operations 200 -153 -225 47 -89
Profit for the period from discontinued operations, after tax -230 -27 -1 887 -88 -257 -2 277 -89
Profit for the period -30 -180 -83 -2 112 -99 -210 -2 366 -91
Profit for the period attributable to the shareholders of
Swedbank AB -30 -181 -83 -2 112 -99 -211 -2 367 -91
Non-controlling interests 0 1 0 1 1 0
Full-time employees 4 294 4 327 -1 4 159 3 4 294 4 159 3
Development January - June
Income for Group Functions & Other consists of net
interest income and net gains and losses on financial
items, which mainly come from Group Treasury. Other
income primarily consists of revenue from the savings
banks as well as sales revenue and operating income
from Ektornet. Income amounted to SEK 1 128m
(1 077). Net gains and losses on financial items at fair
value within Group Treasury improved due to a
SEK 80m change in the value of a strategic
shareholding. In 2013 an offer to repurchase
government guaranteed bonds negatively affected net
gains and losses. During the first quarter 2014 negative
FX effects of SEK 74m were recognised in Ektornet
related to the depreciation of the Ukrainian hryvnia.
Other income included a property sale in Russia during
the first quarter, which positively affected other income
by SEK 83m. Sales activity within Ektornet has slowed
since the portfolio has already been largely sold off,
which has reduced other income.
Expenses for Group Functions & Other increased by
3 per cent to SEK 753m (734) compared with the same
period in 2013. Excluding the net of services purchased
and sold internally, expenses increased by 5 per cent to
SEK 3 508m (3 340). The increase was mainly due to
one-off expenses of SEK 136m in connection with the
move of the head office and higher IT development
expenses and staff costs. This was partly offset by lower
expenses in Ektornet, where property management
expenses are dropping as the portfolio is divested.
Ektornet’s property values were written down by
SEK 204m (281). The writedowns related to Ukraine
and the US.
Group Products
Swedbank’s product operations, Group Products (GP),
are centralised at the Group level to create a more
responsive and customer-driven product range and an
efficient product organisation. Consisting of around
1 800 employees in Sweden, Estonia, Latvia and
Lithuania, GP is responsible for a large part of
Swedbank’s product areas. It is also tasked with
supporting the business areas by reducing the
complexity of the product range and simplifying sales in
the various distribution channels. The product areas that
GP is responsible for – lending and deposits, payments,
cards, asset management and insurance – are
described in more detail starting on page 23. GP also
comprises the subsidiary Swedbank Franchise AB,
which in turn includes the real estate (Fastighetsbyrån
and Svensk Fastighetsförmedling) and business
brokerages (Företagsförmedling) and a legal service
provider (Juristbyrån).
In GP’s revenue and expense model, revenue from
Swedbank’s customers is posted by each business
segment and GP receives compensation from them to
cover its expenses. GP’s external revenue largely
comes from the savings banks.
Expenses, excluding the net of services purchased and
sold internally, amounted to SEK 1 682m (1 603) for the
first half-year. The cost increase was mainly due to IT
operations and development, marketing and
depreciation/amortisation.
Swedbank – Interim report January-June 2014 Page 21 of 60
Group Treasury
Group Treasury is responsible for the bank’s funding,
liquidity and capital planning. The Group’s equity is
allocated to each business segment on the basis of
capital adequacy rules and how much capital is needed
based on the bank's Internal Capital Adequacy
Assessment Process (ICAAP). Group Treasury prices
all internal deposit and loan flows in the Group through
internal interest rates, where the most important
parameters are maturity, interest fixing period, currency
and need for liquidity reserves.
Group Treasury’s result over time should be nearly nil,
with the exception of earnings that may arise in debt
and liquidity management within given risk mandates.
Risk hedging by Group Treasury is generally achieved
with financial instruments. The volatility in results over
time is largely due to accounting-based fluctuations in
these hedges.
Net interest income for the first half-year 2014
decreased to SEK 904m (990). The positive effects of
repurchases were greater in 2013. In the second quarter
2013 net interest income was stable.
Net gains and losses on financial items at fair value for
the first half-year 2014 amounted to SEK -166m,
compared with SEK -462m in the same period in the
previous year. The main reason for the negative net
result is the impact of covered bond repurchases, which
have a corresponding positive effect on net interest
income over time. Net gains and losses on financial
items at fair value for the second quarter 2014 was
SEK 81m, compared with SEK -247m for the first
quarter. A change in value related to a strategic
shareholding positively affected net gains and losses on
financial items at fair value by SEK 80m in the second
quarter. The second quarter also benefits from the
positive effects of falling interest rates and lower
negative effects due to lower repurchase volumes
compared with the first quarter.
Russia
The Russian operations are reported since 2013 as
discontinued operations. The result for the first half-year
for discontinued operations was SEK -257m (-2 277). In
the first half-year 2013 the Ukrainian operations were
included in discontinued operations and affected the
result by SEK -2 236m. When the Ukrainian operations
were sold in the second quarter 2013, SEK -1 875m
was reclassified to profit or loss from other
comprehensive income. A corresponding reclassification
of SEK -223m was made during the second quarter
2014 for the winding down of the Russian operations.
Remaining equity in the Russian operations amounts to
SEK 212m, with remaining negative FX differences of
SEK 11m as of 30 June.
Swedbank’s net lending in Russia (including leasing)
amounted to SEK 0.9bn as of 30 June. The lending
portfolio in Russia, mainly consisting of good quality
corporate loans, will decrease as customers amortise
their loans.
Group Functions & Other consists of centralised business support units: Group Products, Group Staffs, and the
remaining operations in Russia. Group staffs, comprise Accounting & Finance (including Group Treasury and
Communication), Risk, IT, Compliance, Public Affairs, HR and Legal, operate across business areas and serve as
strategic and administrative support.
Swedbank – Interim report January-June 2014 Page 22 of 60
Eliminations
Income statement
Q2 Q1 Q2 Jan-Jun Jan-Jun
SEKm 2014 2014 % 2013 % 2014 2013 %
Net interest income 0 4 2 4 3 33
Net commission income 19 16 19 20 -5 35 37 -5
Net gains and losses on financial items at fair value 0 0 0 0 0
Other income -70 -78 10 -86 19 -148 -148 0
Total income -51 -58 12 -64 -20 -109 -108 -1
Staff costs 0 0 0 0 0
Variable staff costs 0 0 0 0 0
Other expenses -51 -58 12 -64 -20 -109 -108 -1
Depreciation/amortisation 0 0 0 0 0
Total expenses -51 -58 12 -64 -20 -109 -108 -1
Group eliminations mainly consist of eliminations of internal transactions between Group Functions and the other
business segments.
Swedbank – Interim report January-June 2014 Page 23 of 60
Product areas
Swedbank is a market leader in a number of its product areas, including asset management, cards, payments and
mortgage lending. Responsibility for the product units rests with Group Products (Group Functions & Other), but the
results are reported in several legal units and in the three business segments.
Lending/deposits
Lending products account for about 62 per cent of
Swedbank’s assets on the balance sheet. Swedbank’s
lending operations are concentrated in Sweden,
Estonia, Latvia, Lithuania and Norway.
Swedbank’s total lending to private customers and
corporations amounted to SEK 1 266bn (1 215 as of 31
December 2013). Household lending is the largest part,
with mortgages to private customers and tenant-owner
associations in Sweden accounting for about 57 per
cent. Swedbank’s market share for mortgages in
Sweden is 25 per cent. Over one million customers
obtain their mortgages through Swedbank Mortgage,
and lending is geographically spread throughout the
country.
Swedbank is also a major player in corporate lending in
Sweden, with lending of SEK 359bn and a market share
of 18 per cent as of 30 June (17 per cent as of 31
December 2013). Major sectors in Sweden include
property-related lending, which accounts for
SEK 186bn, and the forestry and agricultural sector,
which accounts for SEK 71bn and where Swedbank has
a dominant position. Swedbank is the largest lender in
the Baltic countries, with market shares of 17-34 per
cent. Estonia accounts for nearly half of Swedbank’s
Baltic loan portfolio, and there Swedbank has a market
share of over 34 per cent. Total lending in the Baltic
countries amounts to SEK 122bn, half of which is to
households and half to companies. Major sectors for
corporate lending in the Baltic countries include
commercial real estate and manufacturing.
Swedbank is also a major player in deposits in its home
markets. Total deposit volumes as of 30 June amounted
to SEK 669bn (599), of which SEK 357bn (341) was to
private customers and SEK 312bn (258) to corporate
customers. Just over 73 per cent of Swedbank’s total
deposit volumes is in Sweden.
For more information on Swedbank’s lending and
deposits, see each business segment.
Payment operations
Swedbank is a leader in payment and cash
management products in its four home markets. Growth
in the payment area is based on economic growth and
on customers’ increasing use of payment means other
than cash.
The payment area is strongly affected by changes in the
operating environment. Rapid technological
developments are creating a challenge in the form of
increased competition, especially from e-commerce
companies. Swedbank is well prepared in this regard in
terms of infrastructure, economies of scale and its long
history of strong consumer protection, an important
factor as e-commerce grows. Over time regulatory
changes will increase competition in selected parts of
the payment area, which will have to be addressed
mainly with cost efficiencies.
A growing share of customers is managing their
payments digitally. Today over 3 million of the bank’s
customers in Sweden and 2.2 million in the Baltic
countries have access to payment services through the
Internet Bank and the Mobile Bank. The number of
transactions through these channels grew by 14.9 per
cent during the first half of 2014 year-on-year. Users of
Mobile BankID, which facilitates online and mobile
payments, are steadily increasing in number and now
number over 1 070 000, compared with 460 000 on 30
June 2013.
Users of Swish, a solution for mobile payments shared
with other Swedish banks, are also increasing and at
the end of the quarter amounted to 1.4 million. The
service will remain free for Swedbank’s private
customers. In June 2014 a commercial version of Swish
was launched to allow small businesses, associations
and organisations to accept payments from individuals.
Payments Jan-Jun Jan-Jun
Income, SEKm 2014 2013 %
Net commission income 491 512 -4
of which Nordic countries 206 271 -24
of which Baltic countries 286 241 19
Net commission income for the first half of 2014 was 4
per cent lower year-on-year. The outsourcing of ATMs
to Bankomat AB reduced the net commission income by
SEK 56m, while a repayment of SEK 35m from the
Lithuanian competition authority increased it. Excluding
these items net commission income was stable. In the
Nordic region the decrease was 3 per cent while it
increased by 4 per cent in the Baltic countries.
Commission income increased due to higher volumes of
domestic payments in the Nordic region (12 per cent)
and the Baltic countries (10 per cent), while commission
expenses were unchanged or lower as a result of
proactive measures to reduce them. Commission
income from international payments increased by 5 per
cent in the Nordic region, but decreased by 19 per cent
in the Baltic countries due to the euro adoption in
Latvia.
Payments Jan-Jun Jan-Jun
Key figures 2014 2013 %
International payments (million) 5.1 4.9 4
of which Sweden 2.3 2.2 5
of which Baltic countries 2.8 2.7 4
Domestic payments (million) 1)
442.1 421.5 5
of which Sweden 329.1 312.1 5
of which Baltic countries 113.0 109.4 3
E-services payments (million) 2)
150.8 89.5 68
of which Sweden 132.4 78.4 69
of which Baltic countries 18.3 11.1 65
Factoring portfolio, SEKm 4 301 4 446 -3
of which Sweden 2 255 2 238 1
of which Baltic countries 2 046 2 208 -7
1)
Domestic payments include salary and mass payments, giro
payments, direct debit payments, internet payments.
2)
E-services payments include e-invoices, bank link payments, mobile
phone top-up transactions, number of signed transactions and ID
transactions through E-ID/BankID.
Swedbank – Interim report January-June 2014 Page 24 of 60
Card business
Swedbank issues cards to the public and acquires card
payments from merchants in all its home markets as
well as in Denmark and Norway. When one of its cards
is used to pay in a store, Swedbank, as the issuer,
receives a commission from the merchant’s payment
acquirer. Conversely, Swedbank pays a commission to
the card issuer when it acquires card payments from
merchants. The payment acquisition business was
recently expanded to Finland. The credit card
operations in Sweden, Denmark and Norway are
managed by Entercard AB, a joint venture with Barclays
Bank. Swedbank owns 50 per cent of Entercard. Other
card business takes place within the bank. Swedbank’s
aggregate market share for the card business in its
home markets is about 50 per cent.
Swedbank is Europe’s fifth largest card payment
acquirer based on number of transactions. In this
capacity, Swedbank enables retailers to accept payment
through card terminals and online. Revenue mainly
comes from the transaction fees retailers pay for access
to infrastructure, administration, risk hedging and
payment guarantees. As a payment acquirer, Swedbank
incurs expenses for the above-mentioned commissions
to card issuers as well as for operations and service.
Rapidly expanding e-commerce is an important growth
area for Swedbank. For retailers, the bank offers e-
commerce solutions as a complement to other payment
solutions. Swedbank’s payment acquisition volume in e-
commerce has increased by just over 100 per cent
since the first half-year 2013.
In April Swedbank launched Babs Micro, a mobile
based payment terminal that allows small businesses
and associations to accept card payments by mobile
phone without needing access to a fixed terminal.
Swedbank is the eleventh largest debit card issuer in
Europe based on number of transactions. Sweden is
among the countries in the world with the highest levels
of card usage. Nearly 80 per cent of retail purchases are
made by card at the same time that the number of cash
withdrawals through ATMs is decreasing. As a card
issuer, Swedbank generates revenue from cardholders
in the form of annual fees, currency exchange fees and
interest when credit is utilised. Transaction growth for
Swedbank’s cards in Sweden exceeded 10 per cent in
the last year. The percentage of card transactions is
high in Estonia as well (55 per cent), with an annual
growth rate of about 9 per cent. In Latvia and Lithuania,
card usage is lower, but the growth rate is expected to
be higher than in Sweden. In card issuance in the
bank’s home markets the biggest growth opportunities
are in corporate cards, where Swedbank has historically
been weaker and where the large number of small
business customers offers significant potential.
Card related income Jan-Jun Jan-Jun
SEKm 2014 2013 %
Total income, SEKm 1 746 1 437 22
of which Nordics 845 829 2
of which Baltic countries 392 347 13
of which Entercard1)
510 261 95
1)
Swedbank's share of the profit or loss of the associate Entercard.
Total card income increased by 22 per cent year-on-
year. Entercard reported one-off income during the
second quarter after a distribution partner in Norway
terminated their partnership, which positively affected
Sweden’s income by approximately SEK 230m. As a
result, Entercard’s credit volumes decreased by
approximately SEK 25 per cent.
In the Nordic region income was flat. The transaction
volume in payment acquisitions increased by 9 per cent,
while the corresponding increase for bank card
transactions was 11 per cent. The increased transaction
volumes produced higher issuance income, while the
margins in payment acquisitions are under pressure.
In the Baltic countries, card issuance income is growing
thanks to improved margins and increased card usage,
primarily in Latvia and Lithuania.
Jan-Jun Jan-Jun
Key ratios, cards 2014 2013 %
Acquired transactions, million 935 850 10
of which Nordics 793 718 10
of which Baltic countries 141 132 7
Acquired volumes, SEKbn 227 208 9
of which Nordics 207 190 9
of which Baltic countries 20 18 15
Issued cards, millon 7.7 7.8 -1
of which Nordics 3.9 3.9 0
of which Baltic countries 3.9 3.9 -2
Number of card purchases, million 634 570 11
of which Nordics 468 425 10
of which Baltic countries 166 145 14
Asset management business
Asset management operations are conducted through
the Swedbank Robur group in Swedbank’s four home
markets and in Norway. In total, Swedbank Robur offers
around 140 funds as well as discretionary asset
management. Fund assets under management
amounted to SEK 666bn (561) on 30 June, of which the
Swedish operations accounted for SEK 640bn. The
market share in Sweden was 23.1 per cent in terms of
assets under management. Discretionary assets under
management amounted to SEK 297bn (257).
Of the total net inflow to the Swedish fund market, the
majority was to fixed income funds (SEK 48bn) and
mixed funds (SEK 25bn) during the first half-year. Equity
funds reported a positive inflow as of 30 June (SEK 5bn)
after an outflow in the first quarter. The total net inflow to
Swedbank Robur’s funds in Sweden was SEK 13bn,
including SEK 10.7bn during the second quarter. This
includes inflows to fixed income funds (SEK 13.5bn) and
mixed funds (SEK 3.4bn), while equity funds posted a
further outflow of SEK 3.7bn. Swedbank’s market share
of net inflows was 15.5 per cent during the first half-
year. The inflow to discretionary asset management
amounted to SEK 7.4bn during the first half-year.
Swedbank – Interim report January-June 2014 Page 25 of 60
Asset management Jan-Jun Jan-Jun
Key ratios, SEKbn 2014 2013 %
Total income, SEKm 2 206 1 972 12
Assets under management 666 561 19
of which Sweden 640 541 18
of which Baltic countries 22 18 24
of which Norway 4 2 81
Discretionary asset management 297 257 15
of which Sweden 295 254 16
of which Baltic countries 2 3 -33
Income from asset management products amounted to
SEK 2 206m during the first half-year, an increase of 12
per cent year-on-year. The improvement is mainly due
to the market’s positive development, which increased
average assets under management by 19 per cent.
Compared with the previous quarter income increased
by SEK 62m, mainly due to a positive stock market.
Insurance business
Swedbank has life insurance operations in all its home
markets and non-life operations in the Baltic countries.
Non-life insurance is offered in Sweden through a third-
party solution with the insurance company Tre Kronor.
Insurance products are sold through the distribution
channels of Swedbank and the savings banks.
Premium payments Jan-Jun Jan-Jun
SEKm 2014 2013 %
Sweden 8 892 8 449 5
of which collective occupational
pensions 3 066 2 833 8
of which endowment insurance 4 028 3 984 1
of which occupational pensions 1 086 976 11
of which risk insurance 380 347 9
of which other 333 310 7
Baltic countries 590 489 21
of which life insurance 369 303 22
of which non-life insurance 221 186 19
Sweden
Swedbank’s life insurance company is the seventh
largest in the Swedish market. In terms of premium
payments it has a market share of about 7 per cent.
During the first half-year premium income amounted to
SEK 8.9bn, an increase of 5 per cent year-on-year.
Demand for pension and insurance products will remain
high for the foreseeable future, and currently they
account for the largest inflow of all savings products.
Considering that only 20 per cent of the corporate
customers of Swedbank and the savings banks have an
occupational pension solution from Swedbank
Försäkring, there is significant potential to raise sales
among existing customers. Premium payments from
occupational pensions rose by 11 per cent from the first
half-year 2013, partly because the portfolio increased
and partly because transfers from other insurers rose by
32 per cent.
Portions of the life insurance market (mainly customised
occupational pension solutions) have high margins,
while a large part of new savings will be in low-margin
products. In order to offer competitive services in the
long term, Swedbank has made efficiencies and
automation of internal processes a priority. Swedbank
does not consider the fees charged in parts of the
occupational pension market to be sustainable in the
current low interest rate environment.
From 1 July 2013 Swedbank Försäkring is a company of
choice for the collectively negotiated ITP plan’s 1.5
million private sector employees, one of the fastest
growing areas of the occupational pension market.
Since July 2013 around 11 000 new agreements have
been signed and SEK 376m has been transferred from
other insurers, of which nearly 4 000 policies worth SEK
272m are attributable to the first half-year 2014.
Baltic countries
In Estonia and Lithuania, Swedbank is the largest life
insurance company, with market shares of 37 and 22
per cent respectively. The market share in Latvia is 15
per cent, where the business, in contrast to Estonia and
Lithuania, has been built up without acquiring an
existing insurance portfolio. Swedbank mainly focuses
on risk insurance for existing loan customers in the retail
banking market, where it sees significant opportunities
to promote sound and sustainable finances because of
the limited social safety net in the Baltic countries.
Sales of Swedbank’s savings products increased by 40
per cent year-on-year. The corresponding increase for
risk products was 33 per cent. More new products have
resulted in higher premium income, which amounted to
SEK 369m, up 16 per cent in local currency compared
with the same period in 2013.
The market shares for non-life insurance in Estonia,
Latvia and Lithuania are 14, 3 and 1 per cent
respectively. In non-life insurance, Swedbank mainly
offers solutions for private customers. The largest
product areas are auto and home insurance, which are
offered together with leasing and mortgages as well as
through direct sales. The non-life operations in Lithuania
were not launched until 2011. The market for auto
leasing is small in Lithuania, because of which
Swedbank is primarily focused on increasing its market
share in home insurance. Total premium income for
non-life insurance in the Baltic operations amounted to
SEK 221m during the first half-year, an increase of 13
per cent in local currency compared with the first half of
2013. Increases were reported for every product, but
especially home insurance, where advertising
campaigns and more active sales by bank branches
have led to higher volumes.
Assets under management
Assets under management 30 Jun 31 Dec
SEKbn 2014 2013 %
Sweden 129.1 118.2 9
of which collective occupational
pensions 53.8 47.6 13
of which endowment insurance 52.7 49.6 6
of which occupational pensions 13.7 12.4 10
of which other 8.9 8.6 4
Baltic countries 3.7 3.1 18
of which life insurance 3.7 3.1 18
Assets under management in the Swedish insurance
operations rose by 9 per cent to SEK 129.1bn during the
first half-year, of which SEK 112.6bn relates to unit
linked and deposit insurance. The increase was due to
higher stock prices and a positive net inflow. The net
inflow is usually higher during the first half-year than the
second due to premium payments for contractual
Swedbank's Interim report Q2 2014

Mais conteúdo relacionado

Mais procurados

Mais procurados (20)

Interim report q1 2017
Interim report q1 2017Interim report q1 2017
Interim report q1 2017
 
Roadshow, Paris, Mikael Inglander
Roadshow, Paris, Mikael InglanderRoadshow, Paris, Mikael Inglander
Roadshow, Paris, Mikael Inglander
 
Roadshow, London, Jan Liden, CEO and Mikael Inglander, CFO
Roadshow, London, Jan Liden, CEO and Mikael Inglander, CFORoadshow, London, Jan Liden, CEO and Mikael Inglander, CFO
Roadshow, London, Jan Liden, CEO and Mikael Inglander, CFO
 
Nordnet Q1 2014 report presentation
Nordnet Q1 2014 report presentationNordnet Q1 2014 report presentation
Nordnet Q1 2014 report presentation
 
Roadshow, Frankfurt, Johannes Rudbeck
Roadshow, Frankfurt, Johannes RudbeckRoadshow, Frankfurt, Johannes Rudbeck
Roadshow, Frankfurt, Johannes Rudbeck
 
CEO presentation of Q2 2008 results
CEO presentation of Q2 2008 resultsCEO presentation of Q2 2008 results
CEO presentation of Q2 2008 results
 
Nordnet Q3 2014 report presentation
Nordnet Q3 2014 report presentationNordnet Q3 2014 report presentation
Nordnet Q3 2014 report presentation
 
SEB's second-quarter 2013 results presentation
SEB's second-quarter 2013 results presentationSEB's second-quarter 2013 results presentation
SEB's second-quarter 2013 results presentation
 
SEB fourth-quarter 2013 results presentation
SEB fourth-quarter 2013 results presentationSEB fourth-quarter 2013 results presentation
SEB fourth-quarter 2013 results presentation
 
SEB's 2014 interim results presentation
SEB's 2014 interim results presentationSEB's 2014 interim results presentation
SEB's 2014 interim results presentation
 
Roadshow Netherlands
Roadshow NetherlandsRoadshow Netherlands
Roadshow Netherlands
 
Roadshow, Jan Lilja, Head of Group Treasury
Roadshow, Jan Lilja, Head of Group TreasuryRoadshow, Jan Lilja, Head of Group Treasury
Roadshow, Jan Lilja, Head of Group Treasury
 
SEB's second quarter 2015 results presentation
SEB's second quarter 2015 results presentationSEB's second quarter 2015 results presentation
SEB's second quarter 2015 results presentation
 
Presentation of Swedbank's Q2 2013 Results from the Press Conference
Presentation of Swedbank's Q2 2013 Results from the Press Conference  Presentation of Swedbank's Q2 2013 Results from the Press Conference
Presentation of Swedbank's Q2 2013 Results from the Press Conference
 
Yer-end Report 2017
Yer-end Report 2017Yer-end Report 2017
Yer-end Report 2017
 
Roadshow, Abu Dhabi
Roadshow, Abu DhabiRoadshow, Abu Dhabi
Roadshow, Abu Dhabi
 
Nordnet Q2 2014 report presentation
Nordnet Q2 2014 report presentationNordnet Q2 2014 report presentation
Nordnet Q2 2014 report presentation
 
Presentation of interim report Q1 2017
Presentation of interim report Q1 2017Presentation of interim report Q1 2017
Presentation of interim report Q1 2017
 
Presentation interim report Q3 2015
Presentation interim report Q3 2015Presentation interim report Q3 2015
Presentation interim report Q3 2015
 
Presentation: interim report january-june 2017 (en)
Presentation: interim report january-june 2017 (en)Presentation: interim report january-june 2017 (en)
Presentation: interim report january-june 2017 (en)
 

Destaque

Online Booking Engine-ANMsoft
Online Booking Engine-ANMsoftOnline Booking Engine-ANMsoft
Online Booking Engine-ANMsoft
guestbf0147
 
морской карнавал для фм логистик
морской карнавал для фм логистикморской карнавал для фм логистик
морской карнавал для фм логистик
guestd9525b
 
Proposal Defense (Final)
Proposal Defense (Final)Proposal Defense (Final)
Proposal Defense (Final)
Jenny Chen
 
Oral Presentation 1(Research Writing and Publishing III)
Oral Presentation 1(Research Writing and Publishing III)Oral Presentation 1(Research Writing and Publishing III)
Oral Presentation 1(Research Writing and Publishing III)
Jenny Chen
 
Proposal Defense Oral Presentation
Proposal Defense Oral PresentationProposal Defense Oral Presentation
Proposal Defense Oral Presentation
Jenny Chen
 

Destaque (15)

Swedbank delårsrapport tredje kvartalet 2015
Swedbank delårsrapport tredje kvartalet 2015Swedbank delårsrapport tredje kvartalet 2015
Swedbank delårsrapport tredje kvartalet 2015
 
Online Booking Engine-ANMsoft
Online Booking Engine-ANMsoftOnline Booking Engine-ANMsoft
Online Booking Engine-ANMsoft
 
морской карнавал для фм логистик
морской карнавал для фм логистикморской карнавал для фм логистик
морской карнавал для фм логистик
 
Impact of digital thinking and practice on PR consultancies
Impact of digital thinking and practice on PR consultancies Impact of digital thinking and practice on PR consultancies
Impact of digital thinking and practice on PR consultancies
 
Proposal Defense (Final)
Proposal Defense (Final)Proposal Defense (Final)
Proposal Defense (Final)
 
Oral Presentation 1(Research Writing and Publishing III)
Oral Presentation 1(Research Writing and Publishing III)Oral Presentation 1(Research Writing and Publishing III)
Oral Presentation 1(Research Writing and Publishing III)
 
Swedbank Delårsrapport Kvartal 1, 2015
Swedbank Delårsrapport Kvartal 1, 2015Swedbank Delårsrapport Kvartal 1, 2015
Swedbank Delårsrapport Kvartal 1, 2015
 
Swedbanks delårsrapport kv 1 2014 dok
Swedbanks delårsrapport kv 1 2014 dokSwedbanks delårsrapport kv 1 2014 dok
Swedbanks delårsrapport kv 1 2014 dok
 
Bulletpages Investor Pitch
Bulletpages Investor PitchBulletpages Investor Pitch
Bulletpages Investor Pitch
 
Swedbank's Corporate presentation Q2 2014
Swedbank's Corporate presentation Q2 2014Swedbank's Corporate presentation Q2 2014
Swedbank's Corporate presentation Q2 2014
 
Corporate Presentation Q3 2014
Corporate Presentation Q3 2014Corporate Presentation Q3 2014
Corporate Presentation Q3 2014
 
Presentation Swedbank's First Quarter 2014 results
Presentation  Swedbank's First Quarter 2014 resultsPresentation  Swedbank's First Quarter 2014 results
Presentation Swedbank's First Quarter 2014 results
 
Swedbank - en företagspresentation (kvartal fyra, 2014)
Swedbank - en företagspresentation (kvartal fyra, 2014)Swedbank - en företagspresentation (kvartal fyra, 2014)
Swedbank - en företagspresentation (kvartal fyra, 2014)
 
Swedbank’s first quarter 2015 results - CEO presentation
Swedbank’s first quarter 2015 results - CEO presentationSwedbank’s first quarter 2015 results - CEO presentation
Swedbank’s first quarter 2015 results - CEO presentation
 
Proposal Defense Oral Presentation
Proposal Defense Oral PresentationProposal Defense Oral Presentation
Proposal Defense Oral Presentation
 

Semelhante a Swedbank's Interim report Q2 2014

Swedbank's Year-end Report 2013
Swedbank's Year-end Report 2013Swedbank's Year-end Report 2013
Swedbank's Year-end Report 2013
Swedbank
 
Danske bank interimreport q22013
Danske bank interimreport q22013Danske bank interimreport q22013
Danske bank interimreport q22013
Frank Ragol
 

Semelhante a Swedbank's Interim report Q2 2014 (20)

Swedbank's Interim Report Q2 2013
Swedbank's Interim Report Q2 2013Swedbank's Interim Report Q2 2013
Swedbank's Interim Report Q2 2013
 
Swedbank's Year-End report 2014
Swedbank's Year-End report 2014Swedbank's Year-End report 2014
Swedbank's Year-End report 2014
 
Swedbank Interim Report Q1, 2015
Swedbank Interim Report Q1, 2015Swedbank Interim Report Q1, 2015
Swedbank Interim Report Q1, 2015
 
Swedbank's Year-end Report 2013
Swedbank's Year-end Report 2013Swedbank's Year-end Report 2013
Swedbank's Year-end Report 2013
 
Interim report Q2 2015
Interim report Q2 2015Interim report Q2 2015
Interim report Q2 2015
 
Swedbank's Interim Report Q3 2013
Swedbank's Interim Report Q3 2013Swedbank's Interim Report Q3 2013
Swedbank's Interim Report Q3 2013
 
Year end report 2016
Year end report 2016Year end report 2016
Year end report 2016
 
Danske bank interimreport q22013
Danske bank interimreport q22013Danske bank interimreport q22013
Danske bank interimreport q22013
 
Year-end Report 2014
Year-end Report 2014Year-end Report 2014
Year-end Report 2014
 
Presentation of Swedbank's Q3 2013 Results from the Press Conference
Presentation of Swedbank's Q3 2013 Results from the Press Conference Presentation of Swedbank's Q3 2013 Results from the Press Conference
Presentation of Swedbank's Q3 2013 Results from the Press Conference
 
Swedbank's third quarter 2015 results
Swedbank's third quarter 2015 resultsSwedbank's third quarter 2015 results
Swedbank's third quarter 2015 results
 
Interim Report for January-September 2014
Interim Report for January-September 2014Interim Report for January-September 2014
Interim Report for January-September 2014
 
Swedbank’s year-end 2013 results
Swedbank’s year-end 2013 resultsSwedbank’s year-end 2013 results
Swedbank’s year-end 2013 results
 
CEO presentation Q4 2009
CEO presentation Q4 2009CEO presentation Q4 2009
CEO presentation Q4 2009
 
Husqvarna Group Q3 2016 results presentation
Husqvarna Group Q3 2016 results presentationHusqvarna Group Q3 2016 results presentation
Husqvarna Group Q3 2016 results presentation
 
Nordnet report presentation January-December 2015
Nordnet report presentation January-December 2015Nordnet report presentation January-December 2015
Nordnet report presentation January-December 2015
 
Nordnet Q4 2012 report presentation
Nordnet Q4 2012 report presentationNordnet Q4 2012 report presentation
Nordnet Q4 2012 report presentation
 
CEO presentation of Q4 2008 results
CEO presentation of Q4 2008 resultsCEO presentation of Q4 2008 results
CEO presentation of Q4 2008 results
 
SEB's third-quarter 2013 results presentation
SEB's third-quarter 2013 results presentationSEB's third-quarter 2013 results presentation
SEB's third-quarter 2013 results presentation
 
Interim Report January - March 2015
Interim Report January - March 2015Interim Report January - March 2015
Interim Report January - March 2015
 

Mais de Swedbank

Mais de Swedbank (20)

Swedbank corporate presentation April 25 2017
Swedbank corporate presentation April 25 2017Swedbank corporate presentation April 25 2017
Swedbank corporate presentation April 25 2017
 
Swedbank foretagspresentation 25 april 2017
Swedbank foretagspresentation 25 april 2017Swedbank foretagspresentation 25 april 2017
Swedbank foretagspresentation 25 april 2017
 
Delårsrapport kv1 2017
Delårsrapport kv1 2017Delårsrapport kv1 2017
Delårsrapport kv1 2017
 
Bokslutskommuniké 2016
Bokslutskommuniké 2016Bokslutskommuniké 2016
Bokslutskommuniké 2016
 
Swedbank företagspresentation, 2 februari 2017
Swedbank företagspresentation, 2 februari 2017Swedbank företagspresentation, 2 februari 2017
Swedbank företagspresentation, 2 februari 2017
 
Swedbank corporate presentation, February 2 2017
Swedbank corporate presentation, February 2 2017Swedbank corporate presentation, February 2 2017
Swedbank corporate presentation, February 2 2017
 
Swedbank Corporate Presentation, October 25 2016
Swedbank Corporate Presentation, October 25 2016Swedbank Corporate Presentation, October 25 2016
Swedbank Corporate Presentation, October 25 2016
 
Swedbank företagspresentation, 25 oktober 2016
Swedbank företagspresentation, 25 oktober 2016Swedbank företagspresentation, 25 oktober 2016
Swedbank företagspresentation, 25 oktober 2016
 
Swedbank Corporate Presentation, June 30 2016
Swedbank Corporate Presentation, June 30 2016Swedbank Corporate Presentation, June 30 2016
Swedbank Corporate Presentation, June 30 2016
 
Swedbank företagspresentation, 30 juni 2016
Swedbank företagspresentation, 30 juni 2016Swedbank företagspresentation, 30 juni 2016
Swedbank företagspresentation, 30 juni 2016
 
Swedbank corporate presentation Q1, 2016
Swedbank corporate presentation Q1, 2016Swedbank corporate presentation Q1, 2016
Swedbank corporate presentation Q1, 2016
 
Swedbank företagspresentation kvartal 1, 2016.
Swedbank företagspresentation kvartal 1, 2016.Swedbank företagspresentation kvartal 1, 2016.
Swedbank företagspresentation kvartal 1, 2016.
 
Swedbank corporate presentation Q4, 2015
Swedbank corporate presentation Q4, 2015Swedbank corporate presentation Q4, 2015
Swedbank corporate presentation Q4, 2015
 
Swedbank företagspresentation kvartal 4,2015
Swedbank företagspresentation kvartal 4,2015Swedbank företagspresentation kvartal 4,2015
Swedbank företagspresentation kvartal 4,2015
 
Bokslutskommuniké 2015
Bokslutskommuniké 2015Bokslutskommuniké 2015
Bokslutskommuniké 2015
 
Swedbank Företagspresentation, September 2015
Swedbank Företagspresentation, September 2015Swedbank Företagspresentation, September 2015
Swedbank Företagspresentation, September 2015
 
Swedbank Corporate Presentation, September 2015
Swedbank Corporate Presentation, September 2015Swedbank Corporate Presentation, September 2015
Swedbank Corporate Presentation, September 2015
 
Kvartalsrapport andra kvartalet 2015
Kvartalsrapport andra kvartalet 2015Kvartalsrapport andra kvartalet 2015
Kvartalsrapport andra kvartalet 2015
 
Corporate Presentation July 2015
Corporate Presentation July 2015Corporate Presentation July 2015
Corporate Presentation July 2015
 
Företagspresentation Q2 2015
Företagspresentation Q2 2015Företagspresentation Q2 2015
Företagspresentation Q2 2015
 

Último

VIP Call Girl in Mira Road 💧 9920725232 ( Call Me ) Get A New Crush Everyday ...
VIP Call Girl in Mira Road 💧 9920725232 ( Call Me ) Get A New Crush Everyday ...VIP Call Girl in Mira Road 💧 9920725232 ( Call Me ) Get A New Crush Everyday ...
VIP Call Girl in Mira Road 💧 9920725232 ( Call Me ) Get A New Crush Everyday ...
dipikadinghjn ( Why You Choose Us? ) Escorts
 
➥🔝 7737669865 🔝▻ Malda Call-girls in Women Seeking Men 🔝Malda🔝 Escorts Ser...
➥🔝 7737669865 🔝▻ Malda Call-girls in Women Seeking Men  🔝Malda🔝   Escorts Ser...➥🔝 7737669865 🔝▻ Malda Call-girls in Women Seeking Men  🔝Malda🔝   Escorts Ser...
➥🔝 7737669865 🔝▻ Malda Call-girls in Women Seeking Men 🔝Malda🔝 Escorts Ser...
amitlee9823
 
VIP Call Girl in Mumbai Central 💧 9920725232 ( Call Me ) Get A New Crush Ever...
VIP Call Girl in Mumbai Central 💧 9920725232 ( Call Me ) Get A New Crush Ever...VIP Call Girl in Mumbai Central 💧 9920725232 ( Call Me ) Get A New Crush Ever...
VIP Call Girl in Mumbai Central 💧 9920725232 ( Call Me ) Get A New Crush Ever...
dipikadinghjn ( Why You Choose Us? ) Escorts
 
Best VIP Call Girls Morni Hills Just Click Me 6367492432
Best VIP Call Girls Morni Hills Just Click Me 6367492432Best VIP Call Girls Morni Hills Just Click Me 6367492432
Best VIP Call Girls Morni Hills Just Click Me 6367492432
motiram463
 
From Luxury Escort Service Kamathipura : 9352852248 Make on-demand Arrangemen...
From Luxury Escort Service Kamathipura : 9352852248 Make on-demand Arrangemen...From Luxury Escort Service Kamathipura : 9352852248 Make on-demand Arrangemen...
From Luxury Escort Service Kamathipura : 9352852248 Make on-demand Arrangemen...
From Luxury Escort : 9352852248 Make on-demand Arrangements Near yOU
 
VIP Independent Call Girls in Mira Bhayandar 🌹 9920725232 ( Call Me ) Mumbai ...
VIP Independent Call Girls in Mira Bhayandar 🌹 9920725232 ( Call Me ) Mumbai ...VIP Independent Call Girls in Mira Bhayandar 🌹 9920725232 ( Call Me ) Mumbai ...
VIP Independent Call Girls in Mira Bhayandar 🌹 9920725232 ( Call Me ) Mumbai ...
dipikadinghjn ( Why You Choose Us? ) Escorts
 
VIP Independent Call Girls in Bandra West 🌹 9920725232 ( Call Me ) Mumbai Esc...
VIP Independent Call Girls in Bandra West 🌹 9920725232 ( Call Me ) Mumbai Esc...VIP Independent Call Girls in Bandra West 🌹 9920725232 ( Call Me ) Mumbai Esc...
VIP Independent Call Girls in Bandra West 🌹 9920725232 ( Call Me ) Mumbai Esc...
dipikadinghjn ( Why You Choose Us? ) Escorts
 
call girls in Sant Nagar (DELHI) 🔝 >༒9953056974 🔝 genuine Escort Service 🔝✔️✔️
call girls in Sant Nagar (DELHI) 🔝 >༒9953056974 🔝 genuine Escort Service 🔝✔️✔️call girls in Sant Nagar (DELHI) 🔝 >༒9953056974 🔝 genuine Escort Service 🔝✔️✔️
call girls in Sant Nagar (DELHI) 🔝 >༒9953056974 🔝 genuine Escort Service 🔝✔️✔️
9953056974 Low Rate Call Girls In Saket, Delhi NCR
 
VIP Call Girl Service Andheri West ⚡ 9920725232 What It Takes To Be The Best ...
VIP Call Girl Service Andheri West ⚡ 9920725232 What It Takes To Be The Best ...VIP Call Girl Service Andheri West ⚡ 9920725232 What It Takes To Be The Best ...
VIP Call Girl Service Andheri West ⚡ 9920725232 What It Takes To Be The Best ...
dipikadinghjn ( Why You Choose Us? ) Escorts
 

Último (20)

Stock Market Brief Deck (Under Pressure).pdf
Stock Market Brief Deck (Under Pressure).pdfStock Market Brief Deck (Under Pressure).pdf
Stock Market Brief Deck (Under Pressure).pdf
 
VIP Call Girl in Mira Road 💧 9920725232 ( Call Me ) Get A New Crush Everyday ...
VIP Call Girl in Mira Road 💧 9920725232 ( Call Me ) Get A New Crush Everyday ...VIP Call Girl in Mira Road 💧 9920725232 ( Call Me ) Get A New Crush Everyday ...
VIP Call Girl in Mira Road 💧 9920725232 ( Call Me ) Get A New Crush Everyday ...
 
➥🔝 7737669865 🔝▻ Malda Call-girls in Women Seeking Men 🔝Malda🔝 Escorts Ser...
➥🔝 7737669865 🔝▻ Malda Call-girls in Women Seeking Men  🔝Malda🔝   Escorts Ser...➥🔝 7737669865 🔝▻ Malda Call-girls in Women Seeking Men  🔝Malda🔝   Escorts Ser...
➥🔝 7737669865 🔝▻ Malda Call-girls in Women Seeking Men 🔝Malda🔝 Escorts Ser...
 
VIP Call Girl in Mumbai Central 💧 9920725232 ( Call Me ) Get A New Crush Ever...
VIP Call Girl in Mumbai Central 💧 9920725232 ( Call Me ) Get A New Crush Ever...VIP Call Girl in Mumbai Central 💧 9920725232 ( Call Me ) Get A New Crush Ever...
VIP Call Girl in Mumbai Central 💧 9920725232 ( Call Me ) Get A New Crush Ever...
 
7 tips trading Deriv Accumulator Options
7 tips trading Deriv Accumulator Options7 tips trading Deriv Accumulator Options
7 tips trading Deriv Accumulator Options
 
Airport Road Best Experience Call Girls Number-📞📞9833754194 Santacruz MOst Es...
Airport Road Best Experience Call Girls Number-📞📞9833754194 Santacruz MOst Es...Airport Road Best Experience Call Girls Number-📞📞9833754194 Santacruz MOst Es...
Airport Road Best Experience Call Girls Number-📞📞9833754194 Santacruz MOst Es...
 
Best VIP Call Girls Morni Hills Just Click Me 6367492432
Best VIP Call Girls Morni Hills Just Click Me 6367492432Best VIP Call Girls Morni Hills Just Click Me 6367492432
Best VIP Call Girls Morni Hills Just Click Me 6367492432
 
Kopar Khairane Russian Call Girls Number-9833754194-Navi Mumbai Fantastic Unl...
Kopar Khairane Russian Call Girls Number-9833754194-Navi Mumbai Fantastic Unl...Kopar Khairane Russian Call Girls Number-9833754194-Navi Mumbai Fantastic Unl...
Kopar Khairane Russian Call Girls Number-9833754194-Navi Mumbai Fantastic Unl...
 
Strategic Resources May 2024 Corporate Presentation
Strategic Resources May 2024 Corporate PresentationStrategic Resources May 2024 Corporate Presentation
Strategic Resources May 2024 Corporate Presentation
 
Cybersecurity Threats in Financial Services Protection.pptx
Cybersecurity Threats in  Financial Services Protection.pptxCybersecurity Threats in  Financial Services Protection.pptx
Cybersecurity Threats in Financial Services Protection.pptx
 
cost-volume-profit analysis.ppt(managerial accounting).pptx
cost-volume-profit analysis.ppt(managerial accounting).pptxcost-volume-profit analysis.ppt(managerial accounting).pptx
cost-volume-profit analysis.ppt(managerial accounting).pptx
 
From Luxury Escort Service Kamathipura : 9352852248 Make on-demand Arrangemen...
From Luxury Escort Service Kamathipura : 9352852248 Make on-demand Arrangemen...From Luxury Escort Service Kamathipura : 9352852248 Make on-demand Arrangemen...
From Luxury Escort Service Kamathipura : 9352852248 Make on-demand Arrangemen...
 
VIP Independent Call Girls in Mira Bhayandar 🌹 9920725232 ( Call Me ) Mumbai ...
VIP Independent Call Girls in Mira Bhayandar 🌹 9920725232 ( Call Me ) Mumbai ...VIP Independent Call Girls in Mira Bhayandar 🌹 9920725232 ( Call Me ) Mumbai ...
VIP Independent Call Girls in Mira Bhayandar 🌹 9920725232 ( Call Me ) Mumbai ...
 
Lion One Corporate Presentation May 2024
Lion One Corporate Presentation May 2024Lion One Corporate Presentation May 2024
Lion One Corporate Presentation May 2024
 
VIP Independent Call Girls in Bandra West 🌹 9920725232 ( Call Me ) Mumbai Esc...
VIP Independent Call Girls in Bandra West 🌹 9920725232 ( Call Me ) Mumbai Esc...VIP Independent Call Girls in Bandra West 🌹 9920725232 ( Call Me ) Mumbai Esc...
VIP Independent Call Girls in Bandra West 🌹 9920725232 ( Call Me ) Mumbai Esc...
 
Technology industry / Finnish economic outlook
Technology industry / Finnish economic outlookTechnology industry / Finnish economic outlook
Technology industry / Finnish economic outlook
 
Mira Road Awesome 100% Independent Call Girls NUmber-9833754194-Dahisar Inter...
Mira Road Awesome 100% Independent Call Girls NUmber-9833754194-Dahisar Inter...Mira Road Awesome 100% Independent Call Girls NUmber-9833754194-Dahisar Inter...
Mira Road Awesome 100% Independent Call Girls NUmber-9833754194-Dahisar Inter...
 
call girls in Sant Nagar (DELHI) 🔝 >༒9953056974 🔝 genuine Escort Service 🔝✔️✔️
call girls in Sant Nagar (DELHI) 🔝 >༒9953056974 🔝 genuine Escort Service 🔝✔️✔️call girls in Sant Nagar (DELHI) 🔝 >༒9953056974 🔝 genuine Escort Service 🔝✔️✔️
call girls in Sant Nagar (DELHI) 🔝 >༒9953056974 🔝 genuine Escort Service 🔝✔️✔️
 
VIP Call Girl Service Andheri West ⚡ 9920725232 What It Takes To Be The Best ...
VIP Call Girl Service Andheri West ⚡ 9920725232 What It Takes To Be The Best ...VIP Call Girl Service Andheri West ⚡ 9920725232 What It Takes To Be The Best ...
VIP Call Girl Service Andheri West ⚡ 9920725232 What It Takes To Be The Best ...
 
(Sexy Sheela) Call Girl Mumbai Call Now 👉9920725232👈 Mumbai Escorts 24x7
(Sexy Sheela) Call Girl Mumbai Call Now 👉9920725232👈 Mumbai Escorts 24x7(Sexy Sheela) Call Girl Mumbai Call Now 👉9920725232👈 Mumbai Escorts 24x7
(Sexy Sheela) Call Girl Mumbai Call Now 👉9920725232👈 Mumbai Escorts 24x7
 

Swedbank's Interim report Q2 2014

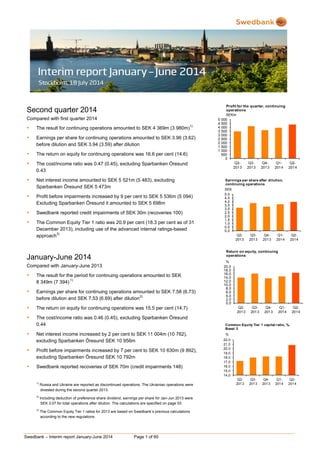
  • 1. Swedbank – Interim report January-June 2014 Page 1 of 60 Second quarter 2014 Compared with first quarter 2014  The result for continuing operations amounted to SEK 4 369m (3 980m) 1)  Earnings per share for continuing operations amounted to SEK 3.96 (3.62) before dilution and SEK 3.94 (3.59) after dilution  The return on equity for continuing operations was 16.6 per cent (14.6)  The cost/income ratio was 0.47 (0.45), excluding Sparbanken Öresund 0.43  Net interest income amounted to SEK 5 521m (5 483), excluding Sparbanken Öresund SEK 5 473m  Profit before impairments increased by 9 per cent to SEK 5 536m (5 094) Excluding Sparbanken Öresund it amounted to SEK 5 698m  Swedbank reported credit impairments of SEK 30m (recoveries 100)  The Common Equity Tier 1 ratio was 20.9 per cent (18.3 per cent as of 31 December 2013), including use of the advanced internal ratings-based approach 3) January-June 2014 Compared with January-June 2013  The result for the period for continuing operations amounted to SEK 8 349m (7 394) 1)  Earnings per share for continuing operations amounted to SEK 7.58 (6.73) before dilution and SEK 7.53 (6.69) after dilution 2)  The return on equity for continuing operations was 15.5 per cent (14.7)  The cost/income ratio was 0.46 (0.45), excluding Sparbanken Öresund 0.44  Net interest income increased by 2 per cent to SEK 11 004m (10 762), excluding Sparbanken Öresund SEK 10 956m  Profit before impairments increased by 7 per cent to SEK 10 630m (9 892), excluding Sparbanken Öresund SEK 10 792m  Swedbank reported recoveries of SEK 70m (credit impairments 148) 1) Russia and Ukraine are reported as discontinued operations. The Ukrainian operations were divested during the second quarter 2013. 2) Including deduction of preference share dividend, earnings per share for Jan-Jun 2013 were SEK 3.07 for total operations after dilution. The calculations are specified on page 53. 3) The Common Equity Tier 1 ratios for 2013 are based on Swedbank’s previous calculations according to the new regulations. 0 500 1 000 1 500 2 000 2 500 3 000 3 500 4 000 4 500 5 000 Q2- 2013 Q3- 2013 Q4- 2013 Q1- 2014 Q2- 2014 SEKm Profit for the quarter, continuing operations 0,0 0,5 1,0 1,5 2,0 2,5 3,0 3,5 4,0 4,5 5,0 Q2- 2013 Q3- 2013 Q4- 2013 Q1- 2014 Q2- 2014 SEK Earnings per share after dilution, continuing operations 0,0 2,0 4,0 6,0 8,0 10,0 12,0 14,0 16,0 18,0 20,0 Q2- 2013 Q3- 2013 Q4- 2013 Q1- 2014 Q2- 2014 % Return on equity, continuing operations 14,0 15,0 16,0 17,0 18,0 19,0 20,0 21,0 22,0 Q2- 2013 Q3- 2013 Q4- 2013 Q1- 2014 Q2- 2014 % Common Equity Tier 1 capital ratio, %, Basel 3
  • 2. Swedbank – Interim report January-June 2014 Page 2 of 60 CEO Comment The global recovery is continuing, albeit at a slower pace – the US economy is growing steadily, whereas growth in Europe is more divided. Economic activity in Sweden continued to grow during the second quarter, and in addition to strong domestic demand we saw signs of increased credit demand in the commercial sector for the first time in a while. Higher profit and strong volume growth Swedbank’s profit for the second quarter was strong. Lower market interest rates affected net interest income negatively, while increased lending and deposit volumes contributed positively. Notably, the quarter saw increased activity among our corporate customers and growth in urban areas. Lending volumes rose by nearly SEK 50bn during the quarter, with Sparbanken Öresund accounting for just over SEK 16bn. At the same time increased savings, coupled with a favourable stock market climate, strengthened the profit. Swedbank’s acquisition of Sparbanken Öresund was finalised in May and integration work has begun. In the near term we are focusing on our new customers and on capitalising on cost synergies. The bank’s low risk entails lower funding costs Swedbank’s Common Equity Tier 1 ratio was 20.9 per cent at the end of the quarter. In May the Swedish Financial Supervisory Authority published its proposed capital requirements, but we need further clarification before we set a new capital target. It seems contradictory, however, that Swedbank, which according to the Swedish Financial Supervisory Authority’s and the Riksbank’s own stress tests has the lowest aggregate risks of any major Swedish bank, should have the highest capital requirement. The bank's low risk and solid capitalisation were noted by the ratings agencies Fitch and S&P during the quarter. Fitch raised its outlook for Swedbank’s credit rating to positive and S&P upgraded the bank's individual rating by one notch to A while at the same time reaffirming Swedbank’s long-term rating of A+. The bank’s low risk further reduced our funding costs during the quarter. New head office will increase customer value In early June we moved into our new head office in Sundbyberg. The move supports our aim to be the most cost-effective bank and offers a new way of working. The new, open-plan offices invite cooperation and discussion between employees, which in the long run will increase customer value. During the quarter we introduced new solutions that make daily life a little easier for our customers: card payments by smartphone (Babs Micro), Swish corporate for mobile payments between consumers and businesses, and a spending tracker, “Utgiftskollen”, which attracted 150 000 customers in its first month. “Swish” payments between retail customers continue to grow, with 144 000 new customers during the quarter and a 90 per cent increase in the number of transactions. Moreover, we decided to keep the Swish service free for retail customers. Swedish housing shortage – more to be done The political debate leading up to this autumn's parliamentary election in Sweden has intensified. The Riksbank’s rate cut puts the burden on legislators and regulators to take action to slow the growth in household debt and to build more housing. New construction and opportunities for increased mobility in the housing market are key issues for Sweden, especially since a solution to the severe housing shortage is critical to the country’s long-term growth prospects. Requiring homeowners to amortise their mortgages, which has also been on the agenda, will have a sustainable, positive effect on our customer finances and will benefit Sweden in the long term. Global changes required greater cost efficiencies Despite our strong profit, the banking sector is in a tumultuous stage where low interest rates, regulatory changes, technological developments and increased competition are making it necessary to quickly adapt, especially in the Swedish retail market. Cutting costs through efficiencies when developing our offerings and ensuring that the underlying processes our customers rely on when using our services are as automated as possible is critical in order to create sustainable value for both our customers and shareholders. Our cost- savings goals for 2014 remain firm. Costs will be held at the same level as in 2013, excluding additional costs for the acquisition of Sparbanken Öresund. Michael Wolf President and CEO
  • 3. Swedbank – Interim report January-June 2014 Page 3 of 60 Table of contents Page Financial summary 4 Overview 6 Market 6 Important events during the quarter 6 Second quarter 2014 compared with first quarter 2014 6 Result 6 January-June 2014 compared with January-June 2013 8 Result 8 Credit and asset quality 9 Stress test – Capital Adequacy Process 2014 10 Funding and liquidity 10 Ratings 10 Capital and capital adequacy 11 Market risk 12 Operational risks 12 Other events 13 Events after 30 June 2014 13 Business segments Swedish Banking 14 Large Corporates & Institutions 16 Baltic Banking 18 Group Functions & Other 20 Eliminations 22 Product areas 23 Financial information Group Income statement, condensed 28 Statement of comprehensive income, condensed 29 Key ratios 30 Balance sheet, condensed 31 Statement of changes in equity, condensed 32 Cash flow statement, condensed 33 Notes 33 Parent company 55 Signatures of the Board of Directors and the President 59 Review report 59 Contact information 60 More detailed information can be found in Swedbank’s fact book, www.swedbank.com/ir, under Financial information and publications.
  • 4. Swedbank – Interim report January-June 2014 Page 4 of 60 Financial summary Income statement Q2 Q1 Q2 Jan-Jun Jan-Jun SEKm 2014 2014 % 2013 % 2014 2013 % Net interest income 5 521 5 483 1 5 409 2 11 004 10 762 2 Net commission income 2 813 2 693 4 2 525 11 5 506 4 913 12 Net gains and losses on financial items at fair value 773 345 296 1 118 853 31 Other income 1 348 799 69 749 80 2 147 1 533 40 Total income 10 455 9 320 12 8 979 16 19 775 18 061 9 Staff costs 2 901 2 437 19 2 391 21 5 338 4 749 12 Other expenses 2 018 1 789 13 1 735 16 3 807 3 420 11 Total expenses 4 919 4 226 16 4 126 19 9 145 8 169 12 Profit before impairments 5 536 5 094 9 4 853 14 10 630 9 892 7 Impairment of intangible assets 1 0 170 -99 1 170 -99 Impairment of tangible assets 69 135 -49 202 -66 204 287 -29 Credit impairments 30 -100 88 -66 -70 148 Operating profit 5 436 5 059 7 4 393 24 10 495 9 287 13 Tax expense 1 063 1 074 -1 913 16 2 137 1 889 13 Profit for the period from continuing operations 4 373 3 985 10 3 480 26 8 358 7 398 13 Profit for the period from discontinued operations, after tax -230 -27 -1 887 -88 -257 -2 277 -89 Profit for the period 4 143 3 958 5 1 593 8 101 5 121 58 Profit for the period attributable to the shareholders of Swedbank AB 4 139 3 953 5 1 592 8 092 5 117 58 Income statement for the Group excluding Sparbanken Öresund Q2 Q1 Q2 Jan-Jun Jan-Jun SEKm 2014 2014 % 2013 % 2014 2013 % Net interest income 5 473 5 483 0 5 409 1 10 956 10 762 2 Net commission income 2 795 2 693 4 2 525 11 5 488 4 913 12 Net gains and losses on financial items at fair value 775 345 296 1 120 853 31 Other income 872 799 9 749 16 1 671 1 533 9 Total income 9 915 9 320 6 8 979 10 19 235 18 061 7 Staff costs 2 461 2 437 1 2 391 3 4 898 4 749 3 Other expenses 1 757 1 789 -2 1 735 1 3 546 3 420 4 Total expenses 4 218 4 226 0 4 126 2 8 444 8 169 3 Profit before impairments 5 697 5 094 12 4 853 17 10 791 9 892 9 Impairment of intangible assets 1 0 170 -99 1 170 -99 Impairment of tangible assets 69 135 -49 202 -66 204 287 -29 Credit impairments 26 -100 88 -70 -74 148 Operating profit 5 601 5 059 11 4 393 27 10 660 9 287 15 Tax expense 1 200 1 074 12 913 31 2 274 1 889 20 Profit for the period from continuing operations 4 401 3 985 10 3 480 26 8 386 7 398 13 Profit for the period from discontinued operations, after tax -230 -27 -1 887 -88 -257 -2 277 -89 Profit for the period 4 171 3 958 5 1 593 8 129 5 121 59 Profit for the period attributable to the shareholders of Swedbank AB 4 167 3 953 5 1 592 8 120 5 117 59 Cost/income ratio 0.43 0.45 0.46 0.00 0.44 0.45
  • 5. Swedbank – Interim report January-June 2014 Page 5 of 60 Key ratios and data per share including Sparbanken Öresund Q2 Q1 Q2 Jan-Jun Jan-Jun 2014 2014 2013 2014 2013 Return on equity, continuing operations, % 16.6 14.6 14.1 15.5 14.7 Return on equity, total operations, % 15.8 14.5 6.5 15.1 10.1 Earnings per share before dilution, continuing operations, SEK 1) 3.96 3.62 3.16 7.58 6.73 Earnings per share after dilution, continuing operations, SEK 1) 3.94 3.59 3.15 7.53 6.69 Cost/income ratio 0.47 0.45 0.46 0.46 0.45 Loan/deposit ratio, % 189 195 186 189 186 Common Equity Tier 1 capital ratio, %, Basel 3 2) 20.9 18.3 17.2 20.9 17.2 Tier 1 capital ratio, %, Basel 3 2) 22.1 19.4 18.6 22.1 18.6 Total capital ratio, %, Basel 3 2) 25.3 22.0 19.6 25.3 19.6 Credit impairment ratio, % 0.01 -0.03 0.03 -0.01 0.02 Share of impaired loans, gross, % 0.44 0.45 0.76 0.44 0.76 Total provision ratio for impaired loans, % 56 60 54 56 54 Balance sheet data including Sparbanken Öresund 30 Jun 31 Dec 30 Jun SEKbn 2014 2013 % 2013 % Loans to the public 1 323 1 265 5 1 246 6 Deposits and borrowings from the public 697 621 12 673 4 Shareholders' equity 108 110 -2 101 6 Total assets 2 052 1 824 12 1 886 9 Risk exposure amount, Basel 3 2) 407 441 -8 459 -11 1) Including deduction of the preference share dividend, earnings per share for January-Jun 2013 were SEK 3.07 for total operations after dilution. The calculations are specified on page 53. 2) The capital ratios for 2013 are based on Swedbank knowledge of the new regulations at that point in time. The key ratios are based on profit and shareholders’ equity attributable to shareholders of Swedbank.
  • 6. Swedbank – Interim report January-June 2014 Page 6 of 60 Overview Market The global economic recovery is continuing, though at a slower pace. North America and Europe are the engines, while growth has slowed in most emerging markets. Growth in China has stabilised, however, and concerns about a sharp deceleration have diminished. In the eurozone, the slow recovery is continuing, but with considerable differences between countries. The Swedish economy is generating solid growth. The driver is domestic demand, primarily consumer spending and construction investment. Exports are being held in check by weak external demand. During the first quarter GDP growth was 1.9 per cent. At the same time recent economic indicators point to a continued recovery in the Swedish economy. Due to weak international growth and low resource utilisation, global inflation is very low. To address the risk of deflation, monetary policies in Europe and North America have been highly expansive. The Riksbank and the European Central Bank (ECB) both recently cut their benchmark rates, and a further stimulus from the ECB remains a possibility. Higher growth in the US is allowing the Federal Reserve (Fed) to continue tapering its bond buying, which is expected to come to an end this autumn. Long-term bond yields fell, mainly in Europe but also in the US, despite the Fed’s reduced bond purchases. Low global inflation, geopolitical uncertainty in Ukraine and the Middle East, and expectations of continued low interest rates are keeping pressure on yields. US short- term yields have risen slightly of late, however. Growth in the Baltic economies slowed during the first quarter to 3.2 per cent in Lithuania, 2.8 per cent in Latvia and turned negative in Estonia at -1.4 per cent. With weak demand in major export markets, domestic demand is again driving growth, though to varying degrees. Investment was highest in Lithuania and moderate in Estonia and Latvia. Household consumption growth was also slightly faster in Lithuania, but slowed down in all three countries. Exports started to recover in Estonia and Latvia but fell in Lithuania in early 2014 owing to problems in certain sectors. One threat to growth in the Baltic countries is weaker economic performance in key export markets, especially in Finland and Russia. The biggest domestic risk stems from the labour market. Productivity growth in the Baltic countries has recently lagged behind wage growth, especially in Estonia and Latvia, implying a rise in labour costs. Rapid wage growth has not yet pushed prices higher, however. The Stockholm stock exchange (OMXSPI) gained 6 per cent during the first half-year. The Tallinn stock exchange (OMXTGI) fell by 1.9 per cent and the Riga stock exchange (OMXRGI) by 2.6 per cent, while the Vilnius stock exchange (OMXVGI) gained 11.9 per cent. Important events during the quarter During the first quarter Swedbank acquired Sparbanken Öresund as a way of strengthening its market position in its home markets. The Swedish Financial Supervisory Authority approved the acquisition on 16 May and, having received all the necessary approvals, the acquisition was finalised on 20 May and the integration process begun. Sparbanken Öresund affects Swedbank’s profit as of 21 May to 30 June, as indicated in the table below and throughout the report. The financial effects are in line with the analysis conducted at the time of acquisition, but with adjustments between certain items. Integration costs in the form of restructuring costs have been slightly higher than previously estimated. At the same time greater surplus values have been identified in the acquired business and credit quality proved to be higher. As of the third quarter the acquisition of Sparbanken Öresund will no longer be shown separately in Swedbank’s financial reports. Costs associated with the acquisition are slightly higher than previously estimated and the Group’s cost objective for 2014 have been adjusted to SEK 17.7bn. Costs excluding Sparbanken Öresund will be unchanged compared with 2013, in accordance with previous guidance. Impact of Sparbanken Öresund Running SEKm business One-offs Total Net interest income 48 0 48 Net commission income 18 0 18 Net gains and losses on financial items at fair value -2 0 -2 Other income 15 461 476 Total income 79 461 540 Staff costs 47 393 440 Other expenses 39 222 261 Total expenses 86 615 701 Credit impairments 4 0 4 Tax expense -2 -135 -137 Profit for the period attributable to the shareholders of Swedbank AB -9 -19 -28 On 13 June Swedbank received approval from the Swedish Financial Supervisory Authority to use the advanced internal ratings-based (A-IRB) approach for its corporate exposures in Sweden and Norway. This reduced the risk exposure amount by SEK 72.9bn, slightly more than previously estimated. In early June Swedbank moved into its new head office in Sundbyberg. The move will reduce costs and the new, open-plan offices will encourage greater internal cooperation. This will lead to efficiencies in the development of new and better offerings for our customers. Second quarter 2014 Compared with first quarter 2014 Result The quarterly result rose by 5 per cent to SEK 4 139m (3 953). Income and expenses both increased. Expenses, excluding the acquisition of Sparbanken Öresund, were stable. Credit impairments were reported during the quarter, compared with net recoveries during the first quarter. Profit for continuing operations amounted to SEK 4 369m (3 980). Discontinued operations generated a loss of SEK 230m (-27), of which SEK 223m is a cumulative negative exchange rate difference that was reclassified to profit and loss from other comprehensive income and relates to the
  • 7. Swedbank – Interim report January-June 2014 Page 7 of 60 winding down of the Russian operations. This does not affect equity or the 2014 dividend. Remaining equity in the Russian operations amounts to SEK 212m, with remaining negative FX differences of SEK 11m as of 30 June. Profit before impairments increased by 9 per cent to SEK 5 536m (5 094). Sparbanken Öresund reported a loss before impairments of SEK 162m, excluding this Swedbank’s profit increased by 12 per cent. Group Treasury within Group Functions & Other and Swedish Banking and Baltic Banking contributed to the increase, while LC&I’s profit decreased from a high level. Profit before impairments by business segment Q2 Q1 Q2 SEKm 2014 2014 2013 Swedish Banking excl Sparbanken Öresund 3 198 2 979 2 924 Sparbanken Öresund -161 0 0 Large Corporates & Institutions 1 141 1 277 1 091 Baltic Banking 975 885 838 Group Functions & Other 383 -5 55 Total excl FX effects 5 536 5 136 4 908 FX effects 0 -42 -55 Total 5 536 5 094 4 853 Credit impairments amounted to SEK 30m (net recoveries 100). Swedish Banking and LC&I reported low credit impairments, while Baltic Banking reported continued net recoveries, albeit lower than in the previous quarter. Tangible asset writedowns decreased to SEK 69m (135) and primarily relate to the writedown of Ektornet’s property values, the large part of which is attributable to the US. The return on equity for continuing operations was 16.6 per cent (14.6). The cost/income ratio was 0.47 (0.45). Excluding Sparbanken Öresund the cost/income ratio was 0.43. Income increased by 12 per cent to SEK 10 455m (9 320). Excluding Sparbanken Öresund income rose by 6 per cent. Sparbanken Öresund accounted for SEK 540m. Net gains and losses on financial items at fair value, net commission income and other income all increased, while net interest income was stable. Net interest income was stable in all business segments at SEK 5 521m (5 483). Sparbanken Öresund contributed SEK 48m. Lower market interest rates affected Swedish Banking’s net interest income negatively, while higher lending volumes in Swedish Banking and LC&I contributed positively. The margin on corporate lending within LC&I was stable, but increased slightly in Baltic Banking. Mortgage margins for the Swedish portfolio as a whole were stable, but increased slightly at the end of the quarter. Net commission income rose to SEK 2 813m (2 693). Sparbanken Öresund accounted for SEK 18m. The trend for Swedish Banking and Baltic Banking was positive, while net commission income decreased within LC&I. The increase in net commission income was mainly due to higher income from cards and asset management. Payment commissions increased due to the reversal of a previous provision of SEK 35m in Lithuania. Income from Corporate Finance remained strong and was in line with the previous quarter. Net gains and losses on financial items at fair value rose to SEK 773m (345). Group Treasury, which accounted for the largest increase, benefited from the positive effects of falling interest rates, and also from lower covered bond repurchases and a change in valuation of SEK 80m related to a strategic shareholding. Net gains and losses on financial items at fair value within LC&I remained strong, in line with the first quarter. A negative translation difference of SEK 74m was recognised during the first quarter in Ektornet within Group Functions & Other related to the depreciation of the Ukrainian currency, the hryvnia. Other income increased by 69 per cent to SEK 1 348m (799). Sparbanken Öresund accounted for SEK 461m due to a bargain purchase gain in connection with the acquisition. During the second quarter one-off income of SEK 230m was recognised in Share related to associates for Entercard (see also page 24). Expenses rose by 16 per cent to SEK 4 919m (4 226). Expenses attributable to Sparbanken Öresund amounted to SEK 701m, of which SEK 615m refers to one-off expenses in connection with the acquisition. Excluding Sparbanken Öresund expenses were stable with slightly higher staff costs and marketing expenses. SEK 57m (79) was expensed during the second quarter related to the move of the head office to Sundbyberg. Expense analysis Group Q2 Q1 Q2 SEKm 2014 2014 2013 Swedish Banking excl Sparbanken Öresund 2 491 2 443 2 392 Sparbanken Öresund 701 0 0 Large Corporates & Institutions 804 834 834 Baltic Banking 621 623 628 Group Functions & Other and eliminations 302 343 309 Total excl FX effects 4 919 4 243 4 163 FX effects 0 -17 -37 Total 4 919 4 226 4 126 The number of full-time employees increased during the quarter due to the acquisition of Sparbanken Öresund. Excluding Sparbanken Öresund the number of full-time employees declined by 36. The tax expense amounted to SEK 1 063m (1 074), corresponding to an effective tax rate of 19.6 per cent (21.2). The first quarter was negatively affected by non- deductible property writedowns in the US and Ukraine. The second quarter was positively affected by the acquisition of Sparbanken Öresund. The bargain purchase gain is not taxable.
  • 8. Swedbank – Interim report January-June 2014 Page 8 of 60 January-June 2014 Compared with January-June 2013 Result The result for the period increased by 58 per cent to SEK 8 092m (5 117). Income and expenses both increased, while credit impairments decreased. Fluctuations in exchange rates, primarily the depreciation of the Swedish krona against the euro and the Lithuanian litas, increased profit by SEK 79m. The result for continuing operations was SEK 8 349m (7 394) and for discontinued operations was SEK -257m (-2 277). During the first half-year 2013 SEK -1 875m was reclassified to profit or loss from other comprehensive income related to the sale of the Ukrainian operations, compared with a corresponding reclassification of SEK -223m during the first half of this year for the winding down of the Russian operations. Profit before impairments increased by 7 per cent to SEK 10 630m (9 892). Profit increased in all business segments as a result of higher income. Profit increased the most in Baltic Banking. Expenses excluding Sparbanken Öresund increased slightly compared with the previous year. Net recoveries of SEK 70m were recognised during the first half-year 2014, compared with credit impairments of SEK 148m a year earlier. Baltic Banking reported recoveries, while Swedish Banking reported minor credit impairments. Tangible asset writedowns amounted to SEK 204m (287), a decrease attributable to Ektornet. Intangible asset writedowns decreased to SEK 1m (170). During the first half year 2013 internally developed software was written down by SEK 170m. Profit before impairments by business segment Jan-Jun Jan-Jun ∆ SEKm 2014 2013 SEKm Swedish Banking excl Sparbanken Öresund 6 177 5 903 113 Sparbanken Öresund -161 0 0 Large Corporates & Institutions 2 406 2 165 241 Baltic Banking 1 833 1 565 268 Group Functions & Other 375 345 30 Total excl FX effects 10 630 9 978 652 FX effects 0 -86 86 Total 10 630 9 892 738 The return on equity for continuing operations was 15.5 per cent (14.7). The cost/income ratio was 0.46 (0.45). Excluding Sparbanken Öresund the cost/income ratio was 0.44. Income rose by 9 per cent to SEK 19 775m (18 061). Sparbanken Öresund’s income amounted to SEK 540m. All business segments contributed to the higher income. Stronger commission income contributed the most, while other income excluding one-off effects decreased. Changes in exchange rates increased income by SEK 136m. Net interest income rose by 2 per cent to SEK 11 004m (10 762). In Baltic Banking, increased deposit volumes, higher market interest rates and the repricing of corporate lending all contributed positively. LC&I improved the margins on its lending portfolio slightly, and higher volumes also contributed positively. In Swedish Banking, net interest income was stable; the positive effects of the higher lending volumes were offset by margin pressure on deposits. Fluctuations in exchange rates increased net interest income by SEK 72m. Net commission income rose by 12 per cent to SEK 5 506m (4 913). Higher commission income from asset management due to a favourable stock market climate and net inflows contributed the most to the increase. Corporate finance and loan-related income within LC&I increased as well. Net gains and losses on financial items at fair value increased by 31 per cent to SEK 1 118m (853). Net gains and losses on financial items at fair value within Group Treasury in Group Functions & Other improved. During the first half-year 2014 a change in the value of a strategic shareholding had a positive effect of SEK 80m. In 2013 the repurchase of government guaranteed bonds affected net gains and losses negatively. Net gains and losses on financial items at fair value within LC&I improved slightly. Other income increased by 40 per cent to SEK 2 147m (1 533). The acquisition of Sparbanken Öresund during the second quarter 2014 resulted in a bargain purchase gain of SEK 461m. In Share of the profit or loss of associates a one-off income of SEK 230m was recognised for Entercard (see also page 24). Sales activity within Ektornet was lower during the first half year than in the previous year since the portfolio is now significantly smaller. This negatively affected other income. Expenses increased by 12 per cent to SEK 9 145m (8 169). Excluding Sparbanken Öresund expenses rose by 3 per cent. Expenses increased the most within LC&I. Staff costs within the Group rose as a result of a higher number of advisors and IT-related staff as well as salary adjustments. IT development expenses increased as well. Reduced cash handling and the outsourcing of ATMs led to lower expenses for transport and security. During the first half-year 2014 SEK 136m was expensed within Group Functions & Other for the move of the head office, at the same time that expenses for Ektornet continued to decrease. Changes in exchange rates raised expenses by SEK 51m. Expense analysis Group Jan-Jun Jan-Jun ∆ SEKm 2014 2013 SEKm Swedish Banking excl Sparbanken Öresund 4 934 4 791 844 Sparbanken Öresund 701 0 0 Large Corporates & Institutions 1 638 1 557 81 Baltic Banking 1 228 1 241 -13 Group Functions & Other and eliminations 644 631 13 Total excl FX effects 9 145 8 220 925 FX effects 0 -51 51 Total 9 145 8 169 976 The number of full-time employees increased year-on- year by 331. Excluding the acquisition of Sparbanken Öresund, the number of full-time employees decreased by 117. Baltic Banking reduced the number of full-time
  • 9. Swedbank – Interim report January-June 2014 Page 9 of 60 employees by 417. Ektornet (Group Functions & Other) also reduced its number of employees. IT-related personnel within Group Functions & Other and the number of full-time employees within Swedish Banking and LC&I increased. The tax expense amounted to SEK 2 137m (1 889), corresponding to an effective tax rate of 20.4 per cent (20.3). The first half-year 2014 was negatively affected by the new policy on profit distributions from the Baltic operations. This means that about 60 per cent of profits generated by the Baltic subsidiaries from 2014 and going forward will be distributed to the parent company, Swedbank AB. Profit in Estonia is not taxed until its distribution. This means that deferred tax is already recognised on the estimated distribution from Estonia, even though it will not be paid out until the first quarter 2015. At the same time, tax was positively, affected by approximately the same amount due to the acquisition of Sparbanken Öresund. Profit posted from the bargain purchase is not taxable. Credit and asset quality The quality of the Group’s credit portfolio remains high. Lending increased during the quarter, mainly in private mortgages and corporate lending in Sweden. Conditions in the bank's home markets were good, with a further reduction in impaired loans and low credit impairments. Continued political tensions in Russia and Ukraine did not affect the credit portfolio. The bank is carefully monitoring developments and taking preventive steps closely with customers with business connections in the region. The Group’s direct credit exposure to Russia has decreased during the year and as of 30 June was SEK 0.9bn. The bank has no direct credit exposures to Ukraine. Swedbank’s lending increased by SEK 51.3bn or 4.2 per cent during the first half-year to SEK 1 266bn, of which SEK 4.7bn is due to currency effects. Of the increase, SEK 47bn related to the second quarter. In Sweden, mortgage lending rose by SEK 16.7bn. Corporate lending within Swedish Banking and LC&I increased by a total of SEK 28.8bn. The highest activity was in property management and telecoms. The acquisition of Sparbanken Öresund increased lending by SEK 16.5bn, of which SEK 5.0bn was private lending and SEK 11.5bn was corporate lending. In Baltic Banking, the lending portfolio increased slightly in Estonia and Latvia, calculated in local currency, while decreasing slightly in Lithuania. The average loan-to-value ratio for Swedbank’s mortgages in Sweden, based on property level, was 62.0 per cent as of 30 June (62.2 as of 31 December). Households with a loan-to-value ratio of over 75 per cent represent 16.1 per cent (16.3) of the portfolio. The average loan-to-value ratio for new mortgages in Sweden was 70.8 per cent (69.9) in 2014. Of new mortgages granted in Sweden in the last 12 months, 56.4 per cent have a loan-to-value ratio over 70 per cent. With respect to new lending in Sweden in the last 12 months, 92 per cent of households with a loan-to- value ratio over 75 per cent are amortising. For the Swedish portfolio as a whole, 74 per cent (74) of households with a loan-to-value ratio over 75 per cent are amortising. For the mortgage portfolio as a whole, 59 per cent (60) of households are amortising. The average loan-to-value ratio in Baltic Banking was 79.8 per cent (84.9), while the ratio for new lending was 53.8 per cent in 2014. Impaired loans fell during the year by SEK 1.2bn to SEK 6.3bn and correspond to 0.50 per cent (0.55) of total lending. The average provision ratio for impaired loans was 37.1 per cent. In addition there is portfolio provisions for unidentified impaired loans as an added safety margin, producing a total provision ratio of 56.3 per cent (54). The acquisition of Sparbanken Öresund increased impaired loans by SEK 0.3bn. In Baltic Banking, impaired loans fell by SEK 0.2bn to SEK 4.5bn, mainly due to the winding down of problem loans from 2008-2009 and improved quality in the loan portfolio. In Swedish Banking, impaired loans were unchanged during the first half-year. The share of Swedish mortgages past due by more than 60 days remained low at 0.08 per cent of the portfolio (0.09). The share of impaired mortgages in Baltic Banking fell. The share of mortgages past due by more than 60 days was 0.6 per cent in Estonia (0.7), 6.8 per cent in Latvia (7.4) and 4.0 per cent in Lithuania (4.4). Impaired loans, by business segment Q2 Q1 Q2 SEKm 2014 2014 2013 Swedish Banking 1 522 1 389 1 667 Large Corporates & Institutions 279 159 1 167 Baltic Banking 4 511 4 700 7 277 Estonia 1 297 1 322 1 835 Latvia 1 837 1 929 3 586 Lithuania 1 377 1 449 1 856 Total 6 312 6 248 10 111 Net recoveries during the first half-year amounted to SEK 70m (credit impairments of SEK 148m). The recoveries mainly relate to the Baltic mortgage portfolio and because several commitments are no longer classified as impaired owing to continued positive macro development. Credit impairments in Sweden remained low. The second quarter included credit impairments of SEK 30m, mainly related to new provisions for anticipated credit impairments within Swedish Banking. Baltic Banking reported continued recoveries, though at a lower level. Credit impairments, net by business segment Q2 Q1 Q2 SEKm 2014 2014 2013 Swedish Banking 25 31 36 Large Corporates & Institutions 21 -30 94 Baltic Banking -16 -101 -43 Estonia -25 -9 -36 Latvia 13 -65 18 Lithuania -4 -27 -25 Group Functions & Other 0 0 1 Total 30 -100 88 Repossessed assets amounted to SEK 1 558m on 30 June, a decrease of SEK 556m since 31 December 2013. Of these repossessed assets, Ektornet accounted for SEK 1 382m, of which SEK 17m relates to shares and participations. Ektornet’s property values were written down by SEK 204m during the first half-year, mainly related to Ukraine and the US, of which SEK 66m was in the second quarter. The remaining repossessed properties in Ukraine amounted to SEK 122m on 30 June. On the same date the number of
  • 10. Swedbank – Interim report January-June 2014 Page 10 of 60 properties, including apartments and suchlike, was 1 140 (1 366), of which 626 were in Latvia (783). For more information on repossessed assets, see page 35 of the fact book. Stress test – Internal Capital Adequacy Assessment Process 2014 Positive economic development in Swedbank’s home markets in 2013 improved the starting values for the scenario analysis within the Internal Capital Adequacy Assessment Process (ICAAP) for 2014. As a consequence of this and continued work to improve credit quality, the results of the scenario analysis demonstrate that Swedbank’s resilience to severe circumstances has further improved compared with the 2013 ICAAP. The selected recession scenario extends over five years, the first three of which show negative growth and high unemployment in Sweden, Estonia, Latvia and Lithuania. The trigger is a deepening crisis in the European banking sector, which creates uncertainty about the solvency of major financial institutions. Sweden is hit especially hard due to its dependency on exports, and SEK appreciates against EUR. In the Baltic countries, falling export demand weakens both investment and consumption. In the ICAAP scenario, net interest income drops by 7.5 per cent in 2014, mainly due to lower interest rates. Cumulative credit losses throughout the five-year scenario amount to SEK 25bn, with losses reaching their highest, SEK 9bn, in 2015. Swedbank’s capitalisation is strengthened throughout the scenario period thanks to continued profits and because the risk exposure amount is in line with or lower than the starting point. The improvement does not take into account measures by Swedbank’s executive management, which would have further improved the capitalisation. Swedbank’s resilience in a stress scenario is confirmed by both the Swedish Financial Supervisory Authority’s stress tests and the Riksbank’s most recent stability report. In the latter Swedbank’s capital ratios are the least affected among major Swedish banks and it is the best capitalised bank in terms of both its Common Equity Tier 1 capital ratio and leverage ratio at the end of the scenario period. For more information on Swedbank’s scenario simulation and its outcome, see page 63 in the fact book. Funding and liquidity During the first half-year 2014 Swedbank issued a total of SEK 69bn in long-term debt instruments, of which SEK 49bn related to covered bonds and SEK 20bn to senior unsecured debt. During the second quarter a total of SEK 32bn in long-term debt instruments was issued, including SEK 28bn in covered bonds and SEK 4bn in senior unsecured debt. Of the covered bonds, SEK 20bn was issued in SEK during the quarter. Demand for private placements remained high. For the full-year 2014 Swedbank plans to issue a total of about SEK 120bn to meet maturing long-term funding with a nominal value of SEK 103bn. Liquidity over and above the refinancing need is used in day-to-day management to repurchase covered bonds. The average maturity of all capital market funding arranged through the bank’s short- and long-term programmes was 29 months on 30 June 2014 (29 as of 31 December 2013). The average maturity of long-term funding issued during the first half-year was 61 months. The bank’s short-term funding is mainly used as a cash management tool, not to finance the bank’s lending to the public. Demand for Swedbank’s short-term debt instruments remained high and the outstanding volume of short-term funding increased by SEK 83bn during the first half-year to SEK 184bn. Swedbank left the government guarantee programme in April 2010 and in May 2014 the last government guaranteed bonds, issued in 2009, matured. Swedbank’s liquidity reserve, which is reported in accordance with the Swedish Bankers’ Association’s definition and is managed by Group Treasury, amounted to SEK 281bn on 30 June 2014 (243 as of 31 March). In addition to the liquidity reserve, liquid securities in other parts of the Group amounted to SEK 52bn (59 as of 31 March). The liquidity reserve and Liquidity Coverage Ratio (LCR) will fluctuate over time depending, among other things, on the maturity structure of the bank’s issued securities. The Group’s LCR was 123 per cent on 30 June (144 as of 31 March). Distributed by USD and EUR, LCR was 195 per cent (312 as of 31 March) and 289 per cent (586 as of 31 March) respectively. In early 2013 the Basel Committee published a new definition of LCR. According to Swedbank’s interpretation, LCR would have been 132 per cent as of 30 June (163 as of 31 December). According to Swedbank’s interpretation of the Basel Committee’s latest proposed revisions to the definition from January 2014, the Group’s Net Stable Funding Ratio (NSFR) was 102 per cent (102 as of 31 March). The main liquidity measure used by the Board of Directors and executive management is the so-called survival horizon, which shows how long the bank could manage when access to new financing were limited. At present the bank would survive more than 12 months with the capital markets completely shut down. This applies to the Group’s total liquidity as well as liquidity in USD and EUR. For more information on the above, see page 67 in the fact book. Ratings On 29 April Standard & Poor's (S&P) revised its outlook for the ratings of Swedbank and 50 European banks to negative. The revision was a consequence of the EU Parliament’s approval of the EU’s Bank Recovery and Resolution Directive (BRRD). S&P felt the directive increases the risk that investors in senior uncovered debt will be forced to absorb losses if a bank incurs financial problems. At the same time S&P raised Swedbank’s individual rating, mainly against the backdrop of the bank’s solid capitalisation. As a direct result, the rating on Swedbank’s subordinated debt was raised as well. On 29 May Moody’s also revised its outlook on Swedbank and a number of other European banks to negative due to the BRRD. Fitch revised its outlook for Swedbank’s rating to positive on 24 June. The revision was a direct result of
  • 11. Swedbank – Interim report January-June 2014 Page 11 of 60 the bank’s credit quality, stable earnings and strong capitalisation. Capital and capital adequacy On 13 June Swedbank received approval from the Swedish Financial Supervisory Authority to use the advanced internal ratings-based (A-IRB) approach for its corporate exposures in Sweden and Norway. This positively affected the Common Equity Tier 1 ratio by 3.8 percentage points as of 30 June. During the quarter the acquisition of Sparbanken Öresund was finalised as well, reducing the Common Equity Tier 1 ratio by 0.8 percentage points. Including these effects, the Common Equity Tier 1 ratio increased to 20.9 per cent on 30 June (18.3 per cent on 31 March and 31 December 2013). Common Equity Tier 1 capital increased by SEK 2.8bn during the quarter to SEK 84.9bn. The change was mainly due to the bank’s profit after deducting the anticipated dividend. The revisions in the recognition of pensions (IAS 19), effective 2013, create volatility in the estimated pension liability, which also affects equity through other comprehensive income. During the second quarter the calculated pension liability rose by about SEK 0.3bn, where the falling discount rate increased the debt, while a revised inflation assumption reduced it. See the note Statement of comprehensive income for more information. Other increases in the Common Equity Tier 1 capital include approximately SEK 0.5bn due to the approval of A-IRB. Change in Common Equity Tier 1 capital Basel 3, second quarter 2014, Swedbank consolidated situation 80.8 84.9 0.3 1.0 4.6 -3.1 82.1 40 45 50 55 60 65 70 75 80 85 90 SEKbn Increase Decrease The risk exposure amount (REA) decreased by SEK 42.1bn during the second quarter to SEK 406.7bn on 30 June (448.8 as of 31 March). The REA for credit risks decreased by SEK 43.5bn. The Swedish Financial Supervisory Authority’s approval allowing Swedbank to use A-IRB for corporate exposures reduced the REA by SEK 72.9bn, while the acquisition of Sparbanken Öresund and investments in Sparbanken Skåne increased the REA for credit risks by SEK 14.9bn. Increased exposures, mainly to corporate customers in Swedish Banking and LC&I, raised the REA by SEK 12.3bn. Positive rating migrations, mainly among corporate customers in Swedish Banking, reduced the REA by SEK 1.6bn. Fluctuations in exchange rates, mainly attributable to the Baltic credit portfolio, raised the REA for credit risks by SEK 0.7bn due to the depreciation of the Swedish krona against the euro. Other increases in the REA for credit risks include reclassifications of exposures and adjustments owing to the implementation of Basel 3. The REA for credit valuation adjustment (CVA risk), which arose in connection with the introduction of Basel 3, decreased by SEK 0.3bn during the second quarter. The REA for market risks was essentially unchanged. The REA for currency risks decreased by just over SEK 1bn, while market risks within LC&I increased by a corresponding amount. The REA for operational risks increased by SEK 1.6bn, mainly due to the acquisition of Sparbanken Öresund. Change in REA Basel 3, second quarter 2014, Swedbank consolidated situation -72.9 16.3 12.3 -1.6 -1.4 0.7 4.7 -0.3 0.1 0.2 440.6 448.8 406.7 360 370 380 390 400 410 420 430 440 450 460 SEKbn Increase Decrease Certain aspects of the EU’s new capital adequacy rules (based on Basel 3), which took effect on 1 January 2014, require introduction on a national basis. The new Swedish legislation takes effect in August 2014, at which point the Swedish Financial Supervisory Authority will be authorised to decide on the final Swedish capital requirements. On 8 May the Swedish Financial Supervisory Authority published a memo on the future capital requirements for Swedish banks. The memo covered the capital requirements for systemic risks for Sweden's four major banks, considerations regarding the countercyclical capital buffer and raising the risk weight floor for Swedish mortgages. It also clarified the process for Pillar 2. In a separate June memo, the Swedish Financial Supervisory Authority proposed a countercyclical buffer of 1.0 per cent for Swedish exposures, which will be applied as of September 2015. The Swedish Financial Supervisory Authority expects to decide on the future capital requirements and activation of the countercyclical buffer this autumn. In the Baltic countries, no decision has yet been made whether to activate the countercyclical buffer. Swedbank’s aggregate countercyclical buffer, based on a geographical distribution of its exposures, is estimated at just over 0.7 per cent. Not until the Swedish Financial Supervisory Authority has detailed its future capital requirements, including standardised models and capital requirements for Pillar 2, can the Board of Directors set a capital target. The Swedish Financial Supervisory Authority’s regulations adopted in June require companies to
  • 12. Swedbank – Interim report January-June 2014 Page 12 of 60 publish their internal assessment of the capital requirement. Given the proposal on standardised models for Pillar 2 risks, this will not be introduced before 1 January 2015, however, and will require publication as of the first quarter 2015. The previously announced risk weight floor of 15 per cent for the Swedish mortgage portfolio within Pillar 2 does not affect the reported capital ratios. Based, however, on an average risk weight of 4.2 per cent according to Pillar 1 in Swedbank’s Swedish mortgage portfolio on 30 June and the Swedish Common Equity Tier 1 capital requirement of 12 per cent (as of 2015), Swedbank will have to maintain additional Common Equity Tier 1 capital of SEK 9.6bn for Swedish mortgages. This corresponds to 2.4 percentage points of the Common Equity Tier 1 ratio according to Pillar 1. In its internal controls, Swedbank allocates capital to its mortgage business equivalent to the risk weight floor. The Swedish Financial Supervisory Authority’s intent to further increase the risk weight floor, to 25 per cent, and to include the countercyclical buffer in the calculation, means that Swedbank has to maintain additional Common Equity Tier 1 capital of SEK 20bn for its Swedish mortgages, corresponding to 4.9 percentage points of the Common Equity Tier 1 capital ratio according to Pillar 1. Swedbank’s leverage ratio was 4.3 per cent on 30 June (4.5 per cent on 31 March 2014 and 4.6 per cent on 31 December 2013). The decrease is due to the acquisition of Sparbanken Öresund and volume increases. According to the EU’s rules, the measure will be evaluated by the authorities prior to the possible introduction of a minimum requirement in 2018. An announcement in early July detailed how the BRRD will be implemented in Swedish law from January 2015. The new directive is complex and extensive, so it is unlikely that the Swedish law can take effect as early as 1 January 2015. The portions concerning capital and debt write-downs, “bail-ins”, will not be introduced until 2016. The purpose of the directive is to prevent crisis situations, improve crisis management and reduce the risk of taxpayers having to bear the cost of another banking crisis. Market risk The majority of the Group’s market risks are of a structural or strategic nature and are managed by Group Treasury. Structural interest rate risks arise when the maturity of the Group’s assets and liabilities, such as deposits and lending, do not coincide. The risks are managed within the given mandates by matching maturities directly or using various derivatives such as interest rate swaps. Net interest income sensitivity is also affected by structural risks in the bank’s deposit operations, where various products show different sensitivity to changes in market interest rates. Strategic currency risks arise primarily through risks tied to holdings in foreign subsidiaries and their financing. Market risks also arise in LC&I’s trading operations in connection with customer transactions and by maintaining a secondary market for various types of securities. Swedbank measures market risks with a Value-at-Risk (VaR 1) ) model, among other things. VaR by risk category 30 Jun 31 Dec SEKm Max Min Average 2014 2013 Interest risk 87 (97) 66 (65) 78(80) 78 66 Currency rate risk 16 (17) 3 (2) 9 (7) 6 10 Stock price risk 12 (9) 1 (2) 4 (5) 3 3 Diversification 0 0 -13 (-16) -10 -13 Total 87 (89) 67 (59) 78 (76) 77 66 Jan-Jun 2014 (2013) 1) The VaR model was supplemented during the year with new risk factors, due to which the figures for 2014 are not directly comparable with those for 2013. For individual risk types, VaR is complemented by various risk measures based on sensitivity to changes in market prices. Risk taking is also monitored with stress tests. An increase in all market interest rates of one percentage point as of 30 June 2014 would have increased the value of the Group’s assets and liabilities, including derivatives, by SEK 286m (75 as of 31 December 2013). This calculation includes parts of the bank’s deposits with a duration of two to three years. The effect on positions in SEK would have been SEK 337m (250), while the value of positions in foreign currency would have decreased by SEK 51m (-175). The Group’s net gains and losses on financial items at fair value would have been reduced by SEK 630m (-608), with the biggest contributions coming from the Group’s liquidity portfolio as well as the trading operations within LC&I. Operational risks The number of IT incidents fell year-on-year. The bank’s customers were affected by two major disruptions to the Internet Bank and Telephone Bank, however. This is in addition to brief disruptions in shared ATMs on five separate occasions, which affected the affiliated banks’ Swedish card customers. All the disruptions were considered serious and have been reported to the Swedish Financial Supervisory Authority. Swedbank has taken action to improve stability and ensure that its customers are not affected again. The bank’s direct losses attributable to operational risks remained low.
  • 13. Swedbank – Interim report January-June 2014 Page 13 of 60 Other events During the quarter Swedbank was nominated in the annual IR Magazine Awards for European companies in three categories: best Investor Relations (IR) in Northern Europe, best IR by a CEO (large cap) and best corporate governance and disclosure policy. Swedbank CEO Michael Wolf won first prize for best IR by a CEO. Swedbank also won an award for best IR in Sweden. On 17 June the Swedish Competition Authority sued the subsidiary Swedbank Franchise regarding its acquisition of Svensk Fastighetsförmedling. The Competition Authority is of the opinion that the acquisition will impede competition. Swedbank does not share the Competition Authority’s view of the effects of the acquisition and feels that the Competition Authority incorrectly considers franchisees to be subsidiaries of Swedbank Franchise. Swedbank therefore welcomes an impartial ruling by the courts. The legal process in the district court is expected to be completed by 17 December. Events after 30 June 2014 The Swedish Riksbank cut the repo rate by 0.50 basis points to 0.25 per cent on 9 July.
  • 14. Swedbank – Interim report January-June 2014 Page 14 of 60 Swedish Banking  Increased corporate and mortgage volumes  Positive stock market performance and increased fund savings strengthen commission income  Acquisition of Sparbanken Öresund improves market position in southern Sweden Income statement Q2 Q1 Q2 Jan-Jun Jan-Jun SEKm 2014 2014 % 2013 % 2014 2013 % Net interest income 3 362 3 314 1 3 368 0 6 676 6 699 0 Net commission income 1 790 1 649 9 1 548 16 3 439 3 138 10 Net gains and losses on financial items at fair value 54 50 8 33 64 104 67 55 Share of profit or loss of associates 410 256 60 197 666 401 66 Other income 613 153 170 766 389 97 Total income 6 229 5 422 15 5 316 17 11 651 10 694 9 Staff costs 1 360 919 48 871 56 2 279 1 732 32 Variable staff costs 52 51 2 67 -22 103 115 -10 Other expenses 1 746 1 442 21 1 424 23 3 188 2 884 11 Depreciation/amortisation 34 31 10 30 13 65 60 8 Total expenses 3 192 2 443 31 2 392 33 5 635 4 791 18 Profit before impairments 3 037 2 979 2 2 924 4 6 016 5 903 2 Credit impairments 25 31 -19 36 -31 56 91 -38 Operating profit 3 012 2 948 2 2 888 4 5 960 5 812 3 Tax expense 563 640 -12 623 -10 1 203 1 254 -4 Profit for the period 2 449 2 308 6 2 265 8 4 757 4 558 4 Profit for the period attributable to the shareholders of Swedbank AB 2 445 2 304 6 2 264 8 4 749 4 555 4 Non-controlling interests 4 4 0 1 8 3 Return on allocated equity, % 29.7 28.3 27.8 29.0 27.9 Loan/deposit ratio, % 246 250 243 246 243 Credit impairment ratio, % 0.01 0.01 0.02 0.01 0.02 Cost/income ratio 0.51 0.45 0.45 0.48 0.45 Loans, SEKbn 987 949 4 919 7 987 919 7 Deposits, SEKbn 401 379 6 378 6 401 378 6 Full-time employees 5 446 4 996 9 4 921 11 5 446 4 921 11 Development January - June The result for the period amounted to SEK 4 749m (4 555). Sparbanken Öresund is consolidated in Swedbank’s accounts from the 21 May; see also page 6. Income and expenses both increased, while credit impairments were stable. Impact of Sparbanken Öresund Running business One-offs Total SEKm Net interest income 48 0 48 Net commission income 18 0 18 Net gains and losses on financial items at fair value -2 0 -2 Other income 15 461 476 Total income 79 461 540 Staff costs 47 393 440 Other expenses 39 222 261 Total expenses 86 615 701 Credit impairments 4 0 4 Tax expense -2 -135 -137 Profit for the period attributable to the shareholders of Swedbank AB -9 -19 -28 Net interest income was stable compared with the previous year. Higher volumes of deposits and lending largely offset lower deposit margins, which were adversely affected by declining market interest rates. Net interest income was also stable compared with the first quarter. Increased lending margins and slightly improved mortgage margins at the end of the quarter were offset by lower deposit margins. Household deposit volumes increased by SEK 11bn since the beginning of the year, with volumes from the acquisition of Sparbanken Öresund accounting for SEK 8bn. Swedbank’s share of household deposits was 21 per cent at the end of the period (21 per cent as of 31 December 2013). Corporate deposits within Swedish Banking increased by SEK 5bn since the beginning of the year, or by 5 per cent. Sparbanken Öresund accounted for SEK 4bn. Swedbank’s market share, including corporate deposits within LC&I, was 19 per cent as of 31 May (18 per cent as of 31 December 2013). Household mortgage lending volume increased by SEK 17bn since the beginning of the year, of which SEK 12bn during the second quarter. Swedbank’s share of new sales continued to improve during the second quarter. Its share of net growth, excluding Sparbanken Öresund, was 22 per cent, compared with 18 per cent in the first quarter. Swedbank’s share of the total market
  • 15. Swedbank – Interim report January-June 2014 Page 15 of 60 was 25 per cent (25 per cent as of 31 December 2013). Corporate lending volume increased by SEK 26bn since the beginning of the year, with Sparbanken Öresund accounting for SEK 11bn. Swedbank’s market share, including corporate lending within LC&I, was stable at 18 per cent (17 per cent as of 31 December 2013). Net commission income rose by 10 per cent compared with the same period in 2013. The increase was mainly due to higher fund volumes in the wake of stock market gains and increased net inflows. Swedbank’s market share in terms of assets under management was 23 per cent (24 per cent as of 31 December 2013). Increased lending and guarantee commissions as well as real estate brokerage and equity trading revenue contributed as well. Compared with the first quarter, net commission income rose by 9 per cent mainly due to higher asset management revenue. The share of associates’ profit increased due to one-off income of SEK 230m from the credit card company Entercard after a distribution partner terminated their collaboration and recalled their outstanding credit cards. Other income was positively affected during the second quarter by the acquisition of Sparbanken Öresund. During the second quarter of 2014 a bargain purchase gain of SEK 461m was recognised. Expenses for the first half-year increased mainly due to the acquisition of Sparbanken Öresund. Excluding Sparbanken Öresund they rose by 3 per cent year-on- year. Staff costs were higher due to an increase in advisors and higher salary costs. Cash handling expenses fell. Expenses for the second quarter, excluding Sparbanken Öresund, were stable. In connection with the acquisition SEK 591m was expensed for a restructuring reserve covering, among other things, system solutions and the divestment of branches. Total one-off costs from the acquisition were SEK 615m. Credit quality remained good. Credit impairments decreased compared with the previous year and remain at the same level as in the first quarter. The share of impaired loans was 0.15 per cent (0.16). The risk exposure amount was SEK 179bn, a decrease of SEK 10bn during the quarter. The Swedish Financial Supervisory Authority’s approval of A-IRB for corporate exposures reduced the risk exposure amount by SEK 34bn. The acquisition of Sparbanken Öresund and investments in Sparbanken Skåne increased the risk exposure amount by SEK 16bn. Excluding these one-off effects the risk exposure amount rose by SEK 7bn, mainly as a result of increased corporate lending. A number of services with new or improved functions were launched in the bank's digital channels during the quarter. One example is Swish for corporates, which allows small companies, organisations and associations to manage payment flows between consumers and companies. A new payment terminal introduced for small retailers and non-profits, Babs Micro, can accept card payments without access to a fixed terminal. The mobile terminal connects wirelessly by mobile phone. Additional functions have been added to the Mobile Bank as well, including an expense tracker that makes it easier for private customers to manage their spending. Use of Swedbank’s digital channels continues to grow. The Internet Bank had 3.6 million users as of 30 June, an increase of 44 000 during the year. The Mobile Bank had 1.8 million (+204 000) and the iPad Bank had 466 000 (+81 000). As of 30 June there were 1.4 million Swish users across Swedish banks, an increase of 641 000 in 2014. Swedbank and the savings banks’ share was 41.3 per cent. Card usage continues to increase. As of 31 May 2014 the total number of card purchases in stores had increased by 10 per cent, and the aggregate value by 8 per cent, compared with the same period a year earlier. Sweden is Swedbank’s largest market, with around 4 million private customers and more than 250 000 corporate customers. This makes it Sweden’s largest bank by number of customers. Through our digital channels (Telephone Bank, Internet Bank and Mobile Bank) and branches, and with the support of savings banks and franchisees, we are always available. Swedbank is part of the local community. Our branch managers have the mandate to act in their local communities. The bank’s presence and engagement are expressed in various ways. A project called “Young Jobs”, which has created several thousand trainee positions for young people, has played an important part in recent years. Swedbank has 320 branches in Sweden. The various product areas are described on page 23.
  • 16. Swedbank – Interim report January-June 2014 Page 16 of 60 Large Corporates & Institutions  High lending activity among large corporates  Continued strong IPO earnings  Good bond issuance activity Income statement Q2 Q1 Q2 Jan-Jun Jan-Jun SEKm 2014 2014 % 2013 % 2014 2013 % Net interest income 846 867 -2 851 -1 1 713 1 634 5 Net commission income 496 630 -21 522 -5 1 126 942 20 Net gains and losses on financial items at fair value 575 565 2 503 14 1 140 1 082 5 Other income 28 37 -24 49 -43 65 80 -19 Total income 1 945 2 099 -7 1 925 1 4 044 3 738 8 Staff costs 323 322 0 293 10 645 581 11 Variable staff costs 75 75 0 104 -28 150 192 -22 Other expenses 392 415 -6 427 -8 807 771 5 Depreciation/amortisation 14 22 -36 12 17 36 25 44 Total expenses 804 834 -4 836 -4 1 638 1 569 4 Profit before impairments 1 141 1 265 -10 1 089 5 2 406 2 169 11 Impairment of intangible assets 0 0 56 0 56 Impairment of tangible assets 0 0 0 0 0 Credit impairments 21 -30 94 -78 -9 168 Operating profit 1 120 1 295 -14 939 19 2 415 1 945 24 Tax expense 225 292 -23 257 -12 517 473 9 Profit for the period 895 1 003 -11 682 31 1 898 1 472 29 Profit for the period attributable to the shareholders of Swedbank AB 895 1 003 -11 682 31 1 898 1 472 29 Return on allocated equity, % 23.1 26.9 14.4 24.8 15.6 Loan/deposit ratio, % 161 153 219 161 219 Credit impairment ratio, % 0.04 -0.06 0.17 -0.01 0.14 Cost/income ratio 0.41 0.40 0.43 0.41 0.42 Loans, SEKbn 157 152 3 151 4 157 151 4 Deposits, SEKbn 98 99 -1 69 42 98 69 42 Full-time employees 1 120 1 094 2 1 032 9 1 120 1 032 9 Development January - June The result for the period amounted to SEK 1 898m, an increase of 29 per cent year-on-year. The result was positively affected by increased lending-related income as well as income from IPOs and bond issues. The long-term strategy to strengthen expertise in specific industrial sectors and improve customer relations in these areas has produced results in the form of increased business and new customers during the year. Net interest income increased by 5 per cent during the first half-year compared with the same period in 2013. Higher average lending volumes and origination fees also contributed to the improvement. Margins in the lending portfolio improved slightly. Lending volume was 4 per cent higher year-on-year, gaining SEK 6bn. Net interest income fell by 2 per cent on a quarterly basis to SEK 846m mainly due to lower origination fees on the capital market side. Lending volumes increased by SEK 5bn during the quarter thanks to a higher take-up rate and higher sales, mainly in the real estate and telecoms sectors. Lending activity among large corporates was high due to the refinancing of maturing loans. The lending margin on the entire loan portfolio was stable compared with the first quarter, but with continued pressure on new loan margins. Deposit volumes were higher than in the same period in 2013 and stable against the previous quarter. The year-on- year gain is a result of increased business with existing customers and temporary deposit increases from a few major customers. Net commission income rose by 20 per cent to SEK 1 126m compared with the first half-year 2013. The current low interest rate environment and high stock prices have led to increased activity among the bank’s corporate customers, which increased income from corporate finance and lending-related commissions. Swedbank participated in five of nine IPOs in Sweden during the first half-year, making it one of the two market leaders. During the second quarter net commission income fell by 21 per cent to SEK 496m, partly due to one-off income and high bond-related income in Norway in the first quarter. Bond issuance and IPO activity was high as well during the second quarter, with continued strong earnings. During the second quarter Swedbank participated as advisor in Recipharm’s and Akelius’ listings on the Swedish stock exchange. Several major bond issues were completed as well, including for Hemfosa in Sweden and Harkand in Norway. Swedbank’s market share for Swedish issues was 18.4 per cent in 2014 (19.4). The corresponding figure in Norway was 17.6 per cent (16.6). This made Swedbank the third largest player in Sweden and second largest in Norway.
  • 17. Swedbank – Interim report January-June 2014 Page 17 of 60 Net gains and losses on financial items at fair value increased by 5 per cent to SEK 1 140m compared with the first half-year 2013. The biggest contributor to the increase came from bond and fixed income trading, where customer activity was higher than in the same period in 2013. Compared with the first quarter net gains and losses on financial items were stable despite low volatility in the financial markets, which led to slightly lower customer activity. Total expenses increased by 4 per cent to SEK 1 638m compared with the same period in 2013. Staff costs rose as a result of wage increases and because of a conscious effort to expand advisory services for bond issues and corporate finance. The development of new products as well as IT investments in the wake of increased regulatory requirements raised expenses for IT and IT-related personnel. Compared with the previous quarter expenses decreased by 4 per cent. Credit quality in the loan portfolio has remained good. Net recoveries of SEK 9m were reported during the quarter, compared with credit impairments of SEK 168m in the same period in 2013. The share of impaired loans was 0.11 per cent (0.49). The risk exposure amount decreased by SEK 32bn during the quarter to SEK 117bn. The risk exposure amount for credit risk decreased by SEK 33bn. The transition to A-IRB for corporate exposures accounted for SEK 39bn of the decrease. Excluding A-IRB the risk exposure rose by SEK 6bn, mainly as a result of increased lending. Large Corporates & Institutions is responsible for Swedbank’s offering to customers with revenues above SEK 2 billion and those whose needs are considered complex due to multinational operations or a need for sophisticated financing solutions. The business segment is also responsible for developing corporate and capital market products for other parts of the bank and the Swedish savings banks. LC&I works closely with customers, who receive advice on decisions that create sustainable profits and sustainable growth in the long-term. The business segment has around 1 100 employees at branches in Sweden, Norway, Estonia, Latvia, Lithuania, Finland, Luxembourg, China and the US.
  • 18. Swedbank – Interim report January-June 2014 Page 18 of 60 Baltic Banking  Solid financial results and good business activity  High cost efficiency  No impact from conflict between Russia and Ukraine Income statement Q2 Q1 Q2 Jan-Jun Jan-Jun SEKm 2014 2014 % 2013 % 2014 2013 % Net interest income 894 874 2 763 17 1 768 1 505 17 Net commission income 522 429 22 445 17 951 833 14 Net gains and losses on financial items at fair value 62 53 17 72 -14 115 134 -14 Other income 118 109 8 98 20 227 188 21 Total income 1 596 1 465 9 1 378 16 3 061 2 660 15 Staff costs 193 187 3 197 -2 380 394 -4 Variable staff costs 19 20 -5 9 39 27 44 Other expenses 374 364 3 355 5 738 696 6 Depreciation/amortisation 35 36 -3 33 6 71 66 8 Total expenses 621 607 2 594 5 1 228 1 183 4 Profit before impairments 975 858 14 784 24 1 833 1 477 24 Impairment of intangible assets 1 0 0 1 0 Impairment of tangible assets 3 -5 2 50 -2 6 Credit impairments -16 -101 -84 -43 -63 -117 -113 4 Operating profit 987 964 2 825 20 1 951 1 584 23 Tax expense 158 137 15 67 295 127 Profit for the period 829 827 0 758 9 1 656 1 457 14 Profit for the period attributable to the shareholders of Swedbank AB 829 827 0 758 9 1 656 1 457 14 Return on allocated equity, % 15.6 15.2 13.4 15.3 12.7 Loan/deposit ratio, % 99 101 108 99 108 Credit impairment ratio, % -0.06 -0.34 -0.15 -0.20 -0.20 Cost/income ratio 0.39 0.41 0.43 0.40 0.44 Loans, SEKbn 122 118 3 119 3 122 119 3 Deposits, SEKbn 122 117 4 110 11 122 110 11 Full-time employees 3 822 3 853 -1 4 239 -10 3 822 4 239 -10 Development January - June Profit for the first half-year amounted to SEK 1 656m (1 457) and the return on allocated equity reached 15.3 per cent (12.7). The increase was mainly due to higher income, while expenses and recoveries were about the same level year-on-year. The ongoing conflict between Russia and Ukraine has affected profits. Net interest income increased by 12 per cent in local currency compared with the first half-year 2013. Increased deposit volumes, higher Euribor rates and repricing affected net interest income positively. The repricing of corporate loans to reflect the higher costs of capital and regulatory changes will continue throughout 2014. Fluctuations in exchange rates increased net interest income by SEK 84m. Net interest income in local currency were more or less unchangedin a comparison of the first and second quarters. Lending volumes decreased by 1 per cent in local currency compared with 31 December 2013. This was mainly due to portfolio amortisations and lower new sales during the first quarter. The decrease came from corporate lending and private mortgages, while consumer finance increased. Lending portfolios decreased in Estonia and Latvia, but increased in Lithuania. During the second quarter the Baltic loan portfolio increased slightly. Swedbank’s market share for lending was 29 per cent as of 31 March (28 as of 31 December 2013). Deposit volumes in local currency were stable during the first half-year. Deposits increased in Estonia and Lithuania, but decreased in Latvia as more cash than usual was deposited in the fourth quarter 2013 ahead of the country’s euro transition on 1 January 2014. Swedbank’s market share in deposits was 29 per cent as of 31 March (28 per cent as of 31 December 2013). The loan-to-deposit ratio was 99 per cent (100 per cent as of 31 December 2013). Net commission income rose by 9 per cent in local currency compared with the first half-year 2013. The improvement was mainly due to increased customer activity, as reflected by higher card related income, as well as growing asset management volumes following the stock market’s positive performance. The number of active customers increased by 40 000 since 30 June 2013 to 2.6 million. During the second quarter one-off income of SEK 35m was recognised for a previous fine levied on the Lithuanian operations in the fourth quarter 2012, which was reversed on appeal. Net commission income was negatively affected by about SEK 40m due to the euro transition in Latvia, which resulted in fewer international payments. Compared with the first quarter net commission income rose by 19 cent in local currency, mainly due to a one-off income in Lithuania and seasonally higher card and payment commissions.
  • 19. Swedbank – Interim report January-June 2014 Page 19 of 60 Net gains and losses on financial items at fair value decreased by 19 per cent in local currency compared with the first half-year 2013. The decrease was mainly due to lower income from the Latvian FX trading business of SEK 36m as a result of the euro transition. Other income for the first half-year increased by 16 per cent in local currency compared with the same period in 2013 due to higher insurance-related income and a VAT refund on transfer pricing of invoices in Latvia. Total expenses decreased by 1 per cent in local currency year-on-year, mainly due to lower expenses for staff, premises and marketing. The number of full time employees on 30 June was 10 per cent lower than a year earlier. At the same time the number of branches has been reduced by 11 to 174 in the last 12 months, of which 36 are now cash-smart branches with a focus on advisory services. The cost-income ratio improved during the first half-year to 0.40 (0.44). Net recoveries amounted to SEK 117m, compared with SEK 113m in the first six months of 2013. All three countries reported recoveries. Swedbank is taking preventive measures to help its customers affected by the current geopolitical situation. No major spillover effects have been observed as yet on business activity or our customers’ finances. Impaired loans continued to decrease in all three countries during the first half-year to SEK 4.5bn (5.0 as of 31 December 2013). Credit quality has improved to such a level that the decrease in impaired loans is expected to be moderate in 2014 compared with the last two years. The risk exposure amount rose by SEK 2bn during the quarter to SEK 83bn. The whole increase is related to credit risk, the majority of which is attributable to increased corporate and FX exposures. At the same time the Swedish Financial Supervisory Authority’s approval to update the risk classification models for retail customers and small businesses contributed to a reduction in the risk exposure amount. Lithuania is preparing to adopt the euro on 1 January 2015. A formal decision will be made at the end of July 2014. The likelihood of approval is considered high since the relevant EU institutions have already supported Lithuania’s euro adoption. The bank’s expenses related to the euro transition in Latvia and Lithuania are estimated at SEK 84m in 2014, of which SEK 27m has been recognised during the first half-year. In 2014 Swedbank adopted a new policy on profit distributions from the Baltic operations, whereby around 60 per cent of earnings generated in the Baltic subsidiaries as of 2014 will be distributed to the parent company, Swedbank AB. Profit in Estonia is not taxed until its distribution, which means that deferred tax is now recognised on the estimated distribution from Estonia, even though it will not be paid until the first quarter 2015. For the first half-year 2014 deferred tax of SEK 102m has been recognised for future distributions. In brand reputation surveys in Estonia and Latvia during the second quarter Swedbank ranked first among financial institutions and number two among all companies. Swedbank is the largest bank by number of customers in Estonia, Latvia and Lithuania, with around 4 million private customers and more than 250 000 corporate customers. According to surveys, Swedbank is also the most respected company in the financial sector. Through its digital channels (Telephone Bank, Internet Bank and Mobile Bank) and branches, the bank is always available. Swedbank is part of the local community. Its local social engagement is expressed in many ways, with initiatives to promote education, entrepreneurship and social welfare. Swedbank has 50 branches in Estonia, 54 in Latvia and 70 in Lithuania. The various product areas are described on page 23.
  • 20. Swedbank – Interim report January-June 2014 Page 20 of 60 Group Functions & Other Income statement Q2 Q1 Q2 Jan-Jun Jan-Jun SEKm 2014 2014 % 2013 % 2014 2013 % Net interest income 419 424 -1 425 -1 843 921 -8 Net commission income -14 -31 -55 -10 40 -45 -37 22 Net gains and losses on financial items at fair value 82 -323 -312 -241 -430 -44 Share of profit or loss of associates 0 0 0 0 2 Other income 249 322 -23 321 -22 571 621 -8 Total income 736 392 88 424 74 1 128 1 077 5 Staff costs 819 810 1 798 3 1 629 1 585 3 Variable staff costs 60 53 13 52 15 113 123 -8 Other expenses -615 -553 11 -575 7 -1 168 -1 162 -1 Depreciation/amortisation 89 90 -1 93 -4 179 188 -5 Total expenses 353 400 -12 368 -4 753 734 3 Profit before impairments 383 -8 56 375 343 9 Impairment of intangible assets 0 0 114 0 114 Impairment of tangible assets 66 140 -53 200 -67 206 281 -27 Credit impairments 0 0 1 0 2 Operating profit 317 -148 -259 169 -54 Tax expense 117 5 -34 122 35 Profit for the period from continuing operations 200 -153 -225 47 -89 Profit for the period from discontinued operations, after tax -230 -27 -1 887 -88 -257 -2 277 -89 Profit for the period -30 -180 -83 -2 112 -99 -210 -2 366 -91 Profit for the period attributable to the shareholders of Swedbank AB -30 -181 -83 -2 112 -99 -211 -2 367 -91 Non-controlling interests 0 1 0 1 1 0 Full-time employees 4 294 4 327 -1 4 159 3 4 294 4 159 3 Development January - June Income for Group Functions & Other consists of net interest income and net gains and losses on financial items, which mainly come from Group Treasury. Other income primarily consists of revenue from the savings banks as well as sales revenue and operating income from Ektornet. Income amounted to SEK 1 128m (1 077). Net gains and losses on financial items at fair value within Group Treasury improved due to a SEK 80m change in the value of a strategic shareholding. In 2013 an offer to repurchase government guaranteed bonds negatively affected net gains and losses. During the first quarter 2014 negative FX effects of SEK 74m were recognised in Ektornet related to the depreciation of the Ukrainian hryvnia. Other income included a property sale in Russia during the first quarter, which positively affected other income by SEK 83m. Sales activity within Ektornet has slowed since the portfolio has already been largely sold off, which has reduced other income. Expenses for Group Functions & Other increased by 3 per cent to SEK 753m (734) compared with the same period in 2013. Excluding the net of services purchased and sold internally, expenses increased by 5 per cent to SEK 3 508m (3 340). The increase was mainly due to one-off expenses of SEK 136m in connection with the move of the head office and higher IT development expenses and staff costs. This was partly offset by lower expenses in Ektornet, where property management expenses are dropping as the portfolio is divested. Ektornet’s property values were written down by SEK 204m (281). The writedowns related to Ukraine and the US. Group Products Swedbank’s product operations, Group Products (GP), are centralised at the Group level to create a more responsive and customer-driven product range and an efficient product organisation. Consisting of around 1 800 employees in Sweden, Estonia, Latvia and Lithuania, GP is responsible for a large part of Swedbank’s product areas. It is also tasked with supporting the business areas by reducing the complexity of the product range and simplifying sales in the various distribution channels. The product areas that GP is responsible for – lending and deposits, payments, cards, asset management and insurance – are described in more detail starting on page 23. GP also comprises the subsidiary Swedbank Franchise AB, which in turn includes the real estate (Fastighetsbyrån and Svensk Fastighetsförmedling) and business brokerages (Företagsförmedling) and a legal service provider (Juristbyrån). In GP’s revenue and expense model, revenue from Swedbank’s customers is posted by each business segment and GP receives compensation from them to cover its expenses. GP’s external revenue largely comes from the savings banks. Expenses, excluding the net of services purchased and sold internally, amounted to SEK 1 682m (1 603) for the first half-year. The cost increase was mainly due to IT operations and development, marketing and depreciation/amortisation.
  • 21. Swedbank – Interim report January-June 2014 Page 21 of 60 Group Treasury Group Treasury is responsible for the bank’s funding, liquidity and capital planning. The Group’s equity is allocated to each business segment on the basis of capital adequacy rules and how much capital is needed based on the bank's Internal Capital Adequacy Assessment Process (ICAAP). Group Treasury prices all internal deposit and loan flows in the Group through internal interest rates, where the most important parameters are maturity, interest fixing period, currency and need for liquidity reserves. Group Treasury’s result over time should be nearly nil, with the exception of earnings that may arise in debt and liquidity management within given risk mandates. Risk hedging by Group Treasury is generally achieved with financial instruments. The volatility in results over time is largely due to accounting-based fluctuations in these hedges. Net interest income for the first half-year 2014 decreased to SEK 904m (990). The positive effects of repurchases were greater in 2013. In the second quarter 2013 net interest income was stable. Net gains and losses on financial items at fair value for the first half-year 2014 amounted to SEK -166m, compared with SEK -462m in the same period in the previous year. The main reason for the negative net result is the impact of covered bond repurchases, which have a corresponding positive effect on net interest income over time. Net gains and losses on financial items at fair value for the second quarter 2014 was SEK 81m, compared with SEK -247m for the first quarter. A change in value related to a strategic shareholding positively affected net gains and losses on financial items at fair value by SEK 80m in the second quarter. The second quarter also benefits from the positive effects of falling interest rates and lower negative effects due to lower repurchase volumes compared with the first quarter. Russia The Russian operations are reported since 2013 as discontinued operations. The result for the first half-year for discontinued operations was SEK -257m (-2 277). In the first half-year 2013 the Ukrainian operations were included in discontinued operations and affected the result by SEK -2 236m. When the Ukrainian operations were sold in the second quarter 2013, SEK -1 875m was reclassified to profit or loss from other comprehensive income. A corresponding reclassification of SEK -223m was made during the second quarter 2014 for the winding down of the Russian operations. Remaining equity in the Russian operations amounts to SEK 212m, with remaining negative FX differences of SEK 11m as of 30 June. Swedbank’s net lending in Russia (including leasing) amounted to SEK 0.9bn as of 30 June. The lending portfolio in Russia, mainly consisting of good quality corporate loans, will decrease as customers amortise their loans. Group Functions & Other consists of centralised business support units: Group Products, Group Staffs, and the remaining operations in Russia. Group staffs, comprise Accounting & Finance (including Group Treasury and Communication), Risk, IT, Compliance, Public Affairs, HR and Legal, operate across business areas and serve as strategic and administrative support.
  • 22. Swedbank – Interim report January-June 2014 Page 22 of 60 Eliminations Income statement Q2 Q1 Q2 Jan-Jun Jan-Jun SEKm 2014 2014 % 2013 % 2014 2013 % Net interest income 0 4 2 4 3 33 Net commission income 19 16 19 20 -5 35 37 -5 Net gains and losses on financial items at fair value 0 0 0 0 0 Other income -70 -78 10 -86 19 -148 -148 0 Total income -51 -58 12 -64 -20 -109 -108 -1 Staff costs 0 0 0 0 0 Variable staff costs 0 0 0 0 0 Other expenses -51 -58 12 -64 -20 -109 -108 -1 Depreciation/amortisation 0 0 0 0 0 Total expenses -51 -58 12 -64 -20 -109 -108 -1 Group eliminations mainly consist of eliminations of internal transactions between Group Functions and the other business segments.
  • 23. Swedbank – Interim report January-June 2014 Page 23 of 60 Product areas Swedbank is a market leader in a number of its product areas, including asset management, cards, payments and mortgage lending. Responsibility for the product units rests with Group Products (Group Functions & Other), but the results are reported in several legal units and in the three business segments. Lending/deposits Lending products account for about 62 per cent of Swedbank’s assets on the balance sheet. Swedbank’s lending operations are concentrated in Sweden, Estonia, Latvia, Lithuania and Norway. Swedbank’s total lending to private customers and corporations amounted to SEK 1 266bn (1 215 as of 31 December 2013). Household lending is the largest part, with mortgages to private customers and tenant-owner associations in Sweden accounting for about 57 per cent. Swedbank’s market share for mortgages in Sweden is 25 per cent. Over one million customers obtain their mortgages through Swedbank Mortgage, and lending is geographically spread throughout the country. Swedbank is also a major player in corporate lending in Sweden, with lending of SEK 359bn and a market share of 18 per cent as of 30 June (17 per cent as of 31 December 2013). Major sectors in Sweden include property-related lending, which accounts for SEK 186bn, and the forestry and agricultural sector, which accounts for SEK 71bn and where Swedbank has a dominant position. Swedbank is the largest lender in the Baltic countries, with market shares of 17-34 per cent. Estonia accounts for nearly half of Swedbank’s Baltic loan portfolio, and there Swedbank has a market share of over 34 per cent. Total lending in the Baltic countries amounts to SEK 122bn, half of which is to households and half to companies. Major sectors for corporate lending in the Baltic countries include commercial real estate and manufacturing. Swedbank is also a major player in deposits in its home markets. Total deposit volumes as of 30 June amounted to SEK 669bn (599), of which SEK 357bn (341) was to private customers and SEK 312bn (258) to corporate customers. Just over 73 per cent of Swedbank’s total deposit volumes is in Sweden. For more information on Swedbank’s lending and deposits, see each business segment. Payment operations Swedbank is a leader in payment and cash management products in its four home markets. Growth in the payment area is based on economic growth and on customers’ increasing use of payment means other than cash. The payment area is strongly affected by changes in the operating environment. Rapid technological developments are creating a challenge in the form of increased competition, especially from e-commerce companies. Swedbank is well prepared in this regard in terms of infrastructure, economies of scale and its long history of strong consumer protection, an important factor as e-commerce grows. Over time regulatory changes will increase competition in selected parts of the payment area, which will have to be addressed mainly with cost efficiencies. A growing share of customers is managing their payments digitally. Today over 3 million of the bank’s customers in Sweden and 2.2 million in the Baltic countries have access to payment services through the Internet Bank and the Mobile Bank. The number of transactions through these channels grew by 14.9 per cent during the first half of 2014 year-on-year. Users of Mobile BankID, which facilitates online and mobile payments, are steadily increasing in number and now number over 1 070 000, compared with 460 000 on 30 June 2013. Users of Swish, a solution for mobile payments shared with other Swedish banks, are also increasing and at the end of the quarter amounted to 1.4 million. The service will remain free for Swedbank’s private customers. In June 2014 a commercial version of Swish was launched to allow small businesses, associations and organisations to accept payments from individuals. Payments Jan-Jun Jan-Jun Income, SEKm 2014 2013 % Net commission income 491 512 -4 of which Nordic countries 206 271 -24 of which Baltic countries 286 241 19 Net commission income for the first half of 2014 was 4 per cent lower year-on-year. The outsourcing of ATMs to Bankomat AB reduced the net commission income by SEK 56m, while a repayment of SEK 35m from the Lithuanian competition authority increased it. Excluding these items net commission income was stable. In the Nordic region the decrease was 3 per cent while it increased by 4 per cent in the Baltic countries. Commission income increased due to higher volumes of domestic payments in the Nordic region (12 per cent) and the Baltic countries (10 per cent), while commission expenses were unchanged or lower as a result of proactive measures to reduce them. Commission income from international payments increased by 5 per cent in the Nordic region, but decreased by 19 per cent in the Baltic countries due to the euro adoption in Latvia. Payments Jan-Jun Jan-Jun Key figures 2014 2013 % International payments (million) 5.1 4.9 4 of which Sweden 2.3 2.2 5 of which Baltic countries 2.8 2.7 4 Domestic payments (million) 1) 442.1 421.5 5 of which Sweden 329.1 312.1 5 of which Baltic countries 113.0 109.4 3 E-services payments (million) 2) 150.8 89.5 68 of which Sweden 132.4 78.4 69 of which Baltic countries 18.3 11.1 65 Factoring portfolio, SEKm 4 301 4 446 -3 of which Sweden 2 255 2 238 1 of which Baltic countries 2 046 2 208 -7 1) Domestic payments include salary and mass payments, giro payments, direct debit payments, internet payments. 2) E-services payments include e-invoices, bank link payments, mobile phone top-up transactions, number of signed transactions and ID transactions through E-ID/BankID.
  • 24. Swedbank – Interim report January-June 2014 Page 24 of 60 Card business Swedbank issues cards to the public and acquires card payments from merchants in all its home markets as well as in Denmark and Norway. When one of its cards is used to pay in a store, Swedbank, as the issuer, receives a commission from the merchant’s payment acquirer. Conversely, Swedbank pays a commission to the card issuer when it acquires card payments from merchants. The payment acquisition business was recently expanded to Finland. The credit card operations in Sweden, Denmark and Norway are managed by Entercard AB, a joint venture with Barclays Bank. Swedbank owns 50 per cent of Entercard. Other card business takes place within the bank. Swedbank’s aggregate market share for the card business in its home markets is about 50 per cent. Swedbank is Europe’s fifth largest card payment acquirer based on number of transactions. In this capacity, Swedbank enables retailers to accept payment through card terminals and online. Revenue mainly comes from the transaction fees retailers pay for access to infrastructure, administration, risk hedging and payment guarantees. As a payment acquirer, Swedbank incurs expenses for the above-mentioned commissions to card issuers as well as for operations and service. Rapidly expanding e-commerce is an important growth area for Swedbank. For retailers, the bank offers e- commerce solutions as a complement to other payment solutions. Swedbank’s payment acquisition volume in e- commerce has increased by just over 100 per cent since the first half-year 2013. In April Swedbank launched Babs Micro, a mobile based payment terminal that allows small businesses and associations to accept card payments by mobile phone without needing access to a fixed terminal. Swedbank is the eleventh largest debit card issuer in Europe based on number of transactions. Sweden is among the countries in the world with the highest levels of card usage. Nearly 80 per cent of retail purchases are made by card at the same time that the number of cash withdrawals through ATMs is decreasing. As a card issuer, Swedbank generates revenue from cardholders in the form of annual fees, currency exchange fees and interest when credit is utilised. Transaction growth for Swedbank’s cards in Sweden exceeded 10 per cent in the last year. The percentage of card transactions is high in Estonia as well (55 per cent), with an annual growth rate of about 9 per cent. In Latvia and Lithuania, card usage is lower, but the growth rate is expected to be higher than in Sweden. In card issuance in the bank’s home markets the biggest growth opportunities are in corporate cards, where Swedbank has historically been weaker and where the large number of small business customers offers significant potential. Card related income Jan-Jun Jan-Jun SEKm 2014 2013 % Total income, SEKm 1 746 1 437 22 of which Nordics 845 829 2 of which Baltic countries 392 347 13 of which Entercard1) 510 261 95 1) Swedbank's share of the profit or loss of the associate Entercard. Total card income increased by 22 per cent year-on- year. Entercard reported one-off income during the second quarter after a distribution partner in Norway terminated their partnership, which positively affected Sweden’s income by approximately SEK 230m. As a result, Entercard’s credit volumes decreased by approximately SEK 25 per cent. In the Nordic region income was flat. The transaction volume in payment acquisitions increased by 9 per cent, while the corresponding increase for bank card transactions was 11 per cent. The increased transaction volumes produced higher issuance income, while the margins in payment acquisitions are under pressure. In the Baltic countries, card issuance income is growing thanks to improved margins and increased card usage, primarily in Latvia and Lithuania. Jan-Jun Jan-Jun Key ratios, cards 2014 2013 % Acquired transactions, million 935 850 10 of which Nordics 793 718 10 of which Baltic countries 141 132 7 Acquired volumes, SEKbn 227 208 9 of which Nordics 207 190 9 of which Baltic countries 20 18 15 Issued cards, millon 7.7 7.8 -1 of which Nordics 3.9 3.9 0 of which Baltic countries 3.9 3.9 -2 Number of card purchases, million 634 570 11 of which Nordics 468 425 10 of which Baltic countries 166 145 14 Asset management business Asset management operations are conducted through the Swedbank Robur group in Swedbank’s four home markets and in Norway. In total, Swedbank Robur offers around 140 funds as well as discretionary asset management. Fund assets under management amounted to SEK 666bn (561) on 30 June, of which the Swedish operations accounted for SEK 640bn. The market share in Sweden was 23.1 per cent in terms of assets under management. Discretionary assets under management amounted to SEK 297bn (257). Of the total net inflow to the Swedish fund market, the majority was to fixed income funds (SEK 48bn) and mixed funds (SEK 25bn) during the first half-year. Equity funds reported a positive inflow as of 30 June (SEK 5bn) after an outflow in the first quarter. The total net inflow to Swedbank Robur’s funds in Sweden was SEK 13bn, including SEK 10.7bn during the second quarter. This includes inflows to fixed income funds (SEK 13.5bn) and mixed funds (SEK 3.4bn), while equity funds posted a further outflow of SEK 3.7bn. Swedbank’s market share of net inflows was 15.5 per cent during the first half- year. The inflow to discretionary asset management amounted to SEK 7.4bn during the first half-year.
  • 25. Swedbank – Interim report January-June 2014 Page 25 of 60 Asset management Jan-Jun Jan-Jun Key ratios, SEKbn 2014 2013 % Total income, SEKm 2 206 1 972 12 Assets under management 666 561 19 of which Sweden 640 541 18 of which Baltic countries 22 18 24 of which Norway 4 2 81 Discretionary asset management 297 257 15 of which Sweden 295 254 16 of which Baltic countries 2 3 -33 Income from asset management products amounted to SEK 2 206m during the first half-year, an increase of 12 per cent year-on-year. The improvement is mainly due to the market’s positive development, which increased average assets under management by 19 per cent. Compared with the previous quarter income increased by SEK 62m, mainly due to a positive stock market. Insurance business Swedbank has life insurance operations in all its home markets and non-life operations in the Baltic countries. Non-life insurance is offered in Sweden through a third- party solution with the insurance company Tre Kronor. Insurance products are sold through the distribution channels of Swedbank and the savings banks. Premium payments Jan-Jun Jan-Jun SEKm 2014 2013 % Sweden 8 892 8 449 5 of which collective occupational pensions 3 066 2 833 8 of which endowment insurance 4 028 3 984 1 of which occupational pensions 1 086 976 11 of which risk insurance 380 347 9 of which other 333 310 7 Baltic countries 590 489 21 of which life insurance 369 303 22 of which non-life insurance 221 186 19 Sweden Swedbank’s life insurance company is the seventh largest in the Swedish market. In terms of premium payments it has a market share of about 7 per cent. During the first half-year premium income amounted to SEK 8.9bn, an increase of 5 per cent year-on-year. Demand for pension and insurance products will remain high for the foreseeable future, and currently they account for the largest inflow of all savings products. Considering that only 20 per cent of the corporate customers of Swedbank and the savings banks have an occupational pension solution from Swedbank Försäkring, there is significant potential to raise sales among existing customers. Premium payments from occupational pensions rose by 11 per cent from the first half-year 2013, partly because the portfolio increased and partly because transfers from other insurers rose by 32 per cent. Portions of the life insurance market (mainly customised occupational pension solutions) have high margins, while a large part of new savings will be in low-margin products. In order to offer competitive services in the long term, Swedbank has made efficiencies and automation of internal processes a priority. Swedbank does not consider the fees charged in parts of the occupational pension market to be sustainable in the current low interest rate environment. From 1 July 2013 Swedbank Försäkring is a company of choice for the collectively negotiated ITP plan’s 1.5 million private sector employees, one of the fastest growing areas of the occupational pension market. Since July 2013 around 11 000 new agreements have been signed and SEK 376m has been transferred from other insurers, of which nearly 4 000 policies worth SEK 272m are attributable to the first half-year 2014. Baltic countries In Estonia and Lithuania, Swedbank is the largest life insurance company, with market shares of 37 and 22 per cent respectively. The market share in Latvia is 15 per cent, where the business, in contrast to Estonia and Lithuania, has been built up without acquiring an existing insurance portfolio. Swedbank mainly focuses on risk insurance for existing loan customers in the retail banking market, where it sees significant opportunities to promote sound and sustainable finances because of the limited social safety net in the Baltic countries. Sales of Swedbank’s savings products increased by 40 per cent year-on-year. The corresponding increase for risk products was 33 per cent. More new products have resulted in higher premium income, which amounted to SEK 369m, up 16 per cent in local currency compared with the same period in 2013. The market shares for non-life insurance in Estonia, Latvia and Lithuania are 14, 3 and 1 per cent respectively. In non-life insurance, Swedbank mainly offers solutions for private customers. The largest product areas are auto and home insurance, which are offered together with leasing and mortgages as well as through direct sales. The non-life operations in Lithuania were not launched until 2011. The market for auto leasing is small in Lithuania, because of which Swedbank is primarily focused on increasing its market share in home insurance. Total premium income for non-life insurance in the Baltic operations amounted to SEK 221m during the first half-year, an increase of 13 per cent in local currency compared with the first half of 2013. Increases were reported for every product, but especially home insurance, where advertising campaigns and more active sales by bank branches have led to higher volumes. Assets under management Assets under management 30 Jun 31 Dec SEKbn 2014 2013 % Sweden 129.1 118.2 9 of which collective occupational pensions 53.8 47.6 13 of which endowment insurance 52.7 49.6 6 of which occupational pensions 13.7 12.4 10 of which other 8.9 8.6 4 Baltic countries 3.7 3.1 18 of which life insurance 3.7 3.1 18 Assets under management in the Swedish insurance operations rose by 9 per cent to SEK 129.1bn during the first half-year, of which SEK 112.6bn relates to unit linked and deposit insurance. The increase was due to higher stock prices and a positive net inflow. The net inflow is usually higher during the first half-year than the second due to premium payments for contractual