Energy & Commodities, No.9 - December 2, 2011
•
0 gostou•270 visualizações

Energy & Commodities, No.9 - December 2, 2011;

Recomendados
Recomendados
Mais conteúdo relacionado
Mais procurados
Mais procurados (20)
Destaque
Destaque (8)
Semelhante a Energy & Commodities, No.9 - December 2, 2011
Semelhante a Energy & Commodities, No.9 - December 2, 2011 (18)
Mais de Swedbank
Mais de Swedbank (20)
Último
Último (20)
Energy & Commodities, No.9 - December 2, 2011
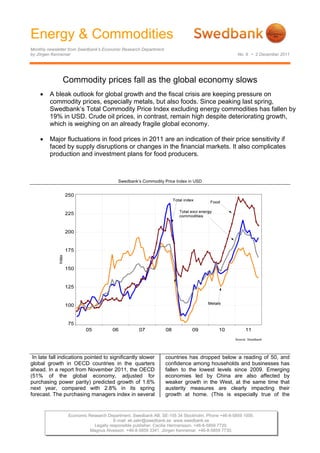
- 1. Energy & Commodities Monthly newsletter from Swedbank’s Economic Research Department by Jörgen Kennemar No. 9 • 2 December 2011 Commodity prices fall as the global economy slows A bleak outlook for global growth and the fiscal crisis are keeping pressure on commodity prices, especially metals, but also foods. Since peaking last spring, Swedbank’s Total Commodity Price Index excluding energy commodities has fallen by 19% in USD. Crude oil prices, in contrast, remain high despite deteriorating growth, which is weighing on an already fragile global economy. Major fluctuations in food prices in 2011 are an indication of their price sensitivity if faced by supply disruptions or changes in the financial markets. It also complicates production and investment plans for food producers. Swedbank’s Commodity Price Index in USD In late fall indications pointed to significantly slower countries has dropped below a reading of 50, and global growth in OECD countries in the quarters confidence among households and businesses has ahead. In a report from November 2011, the OECD fallen to the lowest levels since 2009. Emerging (51% of the global economy, adjusted for economies led by China are also affected by purchasing power parity) predicted growth of 1.6% weaker growth in the West, at the same time that next year, compared with 2.8% in its spring austerity measures are clearly impacting their forecast. The purchasing managers index in several growth at home. (This is especially true of the Economic Research Department. Swedbank AB. SE-105 34 Stockholm. Phone +46-8-5859 1000. E-mail: ek.sekr@swedbank.se www.swedbank.se Legally responsible publisher: Cecilia Hermansson. +46-8-5859 7720. Magnus Alvesson. +46-8-5859 3341. Jörgen Kennemar. +46-8-5859 7730.
- 2. Energy & Commodities Monthly newsletter from Swedbank’s Economic Research Department, continued No. 9 • 2 December 2011 housing market, but also the steel industry). A Price trend for various commodities in 2011, % change global slowdown coincident with political disagreement on how to manage the fiscal crisis in the US and Europe is creating increased uncertainty in the financial markets and reducing the risk appetite for commodities. In November Swedbank’s Total Commodity Price Index excluding energy commodities fell by 4% compared with October. As a result, the index has dropped by nearly 20% since peaking in April. On the other hand, the price of crude, which weighs heavily in the index, rose by slightly over 5%, because of which the Total Commodity Price Index was up 3% between October and November. Metal prices, which continue to decline in pace with The price of copper, which reached just over USD 9 weaker global industrial activity, posted the biggest 500 per ton last summer, has at the time of writing decline in Swedbank’s index in recent months. retreated to about USD 7 500, despite that Since last spring, when industrial metals reached inventories have fallen to the lowest levels since their highest levels in over two years, prices have January. Among industrial metals, copper faces the fallen by just over 20% in USD, with nickel and zinc tightest supply conditions. Chilean copper accounting for the biggest decreases. This is a production, which accounts for a third of the global larger decline than we forecast in Swedbank’s total, has fallen due to strikes and unfavourable economic outlook last fall. It means that the average weather conditions. For fundamental reasons, there price level for non-ferrous metals has risen by 15% is a limit therefore how far the price of copper can year over year, which is lower than the 20% fall. increase we predicted in our August forecast. The prices of iron ore and steel trended lower in the A bleak growth outlook, primarily in the EMU but third quarter due to global weakness and downward also in several emerging economies, points to revisions of investment plans. The spot price of iron ore, which fell by 30 per cent in September and slackening demand for industrial metals and, as a result, a further price drop. We think metal prices October from a year earlier, has risen by 25 per could fall by an average of 5-6% in USD in 2012 cent since the start of November, which shows that there is still an interest in strategically building given an unchanged price level over the year, which was the price decline we predicted last fall. commodity inventories as soon as the market falls However, with growth prospects having further too much (although the absence of Indian steel on the market may have greatly contributed to the deteriorated, metals could fall even more, by just over 10% on average in 2012. This could be offset increase). Forecasts of lower steel production by an increased inventory build-up, not least in around the world should keep demand for iron ore in check, however, and thus prices as well. In 2012 China, which accounts for slightly over 40% of global metal consumption. The Chinese central global steel production is expected to rise by 5.4% bank’s decision on November 30 to reduce capital in volume, compared with 6.5% this year, after having grown by 15% in 2010. The steel industry is adequacy requirements for banks indicates its growing concerns about future economic also faced with overcapacity, especially in China, development. In the short term this could lead to where production capacity has been slashed this year partly due to austerity measures the higher demand for metals, especially after the recent price drop, which is pushing metal prices government has introduced. In the EU, which accounts for a tenth of the global total, steel higher. Limited access to metals is another factor keeping the price decline in check. This is production is expected to grow by a modest 2.5% particularly true of copper and iron ore, but also rare with the risk that it could be lower. earth metals. Oil prices remain stuck at high levels The price of crude (Brent) has not yet shown signs of declining despite the global slowdown. Instead, prices have fluctuated within a broad range between USD 104-120 per barrel. This means that 2 (5)
- 3. Energy & Commodities Monthly newsletter from Swedbank’s Economic Research Department, continued No. 9 • 2 December 2011 the average crude price for 2011 is around USD earlier this year. This applies to everything from 113 per barrel, in line with our forecast earlier in the grain and sugar to cooking oil and means that the fall. Oil futures indicate that prices will stay above food index in Swedbank’s Commodity Price Index is the USD 100 level in 2012, higher than the US 98 at its lowest since November of last year, though it we forecast this fall. It isn’t growth in global is still high from a long-term perspective. Since consumption that has kept oil prices high. In fact, 2000 the index has nearly tripled in USD and forecasts for this year and next have been gradually doubled in euro. Growing concerns about the global revised lower. The International Energy Agency economy, higher food production and rising (IEA) estimates that consumption will rise by 89.5 inventories are contributing to the price correction in million barrels a day this year and 90.5 million 2011. Though declining, average food prices will be barrels in 2012, a downward revision from its over 30% higher than last year, which is due to the forecast last summer. Instead, the problem is on the record-high prices earlier in 2011. This is in line with supply side, including geopolitical developments in our prediction last fall. The high volatility in food the Middle East and their impact on future oil prices is an indication of their sensitivity in the event supplies. There have not yet been any signs that of supply disruptions or changes in the financial OPEC will raise production at its summit later this markets. It also complicates production and month. At the same time there has been investment plans for food producers. A rapidly disagreement within the organisation whether to growing population and rising purchasing power in raise production quotas, as evidenced at its summit highly populated regions will require higher, and in June, when the discussion centred on replacing more efficient, food production as well as lower Libyan production. That issue has been resolved, trading restrictions on agricultural products. and production from Libya is rising again from a low level. The supply of oil is also limited because Gold prices in USD production in countries outside OPEC such as Brazil and the UK is growing significantly slower than expected. An extended period of high oil prices could weigh on an already fragile global economy, even though consumption in the West is lower than during the oil crises 25-30 years ago. Debt-burdened economies are the most vulnerable to high oil prices. In EU countries, the cost of oil imports is expected to increase from 280 billion euro in 2010 to slightly over 400 billion euro in 2011. Price trend for various food commodities The price trend for gold is more uncertain Gold is among the commodities that have risen the most in price in 2011, climbing by 20% since the start of the year, in contrast with a corresponding decline for non-ferrous metals. Growing concerns about the strength of the global recovery and the risk that a fiscal crisis in EMU countries could trigger another financial crisis and adversely affect the real economy have contributed to increased demand for gold as an investment alternative from both financial investors and central banks. In the late fall the volatility in gold prices increased, with Food prices fall as production rises prices ranging between USD 1 600 – 1 800 per troy ounce after having nearly reached USD 1 900 per The major increase in food prices in the second half troy ounce in the summer months. This is an of 2010 and start of 2011 has been followed by a indication that gold is not a totally safe financial drop of about 15% in USD compared with the peak investment. In addition, financial conditions have 3 (5)
- 4. Energy & Commodities Monthly newsletter from Swedbank’s Economic Research Department, continued No. 9 • 2 December 2011 changed during the fall months, which has reduced remain in place in 2012 when fiscal policies are investor interest in gold. The increased need for tightened. liquidity has led to a gold sell-off, at the same time that more capital is needed up front to invest in gold contracts. When the dollar rises, it tends to push gold prices lower. Indications are that the price of gold will remain high, however, until the imbalances in the global economy are alleviated. At the same time expansive monetary policies are expected to 4 (5)
- 5. Energy & Commodities Monthly newsletter from Swedbank’s Economic Research Department, continued No. 9 • 2 December 2011 Swedbank Commodity Index - US$ - Swedbank Commodity Index - SKr - Basis 2000 = 1oo 05-12-11 Basis 2000 = 1oo 05-12-11 8.2011 9.2011 10.2011 8.2011 9.2011 10.2011 T otal index 346.9 368.0 356.1 T otal index 241.3 265.6 257.4 Per cent change month ago -5.1 6.1 -3.2 Per cent change month ago -4.8 10.1 -3.1 Per cent change year ago 28.5 34.7 23.5 Per cent change year ago 12.8 26.9 23.2 T otal index exclusive energy 316.7 308.4 282.5 T otal index exclusive energy 220.3 222.6 204.2 Per cent change month ago -1.1 -2.6 -8.4 Per cent change month ago -0.8 1.0 -8.3 Per cent change year ago 19.2 12.6 1.1 Per cent change year ago 4.7 6.1 0.8 Food, tropical beverages 303.1 298.3 275.0 Food, tropical beverages 210.9 215.3 198.8 Per cent change month ago 0.8 -1.6 -7.8 Per cent change month ago 1.1 2.1 -7.7 Per cent change year ago 29.5 21.3 7.1 Per cent change year ago 13.7 14.3 6.8 Cereals 309.3 306.1 281.8 Cereals 215.2 220.9 203.7 Per cent change month ago 7.2 -1.0 -7.9 Per cent change month ago 7.5 2.7 -7.8 Per cent change year ago 43.5 27.5 11.6 Per cent change year ago 26.0 20.1 11.3 T ropical beverages and tobacco 322.2 317.4 293.8 T ropical beverages and tobacco 224.1 229.1 212.4 Per cent change month ago -0.5 -1.5 -7.4 Per cent change month ago -0.2 2.2 -7.3 Per cent change year ago 27.1 20.0 8.5 Per cent change year ago 11.5 13.1 8.1 Coffee 211.4 212.2 193.3 Coffee 147.1 153.2 139.7 Per cent change month ago 0.8 0.4 -8.9 Per cent change month ago 1.1 4.1 -8.8 Per cent change year ago 34.2 29.7 19.6 Per cent change year ago 17.8 22.2 19.3 Oilseeds and oil 257.7 251.9 229.8 Oilseeds and oil 179.3 181.8 166.1 Per cent change month ago -0.3 -2.3 -8.8 Per cent change month ago 0.0 1.4 -8.6 Per cent change year ago 26.2 20.1 0.5 Per cent change year ago 10.8 13.1 0.2 Industrial raw materials 320.6 311.3 284.6 Industrial raw materials 223.0 224.7 205.7 Per cent change month ago -1.7 -2.9 -8.6 Per cent change month ago -1.3 0.8 -8.4 Per cent change year ago 16.7 10.5 -0.5 Per cent change year ago 2.5 4.0 -0.8 Agricultural raw materials 201.8 195.6 186.9 Agricultural raw materials 140.4 141.2 135.1 Per cent change month ago -0.5 -3.1 -4.4 Per cent change month ago -0.2 0.6 -4.3 Per cent change year ago 18.2 11.8 0.6 Per cent change year ago 3.8 5.3 0.3 Cotton 103.6 105.3 101.2 Cotton 72.1 76.0 73.2 Per cent change month ago -3.4 1.6 -3.9 Per cent change month ago -3.1 5.5 -3.7 Per cent change year ago 19.6 8.8 -10.0 Per cent change year ago 5.0 2.5 -10.3 Softwood 153.8 148.6 144.7 Softwood 107.0 107.3 104.6 Per cent change month ago -0.6 -3.4 -2.6 Per cent change month ago -0.3 0.2 -2.5 Per cent change year ago 2.5 -0.4 -5.7 Per cent change year ago -10.0 -6.2 -6.0 W oodpulp 994.2 967.2 930.3 W oodpulp 691.6 698.1 672.4 Per cent change month ago -2.3 -2.7 -3.8 Per cent change month ago -2.0 0.9 -3.7 Per cent change year ago 1.8 -0.5 -3.7 Per cent change year ago -10.6 -6.3 -4.0 Non-ferrous metals 273.5 257.2 236.7 N on-ferrous metals 190.3 185.6 171.1 Per cent change month ago -5.9 -6.0 -8.0 Per cent change month ago -5.6 -2.4 -7.8 Per cent change year ago 17.6 5.5 -10.2 Per cent change year ago 3.3 -0.7 -10.5 Copper 9043.0 8314.3 7370.9 Copper 6290.8 6000.8 5327.9 Per cent change month ago -6.0 -8.1 -11.3 Per cent change month ago -5.7 -4.6 -11.2 Per cent change year ago 24.2 7.9 -11.1 Per cent change year ago 9.0 1.6 -11.4 Aluminium 2389.4 2296.3 2174.5 Aluminium 1662.2 1657.3 1571.8 Per cent change month ago -4.9 -3.9 -5.3 Per cent change month ago -4.6 -0.3 -5.2 Per cent change year ago 13.1 6.2 -7.3 Per cent change year ago -0.7 0.0 -7.6 Lead 2407.0 2297.9 1946.4 Lead 1674.4 1658.5 1406.9 Per cent change month ago -10.3 -4.5 -15.3 Per cent change month ago -10.0 -1.0 -15.2 Per cent change year ago 16.2 5.2 -18.2 Per cent change year ago 2.0 -0.9 -18.4 Z inc 2211.0 2076.4 1859.6 Z inc 1538.1 1498.6 1344.2 Per cent change month ago -7.5 -6.1 -10.4 Per cent change month ago -7.2 -2.6 -10.3 Per cent change year ago 8.2 -3.5 -21.6 Per cent change year ago -5.0 -9.1 -21.8 Nickel 22044.0 20388.5 18919.9 N ickel 15335.0 14715.2 13675.8 Per cent change month ago -7.1 -7.5 -7.2 Per cent change month ago -6.8 -4.0 -7.1 Per cent change year ago 3.2 -9.9 -20.5 Per cent change year ago -9.4 -15.2 -20.7 Iron ore, steel scrap 757.0 759.8 669.4 Iron ore, steel scrap 526.6 548.4 483.9 Per cent change month ago 2.3 0.4 -11.9 Per cent change month ago 2.6 4.1 -11.8 Per cent change year ago 14.8 14.8 10.6 Per cent change year ago 0.8 8.1 10.3 Energy raw materials 360.3 394.5 388.7 Energy raw materials 250.6 284.7 281.0 Per cent change month ago -6.5 9.5 -1.4 Per cent change month ago -6.2 13.6 -1.3 Per cent change year ago 32.5 44.6 33.1 Per cent change year ago 16.3 36.2 32.7 Coking coal 460.9 465.7 448.9 Coking coal 320.6 336.1 324.5 Per cent change month ago 0.2 1.0 -3.6 Per cent change month ago 0.6 4.8 -3.5 Per cent change year ago 34.8 31.3 21.6 Per cent change year ago 18.3 23.6 21.2 Crude oil 355.7 391.2 386.0 Crude oil 247.4 282.3 279.0 Per cent change month ago -6.9 10.0 -1.3 Per cent change month ago -6.6 14.1 -1.2 Per cent change year ago 32.4 45.4 33.7 Per cent change year ago 16.2 36.9 33.3 Source : SW EDBANK and HW W A-Institute for Economic Research Hamburg Source : SW ED BANK and H W W A-Institute for Economic R esearch H amburg Swedbank Economic Research Department Swedbank’s monthly Energy & Commodities newsletter is published as a service to our customers. We believe that we have used reliable sources and methods in the preparation SE-105 34 Stockholm, Sweden of the analyses reported in this publication. However, we cannot guarantee the accuracy or Phone +46-8-5859 7740 completeness of the report and cannot be held responsible for any error or omission in the ek.sekr@swedbank.se underlying material or its use. Readers are encouraged to base any (investment) decisions www.swedbank.se on other material as well. Neither Swedbank nor its employees may be held responsible for Legally responsible publisher losses or damages, direct or indirect, owing to any errors or omissions in Swedbank’s Cecilia Hermansson, +46-88-5859 7720 monthly Energy & Commodities newsletter. Magnus Alvesson, +46-8-5859 3341 Jörgen Kennemar, +46-8-5859 7730 5 (5)