Recomendados

Recomendados
Mais conteúdo relacionado
Mais procurados
Mais procurados (20)
Destaque
Destaque (10)
Semelhante a Introduction to GIS Final Poster
Semelhante a Introduction to GIS Final Poster (20)
Introduction to GIS Final Poster
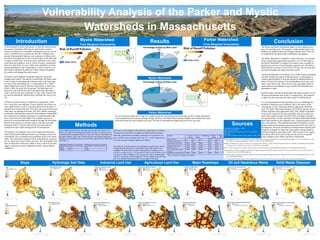
- 1. Vulnerability Analysis of the Parker and Mystic Watersheds in Massachusetts Slope Hydrologic Soil Data Industrial Land Use Agricultural Land Use Major Roadways Oil and Hazardous Waste Solid Waste Disposal Mystic Watershed: Final Weighted Vulnerability Parker Watershed: Final Weighted Vulnerability Introduction Results Mystic Watershed Parker Watershed Before beginning the analysis, the study areas needed to be chosen. Two factors were used when making that decision: the area of water per area of watershed and the population density of that area. The two watersheds that had approximately equal water to land ratio and very different population densities (a low and high value) were the Parker and the Mystic Watersheds (see Table 1). Watershed Water to Land ratio Population density (per km2 ) Parker 82.3 341 Mystic 87.2 2861 Table 2. Reclassification categories for each factor. Factors 1= Low Risk 2= Low Med 3= Medium 4= Med High 5= High Risk Slope (% Rise) 03 38 815 1525 2535 Hydrologic Soil Groups A B C C/D D Agricultural Land Use (m) >2000 2000 1000 500 200 Industrial Land Use (m) >2000 2000 1000 500 200 Major Roads (m) >2000 2000 1000 500 200 Oil and Hazardous Material Sites (m) >2000 2000 1000 500 200 Solid Waste Land Disposal (m) >2000 2000 1000 500 200 As seen in the pie charts above, high risk, mediumhigh risk, and medium risk areas make up 78% of both watersheds. Each watershed has the same percentage of high risk areas. The Parker Watershed has slightly more mediumrisk areas, while the Mystic has more medium risk areas. The Mystic Watershed has highest percent of low risk areas. As the demand for clean water grows, so does the concern about the amount of pollution affecting our water bodies. Known sources of pollution are controlled with permits; however, not all causes of pollution are accounted for. Runoff is defined as the amount of precipitation that does not evaporate or infiltrate into the soil; the precipitation travels over the surface of the land until it reaches a water body. Nonpoint source pollution occurs when runoff picks up pollutants, from a variety of causes, and deposits them in a water body. It is one of the main contributors to water quality degradation in the United States. Current research is en deavoring to attribute the pollution to their origins and quantify the amount and damage from each source. Nonpoint source pollution frequently enters the ecosystem through storm runoff. The amount of runoff that will likely make it into a body of water depends on factors such as the slope and soil type of the surrounding area. A steep gradient has a much higher likelihood of runoff, whereas a flat surface is much more likely to filter the water into the ground. The hydrologic soil group also aids with the amount of absorption that takes place. Type A soils are the most permeable to water while Type D soils are the least permeable, and therefore contribute the most to run off. Common nonpoint sources of pollution are agriculture, indus tries, waste sites, and roadways. Excess nutrients from farms can cause algal blooms in water ecosystems that prevent all other or ganisms from living in the area. Pesticides can wash off crops and make their way through food webs, like DDT. Metals, chemicals compounds, and hazardous materials from industries and landfills are commonly not disposed of properly, or unintentionally leak from waste sites into water bodies. For example, mercury is known to bioaccumulate and biomagnify through the food chain. Runoff from roadways is another concern. Gasoline and other chemicals used by vehicles spill onto the pavement and are washed into water bodies during periods of precipitation. This analysis will integrate some of the components that cause runoff with potential pollution factors in an attempt to assess the vulnerability risk to nonpoint source pollution in two local water sheds. The watersheds examined will be from different communi ties, an urban area versus a more rural area. The investigation will strive to determine which area, urban or rural, is most atrisk and suggest which areas need to implement stricter water pollution regulations. Each layer was first clipped to the study area to limit the area of analysis. The main tools used in this investigation included Euclidean Distance, Reclassify, and the Raster Calculator. Each layer was reclassified on a risk of runoff or risk of pollution scale from 1 to 5, with 1 being the low est atrisk area and 5 being the highest (see Table 2). The final risk of runoff pollution was calculated using the raster calcula tor after all of the factors were reclassified. None of the factors were weighted. The raster scale was then regrouped into 5 categories: 610 was given a value of low, 1115 was given a value of lowmedium, 1620 was given a value of medium, 2125 was given a value of mediumhigh, and 2631 was given a value of high risk. The area made up by each cate gory was calculated and presented as a percentage of total area. Methods Conclusion Sources The Mystic and Parker Watersheds appear to have equal percent ages of vulnerable areas. The quantity of high, mediumhigh, and medium risk pollution areas are all approximately equal. This can be explained by the factors that contributed to the analysis. The Parker Watershed is situated in a more rural area. As expected, it has a much larger agricultural area that is over 12 times that of the Mystic Watershed. It contains fewer major roads, a smaller in dustrial area, and less oil and hazardous material sites. The Parker Watershed also consists of more D and C/D type soil, the types that are least permeable and support the most runoff. The Mystic Watershed is located in a very urban, densely populated area that includes the capital of Massachusetts. As anticipated, it contains approximately 4 times the amount of industrial land use, almost 38 times the amount of oil and hazardous waste sites, and many more major roads. There are far fewer agricultural land use areas and more areas that have type A and B soil which the most permeable to water. Both the Parker and Mystic Watersheds had similar numbers of sol id waste land disposal sites (9 and 13, respectively). The variation in slope was also assessed to be about equal for both locations. It is recommended that both watersheds focus on combatting the problem of nonpoint source pollution. Due to the nature of the communities in each watershed, different approaches should be used. The Parker Watershed should aim to limit the amount of run off that originates from agricultural land. They should concentrate on the farms located on the least permeable soils and conduct fre quent water quality testing to test the levels of nitrogen, phospho rus, and pesticides. On the other hand, the Mystic Watershed should direct their attention to the industrial sites, oil and hazardous waste sites, and roadways. They should ensure that all industries are dis posing of their waste properly and can account for the life cycle of all chemicals. The areas around the oil and hazardous material sites should be examined for leaks and waterquality testing should be performed regularly near major roads. These are just a few sugges tions about what can be done to decrease the levels of nonpoint source pollution in the Parker and Mystic Watersheds. Bhaduri, Budhendra, Harbor, Jon, Engel, Bernie, & Grove, Matt (2000). Assessing WatershedScale, LongTerm Hydrologic Impacts of LandUse Change Using a GIS NPS Model. Environmental Management, 26(6), 643658. doi: 10.1007/s002670010122 Hamlett, J.M., Miller, D.A., Day, R.L., Peterson, G.W., Baumer, G.M., & Russo, J. (1992). Statewide GISbased ranking of watersheds for agricultural pollution preven tion. Journal of Soil and Water Conservation, 47(5), 399404. (no doi available). Heller, T. (2011). Hydrologic Soil Groups. Purdue University. Retrieved from https://engineering.purdue.edu/mapserve/LTHIA7/documentation/hsg.html. Stuebe, Miki M. & Johnston, Douglas M. (1990). Runoff Volume Estimation Using GIS Technique. Journal of the American Water Resources Association, 26(4), 611 620. doi: 10.1111/j.17521688.1990.tb01398.x Weng, Qihao (2001). Modeling Urban Growth Effects on Surface Runoff with the Integration of Remote Sensing and GIS. Environmental Management, 28(6), 737748. doi: 10.1007/s002670010258 U.S. Environmental Protection Agency. (2014). Polluted Runoff: Nonpoint Source Pollution. Retrieved from http://water.epa.gov/polwaste/nps/index.cfm. Cartography by Stephanie Clarke Intro to GIS, Fall 2014 Map Data Sources: MassGIS, 2014, U.S. Census 2010 Projection: NAD_1983_StatePlane_Massachusetts_Mainland_FIPS_2001