SlideShare uma empresa Scribd logo
1 de 4
Baixar para ler offline
Utah Health Status Update:
                                                     Depression

September 2009                                                                                             Utah Department of Health

 Of all mental illnesses, depression is the most      Major Depression by Small Area
 common disorder.1 Approximately 14.8 mil-            Figure 1. Percentage of adults reporting current major depression by local
 lion adults in the U.S., or 6.7% of the adult        health district and small area, Utah, 2005–2007
 population, suffer from major depression each
 year.2 Major depression is the leading cause of
 disability in the U.S. for ages 15–44.
 Depression was selected by the Healthy People
 2010 committee in order to monitor progress in
 mental health treatment among adults. Healthy
 People 2010 objective 18-9b states “Increase
 the proportion of adults with recognized
 depression who receive treatment.”
 In order to estimate the prevalence of depression
 in Utah adults, the Patient Health Questionnaire
 (PHQ-9) was included on the Utah Behavioral
 Risk Factor Surveillance System (BRFSS)
 from 2005–2007. The PHQ-9 is a validated
 screening tool to diagnose clinical depression.
 The BRFSS is a random-digit-dialed telephone
 survey of noninstitutionalized persons 18 years
 of age and older. Survey respondents were
 classified as having major depression based
 on a validated algorithm.
 Results from the survey indicate that 4.1% of
 Utah adults, or approximately 75,100 indi-
 viduals, had major depression. More women
 (5.1%) were classified as having major depres-
 sion than men (3.1%). Based on data from
 2006, Utah ranked 21st for percentage of
 adults with major depression compared to the
 33 other states that included some variation
 of the PHQ-9 on the BRFSS that year. Utah’s          Age-adjusted to the 2000 U.S. standard population.
 rate (4.2%) was similar to the combined rate
 (4.2%) of the 34 states. North Dakota had the
 lowest rate of major depression (2.2%) while         Orem (8.8%) and West Valley East (8.2%). The lowest rates of major
 West Virginia had the highest rate (7.0%).           depression were found in the combined West Jordan/Copperton and
                                                      South Jordan small areas (1.2%), Grand/San Juan County (1.5%) and
 The age-adjusted rate of major depression in
                                                      Sandy Center (1.9%). The South Salt Lake and West Valley East rates
 Utah varied by local health district (LHD).
                                                      were significantly higher than the state rate. The combined West Jordan/
 Central Utah LHD had the highest rate of ma-
                                                      Copperton and South Jordan small area and Grand/San Juan County
 jor depression (5.6%) while Summit County
                                                      rates were significantly lower than the state rate (see Figure 1).
 LHD had the lowest rate (2.2%). However,
 neither of these rates is statistically different    The prevalence of major depression was higher among adults with
 from the overall state rate of major depression      selected chronic diseases. People who ever had a stroke had rates of
 (4.1%). Looking at small areas within LHDs,          major depression three times higher than those who had never had a
 adults in South Salt Lake had the highest rate       stroke (12.0% vs. 3.9%). People who had ever had a heart attack (8.6%
 of major depression (10.4%) followed by West         vs. 4.0%), had current asthma (8.2% vs. 3.7%), hypertension (7.7% vs.
3.6%), and doctor diagnosed arthritis (7.5%            Major Depression by Chronic Disease
vs. 2.9%) had major depression at more than            Figure 2. Percentage of adults reporting current major depression by
twice the rate of those without those chronic          selected chronic diseases, Utah, 2005–2007
conditions. Adults with diabetes (6.2% vs.
3.9%) also had higher rates of depression than
those not diagnosed (see Figure 2).
A multivariate analysis was performed to deter-
mine if certain health behaviors were different
for Utah adults who had major depression. The
analysis controlled for age, sex, race, education,
and employment as individual logistic regression
models. Persons who were classified with major
depression were 5.4 times more likely to report
fair or poor health status, 2.3 times more likely
to be current smokers, 1.8 times more likely to
report binge drinking, and more than 1.5 times
more likely to be obese when compared to people
not classified with major depression. They were
only about half as likely to engage in the rec-
                                                       Age-adjusted to the 2000 U.S. standard population.
ommended amount of physical activity. Major            Hypertension and asthma data reported for 2005 and 2007.
depression was not related to the consumption
of fruits and vegetables (see Figure 3).
                                                       Lifestyle Behaviors of Utahns With Major Depression
Utah has a similar prevalence of major depres-         Figure 3. Odds of lifestyle behaviors for persons with major depression
sion when compared to other states using the           versus persons without major depression, Utah, 2005–2007
PHQ-9 analysis, although geographic variation
exists within the State. Major depression may
be associated with certain chronic conditions,
health, and health behaviors. Targeted screening
for and treatment of depression should be con-
sidered among persons who have had strokes or
heart attacks and persons with chronic diseases.
Public health efforts towards increased physical
activity, smoking cessation, and alcohol addic-
tion should recognize the impact of depression
on these behaviors. Timely and appropriate
interventions can help improve the quality of
life of persons who suffer from this disease.
References
1. U.S. Department of Health and Human Ser-
vices. Healthy People 2010. 2nd ed. With Under-
standing and Improving Health and Objectives           Age-adjusted to the 2000 U.S. standard population.
                                                       5 a Day and recommended physical activity data reported for 2005 and 2007.
for Improving Health. Washington, DC: U.S.
Government Printing Office, November 2000.
2. National Institutes of Mental Health “The Numbers
Count: Mental Disorders in America.” Retrieved
from http://www.nimh.nih.gov/publicat/numbers            September 2009 Utah Health Status Update
.cfm#MajorDepressive on February 27, 2006.
                                                         For additional information about this topic, contact Michael
                                                         Friedrichs, MS, Bureau of Health Promotion, Utah Department
 A comprehensive report on these data is                 of Health, Box 142106, Salt Lake City, UT 84114-2106, (801)
 being prepared and will be available by                 538-6244, email: mfriedrichs@utah.gov, or Jennifer Wrathall,
 fall, 2009 and can be accessed at http://               MPH, Office of Public Health Assessment, Utah Department of
 health.utah.gov/opha/publications/brfss/                Health, Box 142101, Salt Lake City, UT 84114-2101, (801) 538-
 Depression/Depression.html.                             9259, email: jwratha@utah.gov
Spotlights for August 2009

Breaking News, August 2009
Multiple Births                                                                     Multiple Births Seen Through the Neonatal Follow-up
                                                                                    Program (NFP), UDOH, Prospective Study of Very
Natural incidence for twins is 1 in 80 (3%) and for triplets 1 in
                                                                                    Low Birth Weight Babies, Nov. 2006–Nov. 2007
8000 (0.2%).* Since 1980 in the U.S. there has been an increase in
                                                                                                              Spontaneous          ART
multiple births by 75% for twins and by 220% for triplets and qua-
                                                                                        Number of Children       192              133
druplets.* The increase in multiple births is attributed to delayed
                                                                                        Number of Families       104               69
pregnancy, treatment with fertility drugs, and assisted reproduc-
                                                                                        Twins                 164 (85%)         80 (60%)
tive technology (ART). In the U.S. in the year 2006, ART alone
                                                                                        Triplets                9 (5%)          27 (20%)
accounted for 1% of all deliveries and 18% of multiple births.*
                                                                                        Quadruplets             0 (0%)           8 (6%)
Gestational age at delivery decreases as fetal                                          Single Survivor        19 (10%)         18 (14%)
number increases. The average gestational        Gravity of Illness
age for triplets is 32 weeks and for quadru-                                                                    Spontaneously     Multiple
plets 29 weeks in the U.S. (5 and 8 weeks                                                                         Occurring      Births as a
early, respectively). Babies born early are at               Number of Children (Percent)                       Multiple Births Result of ART
risk for multiple long term problems. Pre-         Average gestation                                              29 weeks       28 weeks
                                                   (Term is 38–40 weeks and premature is 37 weeks and less)
maturity is the most powerful predictor of
                                                   Average birth weight
cerebral palsy and the risk of cerebral palsy      (1 pound = 454 grams)
                                                                                                                 1183 grams     1128 grams
is increased among multiple births.*               Newborn Intensive Care Unit (NICU) stay                        68 days         68 days
In summary, although positive achievements         Discharged from NICU on oxygen                                 98 (51%)       78 (59%)
                                                   (Infants with chronic lung disease)
in science and technology are undeniable,
one must weigh the possibility of undesirable      Severe brain bleed placing the infant at risk for cere-
                                                                                                                  26 (14%)       28 (21%)
                                                   bral palsy and cognitive impairment
consequences such as extreme prematurity
                                                   Retinopathy of prematurity requiring laser treatment
which caries a risk for prolonged hospital         placing the infant at risk for long term vision concerns
                                                                                                                  22 (11%)        12 (9%)
stay, long term health problems, neurologi-        Congenital anomaly                                             13 (7%)        24 (18%)
cal deficit, and cognitive impairment.           * References available upon request.


Community Health Indicators Spotlight, August 2009
Salmonella
Outbreaks of Salmonella have become a year-round occurrence; they are being identified and investigated even during the
off-peak months for foodborne diseases. This new pattern is due in a large part to improved identification of outbreaks through
specialized laboratory techniques that can help public health link distant illnesses together as outbreaks. Over the last 12
months, the Utah Department of Health and local health departments in Utah have partnered with the Centers for Disease
Control and Prevention and other state and local
health departments to investigate outbreaks of Sal- Average Number of Cases of Salmonellosis by Month of
monella that have been linked to turkey products, Occurrence, Utah, 1999–2008
peanut butter products, and Salmonella cultures for
school laboratories. Several other outbreaks were
investigated for which no source was identified.
During the spring of 2009, public health in Utah in-
vestigated an outbreak of Salmonella infections linked
to queso fresco, Mexican-style homemade raw-milk
cheese, made privately in people’s homes. Public
health officials believe the cheese was contaminated
from ingredients used to make the queso fresco, or
from cross-contamination of the cheese. Public health
has advised the public to: only use pasteurized milk to
make queso fresco; keep milk and other ingredients
refrigerated; use proper food handling practices to
avoid cross contamination; and only buy queso fresco
from the refrigerated section of the grocery store, not
street vendors or door-to-door salesmen.
Monthly Health Indicators Report
                                                                                                                       (Data Through July 2009)


                                                                                                                                                                                                         Expected/


                                                                                                                                                                                                                             Fiscal YTD
                                                                # Expected Cases


                                                                                                                                                                                                         Budgeted


                                                                                                                                                                                                                                            Budgeted


                                                                                                                                                                                                                                                              Variance
                                                                                                     # Expected YTD


                                                                                                                      Morbidity Ratio


                                                                                                                                                                                                                                                              budget҂
                                                                                                                                                                                                                                                              (under)
                                                                                                                                                                                             Current


                                                                                                                                                                                                         Month҂
                                             Current Month


                                                                Current Month

                                                                (5-yr average)


                                                                                                     (5-yr average)


                                                                                                                                                                                             Month
                                                                                                                      YTD Standard


                                                                                                                                                                                                                                                              - over
                                                                                                                                                                                                                                            Fiscal
                                                                                       # Cases YTD


                                                                                                                                                                                                                                            YTD҂
                                                                                                                                         Medicaid Expenditures (in Millions)


                                                                                                                                                                                                         for
                                                                                                                      (obs/exp)
                                                                                                                                         for the Month of July 2009†


                                             # Cases
                                                                                                                                          Capitated Mental Health                           $ 0.7                N/A    $     112.9                     N/A        N/A
Monthly Report of Notifiable                                                                                                              Inpatient Hospital                                $ 13.0               N/A    $     234.7                     N/A        N/A
Diseases, July 2009
                                                                                                                                          Outpatient Hospital                               $      8.4           N/A    $     108.7                     N/A        N/A
Campylobacteriosis (Campylobacter)                       18                 52               138              191                0.7
                                                                                                                                          Long Term Care                                    $ 11.2               N/A    $ 203.1                         N/A       (N/A)
Enterotoxigenic Escherichia coli (E. coli)               10                 15                37               41                0.9
                                                                                                                                          Pharmacy                                          $ 2.4                N/A    $ 129.0                         N/A       (N/A)
Hepatitis A (infectious hepatitis)                        0                  2                 3               12                0.2
                                                                                                                                          Physician/Osteo Services‡                         $ 6.4                N/A    $    86.5                       N/A       (N/A)
Hepatitis B (serum hepatitis)                             1                  3                 5               15                0.3
                                                                                                                                          TOTAL HCF MEDICAID                                $ 121.3              N/A    $ 1,721.1                       N/A        N/A
Measles (Rubeola, Hard Measles)                           0                  0                 0                0                  --


                                                                                                                                                                                                                        % Change§


                                                                                                                                                                                                                                                              % Change§
                                                                                                                                                                                                          Population
Meningococcal Diseases                                    0                  1                 1                7                0.2


                                                                                                                                                                                                                                            Charges in
                                                                                                                                                                                             of Events


                                                                                                                                                                                                                        Previous


                                                                                                                                                                                                                                                              Previous
                                                                                                                                                                                             Number
Norovirus                                                 0                  3                 6               12                0.5


                                                                                                                                                                                                                                            Millions
                                                                                                                                                                                                          per 100


                                                                                                                                                                                                                        From


                                                                                                                                                                                                                                                              From
                                                                                                                                                                                                                                            Total
Pertussis (Whooping Cough)                                7                 26               106              236                0.4


                                                                                                                                                                                                          Rate


                                                                                                                                                                                                                        Year


                                                                                                                                                                                                                                                              Year
Salmonellosis (Salmonella)                               23                 36               156              179                0.9     Health Care System Measures
Shigellosis (Shigella)                                    0                  5                13               23                0.6     Overall Hospitalizations (2007)                    278,952            9.7%            -0.7%           $ 4,265.9        +10.1%
Varicella (Chickenpox)                                    0                  7               334              459                0.7     Non-maternity Hospitalizations (2007)              164,659            5.6%            -0.9%           $ 3,554.6         +9.9%
Viral Meningitis                                          4                 13                16               46                0.3     Emergency Department Encounters (2007)             682,122           24.0%            -1.3%           $ 781.0          +17.1%
West Nile (human cases)                                   0                  2                 1                2                0.4     Outpatient Surgery (2007)                          296,596           10.5%            -5.7%           $ 1,109.0         +8.6%


                                                                                                                                                                                                                                                              % Change§
                                                                                                                                                                                                           Population
                                                                                                     # Expected YTD
                                             Current Quarter


                                                               Current Quarter


                                                                                                                      Morbidity Ratio


                                                                                                                                                                                             Data Year
                                                               (5-yr average)


                                                                                                     (5-yr average)


                                                                                                                                                                                                                                             Percent/


                                                                                                                                                                                                                                                              Previous
                                                                                                                                                                                                                            Affected
                                                                                                                      YTD Standard


                                                                                                                                                                                                                            Number
                                                                                                                                                                                             Current
                                                                                       # Cases YTD


                                                                                                                                                                                                           at Risk
                                                               # Expected


                                                                                                                                                                                                                                                              From
                                                                                                                      (obs/exp)


                                                                                                                                                                                                                                             Rate


                                                                                                                                                                                                                                                              Year
                                                                                                                                         Annual Community Health
                                             # Cases


                                                                                                                                         Measures
                                                               Cases


Notifiable Diseases Reported                                                                                                             Overweight and Obesity (Adults 18+)                    2008     1,924,274 1,119,500                       58.2%         +0.5%
Quarterly, 2nd Qtr 2009                                                                                                                  Cigarette Smoking (Adults 18+)                         2008     1,924,274   179,200                        9.3%        -20.4%
HIV                                                17                    23              39                42                    0.9     Influenza Immunization (Adults 65+)                    2008       237,275   173,900                       73.3%         -3.8%
AIDS                                               10                    10              23                23                    1.0     Health Insurance Coverage (Uninsured)                  2008     2,781,954   298,200                       10.7%         +0.7%
Chlamydia                                       1,545                 1,221           3,281             2,488                    1.3     Motor Vehicle Crash Injury Deaths                      2008     2,781,954       268               9.6 / 100,000         -3.3%
Gonorrhea                                          84                   175             180               354                    0.5     Suicide Deaths                                         2008     2,781,954       384              13.8 / 100,000         +1.3%
Tuberculosis                                        9                     8              20                17                    1.2     Diabetes Prevalence                                    2008     2,781,954   129,500                        4.7%         -1.0%
                                                                                                                                         Coronary Heart Disease Deaths                          2008     2,781,954     1,514              54.4 / 100,000         -4.0%
                                                                                   From Previous


                                                                                                                      From 1 Year


                                                                                                                                         All Cancer Deaths                                      2008     2,781,954     2,478              89.1 / 100,000         -5.6%
                                                                                   % Change§


                                                                                                                      % Change§
                                                                                                        1 Year Ago
                                                                  Previous


                                                                                                                                         Births to Adolescents (Ages 15-17)                     2008        61,727     1,122                18.2 / 1,000         -2.0%
                                             Current
                                             Month


                                                                  Month


                                                                                   Month


                                                                                                                                         Early Prenatal Care                                    2008        55,605    43,997                       79.1%         -0.4%
Program Enrollment for the
                                                                                                                      Ago


Month of July 2009                                                                                                                       Infant Mortality                                       2008        55,605       264                  4.7 / 1,000        -7.9%
Medicaid                                     197,248             195,257             +1.0% 166,026                      +18.8%           Childhood Immunization (4:3:1:3:3:1)                   2008        53,525    39,400                       73.6%         -5.8%
PCN (Primary Care Network)                    23,438              24,103             -2.8% 19,068                       +22.9%          § % Change could be due to random variation.
                                                                                                                                        † The final Medicaid July old adjustment expendiures have not been posted and are not included in this report. The
CHIP (Children’s Health Ins. Plan)            40,131              40,742             -1.5% 34,491                       +16.4%          Medicaid service expenditures reported here are the most current as of the release date of this report.
                                                                                                                                        ҂ Determination on tier 1 and tier 2 unemployment enhancements and the ARRA rate differentials for the the school
                                                                                                                                        districts are still being decided. For these two reasons the total Medicaid Budget amounts are not ready to be released.
                                                                                                                                        ‡ Medicaid payments reported under Physician/Osteo Services do not include enhanced physician payments.
                                                                                                                                        Notes: Data for notifiable diseases are preliminary and subject to change upon the completion of ongoing disease
                                                                                                                                        investigations. Active surveillance for influenza has ended until the 2009 season.

Mais conteúdo relacionado

Mais procurados

Unsafe Sleep Practices And An Analysis Of Bedsharing Among Infants Dying Sudd...
Unsafe Sleep Practices And An Analysis Of Bedsharing Among Infants Dying Sudd...Unsafe Sleep Practices And An Analysis Of Bedsharing Among Infants Dying Sudd...
Unsafe Sleep Practices And An Analysis Of Bedsharing Among Infants Dying Sudd...Biblioteca Virtual
 
Maternal health in northern Nigeria: Challenges & Opportunities
Maternal health in northern Nigeria: Challenges & OpportunitiesMaternal health in northern Nigeria: Challenges & Opportunities
Maternal health in northern Nigeria: Challenges & OpportunitiesPreston Healthcare Consulting
 
BREAST CANCER AND SOME EPIDEMIOLOGICAL FACTORS:
BREAST CANCER AND SOME EPIDEMIOLOGICAL FACTORS:BREAST CANCER AND SOME EPIDEMIOLOGICAL FACTORS:
BREAST CANCER AND SOME EPIDEMIOLOGICAL FACTORS:Mario Guillermo Simonovich
 
WHY ARE THERE INCREASED RATES OF HIV/AIDS IN AFRICAN AMERICAN WOMEN WHO USE B...
WHY ARE THERE INCREASED RATES OF HIV/AIDS IN AFRICAN AMERICAN WOMEN WHO USE B...WHY ARE THERE INCREASED RATES OF HIV/AIDS IN AFRICAN AMERICAN WOMEN WHO USE B...
WHY ARE THERE INCREASED RATES OF HIV/AIDS IN AFRICAN AMERICAN WOMEN WHO USE B...rnice725
 
Genelon.Mother and Child Nutrition
Genelon.Mother and Child NutritionGenelon.Mother and Child Nutrition
Genelon.Mother and Child NutritionGundu H. R. Rao
 
Infant mortality rate
Infant mortality rateInfant mortality rate
Infant mortality rateshivujagga
 
Endometriosis & Dioxins Body Burden - Information for Physicians, Nurses, & O...
Endometriosis & Dioxins Body Burden - Information for Physicians, Nurses, & O...Endometriosis & Dioxins Body Burden - Information for Physicians, Nurses, & O...
Endometriosis & Dioxins Body Burden - Information for Physicians, Nurses, & O...v2zq
 
National & Global Health Problem
National & Global Health ProblemNational & Global Health Problem
National & Global Health Problem1302011987
 
Neonatal mortality measurement what's new
Neonatal mortality measurement   what's newNeonatal mortality measurement   what's new
Neonatal mortality measurement what's newnewborn1
 
Low birth beight and associated maternal factors in ghana
Low birth beight and associated maternal factors in ghanaLow birth beight and associated maternal factors in ghana
Low birth beight and associated maternal factors in ghanaAlexander Decker
 
Nutritional status, care giving and feeding practices of infant
Nutritional status, care giving and feeding practices of  infantNutritional status, care giving and feeding practices of  infant
Nutritional status, care giving and feeding practices of infantAlexander Decker
 
Early-Life Undernourishment in Developing Countries: Prevalence, Impacts over...
Early-Life Undernourishment in Developing Countries: Prevalence, Impacts over...Early-Life Undernourishment in Developing Countries: Prevalence, Impacts over...
Early-Life Undernourishment in Developing Countries: Prevalence, Impacts over...Young Lives Oxford
 
Overview final 20.06.13
Overview final 20.06.13Overview final 20.06.13
Overview final 20.06.13MAHINOJOSA45
 
Assessment of nutritional status of household members in a rural nigerian pop...
Assessment of nutritional status of household members in a rural nigerian pop...Assessment of nutritional status of household members in a rural nigerian pop...
Assessment of nutritional status of household members in a rural nigerian pop...Alexander Decker
 
Analysis of the significance of fishing on food security status of
Analysis of the significance of fishing on food security status ofAnalysis of the significance of fishing on food security status of
Analysis of the significance of fishing on food security status ofAlexander Decker
 
Rel btw homenursingsleepanddaytimefunctfor ventkids 2010
Rel btw homenursingsleepanddaytimefunctfor ventkids 2010Rel btw homenursingsleepanddaytimefunctfor ventkids 2010
Rel btw homenursingsleepanddaytimefunctfor ventkids 2010Andrés Dante Podestá
 
Infant Mortality Rate
Infant Mortality RateInfant Mortality Rate
Infant Mortality Rateaavi241
 

Mais procurados (20)

Breakfast with...Dr. Lynn McIntyre
Breakfast with...Dr. Lynn McIntyreBreakfast with...Dr. Lynn McIntyre
Breakfast with...Dr. Lynn McIntyre
 
Unsafe Sleep Practices And An Analysis Of Bedsharing Among Infants Dying Sudd...
Unsafe Sleep Practices And An Analysis Of Bedsharing Among Infants Dying Sudd...Unsafe Sleep Practices And An Analysis Of Bedsharing Among Infants Dying Sudd...
Unsafe Sleep Practices And An Analysis Of Bedsharing Among Infants Dying Sudd...
 
Maternal health in northern Nigeria: Challenges & Opportunities
Maternal health in northern Nigeria: Challenges & OpportunitiesMaternal health in northern Nigeria: Challenges & Opportunities
Maternal health in northern Nigeria: Challenges & Opportunities
 
BREAST CANCER AND SOME EPIDEMIOLOGICAL FACTORS:
BREAST CANCER AND SOME EPIDEMIOLOGICAL FACTORS:BREAST CANCER AND SOME EPIDEMIOLOGICAL FACTORS:
BREAST CANCER AND SOME EPIDEMIOLOGICAL FACTORS:
 
UndergraduateThesis
UndergraduateThesisUndergraduateThesis
UndergraduateThesis
 
WHY ARE THERE INCREASED RATES OF HIV/AIDS IN AFRICAN AMERICAN WOMEN WHO USE B...
WHY ARE THERE INCREASED RATES OF HIV/AIDS IN AFRICAN AMERICAN WOMEN WHO USE B...WHY ARE THERE INCREASED RATES OF HIV/AIDS IN AFRICAN AMERICAN WOMEN WHO USE B...
WHY ARE THERE INCREASED RATES OF HIV/AIDS IN AFRICAN AMERICAN WOMEN WHO USE B...
 
Genelon.Mother and Child Nutrition
Genelon.Mother and Child NutritionGenelon.Mother and Child Nutrition
Genelon.Mother and Child Nutrition
 
Explosion In Tower Before Jet Hit By Furlong And Ross
Explosion In Tower Before Jet Hit By Furlong And RossExplosion In Tower Before Jet Hit By Furlong And Ross
Explosion In Tower Before Jet Hit By Furlong And Ross
 
Infant mortality rate
Infant mortality rateInfant mortality rate
Infant mortality rate
 
Endometriosis & Dioxins Body Burden - Information for Physicians, Nurses, & O...
Endometriosis & Dioxins Body Burden - Information for Physicians, Nurses, & O...Endometriosis & Dioxins Body Burden - Information for Physicians, Nurses, & O...
Endometriosis & Dioxins Body Burden - Information for Physicians, Nurses, & O...
 
National & Global Health Problem
National & Global Health ProblemNational & Global Health Problem
National & Global Health Problem
 
Neonatal mortality measurement what's new
Neonatal mortality measurement   what's newNeonatal mortality measurement   what's new
Neonatal mortality measurement what's new
 
Low birth beight and associated maternal factors in ghana
Low birth beight and associated maternal factors in ghanaLow birth beight and associated maternal factors in ghana
Low birth beight and associated maternal factors in ghana
 
Nutritional status, care giving and feeding practices of infant
Nutritional status, care giving and feeding practices of  infantNutritional status, care giving and feeding practices of  infant
Nutritional status, care giving and feeding practices of infant
 
Early-Life Undernourishment in Developing Countries: Prevalence, Impacts over...
Early-Life Undernourishment in Developing Countries: Prevalence, Impacts over...Early-Life Undernourishment in Developing Countries: Prevalence, Impacts over...
Early-Life Undernourishment in Developing Countries: Prevalence, Impacts over...
 
Overview final 20.06.13
Overview final 20.06.13Overview final 20.06.13
Overview final 20.06.13
 
Assessment of nutritional status of household members in a rural nigerian pop...
Assessment of nutritional status of household members in a rural nigerian pop...Assessment of nutritional status of household members in a rural nigerian pop...
Assessment of nutritional status of household members in a rural nigerian pop...
 
Analysis of the significance of fishing on food security status of
Analysis of the significance of fishing on food security status ofAnalysis of the significance of fishing on food security status of
Analysis of the significance of fishing on food security status of
 
Rel btw homenursingsleepanddaytimefunctfor ventkids 2010
Rel btw homenursingsleepanddaytimefunctfor ventkids 2010Rel btw homenursingsleepanddaytimefunctfor ventkids 2010
Rel btw homenursingsleepanddaytimefunctfor ventkids 2010
 
Infant Mortality Rate
Infant Mortality RateInfant Mortality Rate
Infant Mortality Rate
 

Destaque (9)

Bear River Area Economic Update
Bear River Area Economic UpdateBear River Area Economic Update
Bear River Area Economic Update
 
Asthma and Air Pollution
Asthma and Air PollutionAsthma and Air Pollution
Asthma and Air Pollution
 
Utah Citizens Guide to Wetlands
Utah Citizens Guide to WetlandsUtah Citizens Guide to Wetlands
Utah Citizens Guide to Wetlands
 
Survey Notes September 2010
Survey Notes September 2010Survey Notes September 2010
Survey Notes September 2010
 
India Roundtable Presentation
India Roundtable PresentationIndia Roundtable Presentation
India Roundtable Presentation
 
Utah Trendlines: November - December 2010
Utah Trendlines: November - December 2010Utah Trendlines: November - December 2010
Utah Trendlines: November - December 2010
 
Utah Internal Survey for Managing Risk
Utah Internal Survey for Managing RiskUtah Internal Survey for Managing Risk
Utah Internal Survey for Managing Risk
 
Statewide Data Interoperability for Improving Population Health
Statewide Data Interoperability for Improving Population Health Statewide Data Interoperability for Improving Population Health
Statewide Data Interoperability for Improving Population Health
 
Utah on the National Historic Register: County Snapshots
Utah on the National Historic Register: County SnapshotsUtah on the National Historic Register: County Snapshots
Utah on the National Historic Register: County Snapshots
 

Semelhante a Depression in Utah - Sep 2009 Report

Twins prevalence, problems, and preterm births ajog2010
Twins prevalence, problems, and preterm births ajog2010Twins prevalence, problems, and preterm births ajog2010
Twins prevalence, problems, and preterm births ajog2010martin-inga
 
Exploring Infant Mortality
Exploring Infant Mortality Exploring Infant Mortality
Exploring Infant Mortality KenadiDavis
 
Prevention of chronic noncommunicable diseases
Prevention of chronic noncommunicable diseasesPrevention of chronic noncommunicable diseases
Prevention of chronic noncommunicable diseasesEnvicon Medical Srl
 
Economic And Social Consequences Of Diabetes
Economic And Social Consequences Of DiabetesEconomic And Social Consequences Of Diabetes
Economic And Social Consequences Of DiabetesChristina Berger
 
Literature Review Childhood Obesity
Literature Review Childhood ObesityLiterature Review Childhood Obesity
Literature Review Childhood ObesityJean Galiana
 
Health And fitness ( Zombies Group )
Health And fitness ( Zombies Group )Health And fitness ( Zombies Group )
Health And fitness ( Zombies Group )MohammedAlshibli
 
Growing Trends: School-Based Community Gardens As A Grassroots Response To Ch...
Growing Trends: School-Based Community Gardens As A Grassroots Response To Ch...Growing Trends: School-Based Community Gardens As A Grassroots Response To Ch...
Growing Trends: School-Based Community Gardens As A Grassroots Response To Ch...angeliaGeo
 
Clarian health health promotion inservice november 8, 2010
Clarian health  health promotion inservice  november 8, 2010Clarian health  health promotion inservice  november 8, 2010
Clarian health health promotion inservice november 8, 2010Julie Gahimer
 
Breastfeeding And The Risk Of Postneonatal Death In The United States
Breastfeeding And The Risk Of Postneonatal Death In The United StatesBreastfeeding And The Risk Of Postneonatal Death In The United States
Breastfeeding And The Risk Of Postneonatal Death In The United StatesBiblioteca Virtual
 
Hau.youth risk
Hau.youth riskHau.youth risk
Hau.youth riskboverton
 
2. Mortality & Morbidity.pptx
2. Mortality & Morbidity.pptx2. Mortality & Morbidity.pptx
2. Mortality & Morbidity.pptxtagreedkhalid1
 
Stillbirth epidemiology, diabetes, and other risk factors among all pregnanci...
Stillbirth epidemiology, diabetes, and other risk factors among all pregnanci...Stillbirth epidemiology, diabetes, and other risk factors among all pregnanci...
Stillbirth epidemiology, diabetes, and other risk factors among all pregnanci...Kelli Buckreus
 
Running head MATERNAL, INFANT AND CHILD HEALTH .docx
Running head MATERNAL, INFANT AND CHILD HEALTH                   .docxRunning head MATERNAL, INFANT AND CHILD HEALTH                   .docx
Running head MATERNAL, INFANT AND CHILD HEALTH .docxcowinhelen
 
Emergence Of Voluntary Neo Eugenics
Emergence Of Voluntary Neo EugenicsEmergence Of Voluntary Neo Eugenics
Emergence Of Voluntary Neo Eugenicsguest9a4493e
 

Semelhante a Depression in Utah - Sep 2009 Report (20)

Twins prevalence, problems, and preterm births ajog2010
Twins prevalence, problems, and preterm births ajog2010Twins prevalence, problems, and preterm births ajog2010
Twins prevalence, problems, and preterm births ajog2010
 
Exploring Infant Mortality
Exploring Infant Mortality Exploring Infant Mortality
Exploring Infant Mortality
 
Prevention of chronic noncommunicable diseases
Prevention of chronic noncommunicable diseasesPrevention of chronic noncommunicable diseases
Prevention of chronic noncommunicable diseases
 
Childhood Obesity
Childhood ObesityChildhood Obesity
Childhood Obesity
 
Economic And Social Consequences Of Diabetes
Economic And Social Consequences Of DiabetesEconomic And Social Consequences Of Diabetes
Economic And Social Consequences Of Diabetes
 
Literature Review Childhood Obesity
Literature Review Childhood ObesityLiterature Review Childhood Obesity
Literature Review Childhood Obesity
 
Health And fitness ( Zombies Group )
Health And fitness ( Zombies Group )Health And fitness ( Zombies Group )
Health And fitness ( Zombies Group )
 
Growing Trends: School-Based Community Gardens As A Grassroots Response To Ch...
Growing Trends: School-Based Community Gardens As A Grassroots Response To Ch...Growing Trends: School-Based Community Gardens As A Grassroots Response To Ch...
Growing Trends: School-Based Community Gardens As A Grassroots Response To Ch...
 
Clarian health health promotion inservice november 8, 2010
Clarian health  health promotion inservice  november 8, 2010Clarian health  health promotion inservice  november 8, 2010
Clarian health health promotion inservice november 8, 2010
 
Breastfeeding And The Risk Of Postneonatal Death In The United States
Breastfeeding And The Risk Of Postneonatal Death In The United StatesBreastfeeding And The Risk Of Postneonatal Death In The United States
Breastfeeding And The Risk Of Postneonatal Death In The United States
 
ChildObesityNJ2015
ChildObesityNJ2015ChildObesityNJ2015
ChildObesityNJ2015
 
Maternal and Child Mortality in the United States
Maternal and Child Mortality in the United StatesMaternal and Child Mortality in the United States
Maternal and Child Mortality in the United States
 
Hau.youth risk
Hau.youth riskHau.youth risk
Hau.youth risk
 
2. Mortality & Morbidity.pptx
2. Mortality & Morbidity.pptx2. Mortality & Morbidity.pptx
2. Mortality & Morbidity.pptx
 
Stillbirth epidemiology, diabetes, and other risk factors among all pregnanci...
Stillbirth epidemiology, diabetes, and other risk factors among all pregnanci...Stillbirth epidemiology, diabetes, and other risk factors among all pregnanci...
Stillbirth epidemiology, diabetes, and other risk factors among all pregnanci...
 
Running head MATERNAL, INFANT AND CHILD HEALTH .docx
Running head MATERNAL, INFANT AND CHILD HEALTH                   .docxRunning head MATERNAL, INFANT AND CHILD HEALTH                   .docx
Running head MATERNAL, INFANT AND CHILD HEALTH .docx
 
Final Draft (1)
Final Draft (1)Final Draft (1)
Final Draft (1)
 
Emergence Of Voluntary Neo Eugenics
Emergence Of Voluntary Neo EugenicsEmergence Of Voluntary Neo Eugenics
Emergence Of Voluntary Neo Eugenics
 
1st pia. 2
1st pia. 21st pia. 2
1st pia. 2
 
APHA - Poster Presentation
APHA - Poster PresentationAPHA - Poster Presentation
APHA - Poster Presentation
 

Mais de State of Utah, Salt Lake City

Health Data Transparency: Utah’s All Payer Claims Database
Health Data Transparency: Utah’s All Payer Claims DatabaseHealth Data Transparency: Utah’s All Payer Claims Database
Health Data Transparency: Utah’s All Payer Claims DatabaseState of Utah, Salt Lake City
 
Health Disparities by Utah Legislative District 2019
Health Disparities by Utah Legislative District 2019Health Disparities by Utah Legislative District 2019
Health Disparities by Utah Legislative District 2019State of Utah, Salt Lake City
 
The Utah Geological Survey provides timely scientific information about Utah’...
The Utah Geological Survey provides timely scientific information about Utah’...The Utah Geological Survey provides timely scientific information about Utah’...
The Utah Geological Survey provides timely scientific information about Utah’...State of Utah, Salt Lake City
 
Utah Division of Wildlife Resources Presentation to 2019 Legislature
Utah Division of Wildlife Resources Presentation to 2019 LegislatureUtah Division of Wildlife Resources Presentation to 2019 Legislature
Utah Division of Wildlife Resources Presentation to 2019 LegislatureState of Utah, Salt Lake City
 
Utah Division of Aeronautics Annual Needs and Accomplishments
Utah Division of Aeronautics Annual Needs and AccomplishmentsUtah Division of Aeronautics Annual Needs and Accomplishments
Utah Division of Aeronautics Annual Needs and AccomplishmentsState of Utah, Salt Lake City
 
Fourth Quarter FY2018 Quarterly Report from Utah DCFS
Fourth Quarter FY2018 Quarterly Report from Utah DCFSFourth Quarter FY2018 Quarterly Report from Utah DCFS
Fourth Quarter FY2018 Quarterly Report from Utah DCFSState of Utah, Salt Lake City
 
Transportation Policy and Funding: Historical and Emerging Trends
Transportation Policy and Funding: Historical and Emerging TrendsTransportation Policy and Funding: Historical and Emerging Trends
Transportation Policy and Funding: Historical and Emerging TrendsState of Utah, Salt Lake City
 

Mais de State of Utah, Salt Lake City (20)

Utah Veterinary Diagnostic Laboratory
Utah Veterinary Diagnostic LaboratoryUtah Veterinary Diagnostic Laboratory
Utah Veterinary Diagnostic Laboratory
 
Health Data Transparency: Utah’s All Payer Claims Database
Health Data Transparency: Utah’s All Payer Claims DatabaseHealth Data Transparency: Utah’s All Payer Claims Database
Health Data Transparency: Utah’s All Payer Claims Database
 
Utah Division of Juvenile and Justice Services
Utah Division of Juvenile and Justice ServicesUtah Division of Juvenile and Justice Services
Utah Division of Juvenile and Justice Services
 
Health Disparities by Utah Legislative District 2019
Health Disparities by Utah Legislative District 2019Health Disparities by Utah Legislative District 2019
Health Disparities by Utah Legislative District 2019
 
Localscapes
LocalscapesLocalscapes
Localscapes
 
Status of Translocated Tortoises in Southwest Utah
Status of Translocated Tortoises in Southwest UtahStatus of Translocated Tortoises in Southwest Utah
Status of Translocated Tortoises in Southwest Utah
 
The Logan River Observatory
The Logan River ObservatoryThe Logan River Observatory
The Logan River Observatory
 
Utah Strategic Workforce Presentation
Utah Strategic Workforce PresentationUtah Strategic Workforce Presentation
Utah Strategic Workforce Presentation
 
The Utah Geological Survey provides timely scientific information about Utah’...
The Utah Geological Survey provides timely scientific information about Utah’...The Utah Geological Survey provides timely scientific information about Utah’...
The Utah Geological Survey provides timely scientific information about Utah’...
 
Utah Forestry, Fire and State Lands 2019
Utah Forestry, Fire and State Lands 2019Utah Forestry, Fire and State Lands 2019
Utah Forestry, Fire and State Lands 2019
 
Utah Division of Wildlife Resources Presentation to 2019 Legislature
Utah Division of Wildlife Resources Presentation to 2019 LegislatureUtah Division of Wildlife Resources Presentation to 2019 Legislature
Utah Division of Wildlife Resources Presentation to 2019 Legislature
 
UDOT Presentation to 2019 Legislature
UDOT Presentation to 2019 LegislatureUDOT Presentation to 2019 Legislature
UDOT Presentation to 2019 Legislature
 
Utah System of Technical Colleges
Utah System of Technical CollegesUtah System of Technical Colleges
Utah System of Technical Colleges
 
Public Water System Identification in Utah
Public Water System Identification in UtahPublic Water System Identification in Utah
Public Water System Identification in Utah
 
State of Utah Suicide Prevention
State of Utah Suicide PreventionState of Utah Suicide Prevention
State of Utah Suicide Prevention
 
Utah Division of Aeronautics Annual Needs and Accomplishments
Utah Division of Aeronautics Annual Needs and AccomplishmentsUtah Division of Aeronautics Annual Needs and Accomplishments
Utah Division of Aeronautics Annual Needs and Accomplishments
 
Fourth Quarter FY2018 Quarterly Report from Utah DCFS
Fourth Quarter FY2018 Quarterly Report from Utah DCFSFourth Quarter FY2018 Quarterly Report from Utah DCFS
Fourth Quarter FY2018 Quarterly Report from Utah DCFS
 
Update on FirstNet in Utah
Update on FirstNet in UtahUpdate on FirstNet in Utah
Update on FirstNet in Utah
 
Energy Incentives in Utah - 2018 Audit
Energy Incentives in Utah - 2018 AuditEnergy Incentives in Utah - 2018 Audit
Energy Incentives in Utah - 2018 Audit
 
Transportation Policy and Funding: Historical and Emerging Trends
Transportation Policy and Funding: Historical and Emerging TrendsTransportation Policy and Funding: Historical and Emerging Trends
Transportation Policy and Funding: Historical and Emerging Trends
 

Último

Call Girls Kanakapura Road Just Call 7001305949 Top Class Call Girl Service A...
Call Girls Kanakapura Road Just Call 7001305949 Top Class Call Girl Service A...Call Girls Kanakapura Road Just Call 7001305949 Top Class Call Girl Service A...
Call Girls Kanakapura Road Just Call 7001305949 Top Class Call Girl Service A...narwatsonia7
 
Kolkata Call Girls Services 9907093804 @24x7 High Class Babes Here Call Now
Kolkata Call Girls Services 9907093804 @24x7 High Class Babes Here Call NowKolkata Call Girls Services 9907093804 @24x7 High Class Babes Here Call Now
Kolkata Call Girls Services 9907093804 @24x7 High Class Babes Here Call NowNehru place Escorts
 
Call Girls Whitefield Just Call 7001305949 Top Class Call Girl Service Available
Call Girls Whitefield Just Call 7001305949 Top Class Call Girl Service AvailableCall Girls Whitefield Just Call 7001305949 Top Class Call Girl Service Available
Call Girls Whitefield Just Call 7001305949 Top Class Call Girl Service Availablenarwatsonia7
 
Russian Call Girl Brookfield - 7001305949 Escorts Service 50% Off with Cash O...
Russian Call Girl Brookfield - 7001305949 Escorts Service 50% Off with Cash O...Russian Call Girl Brookfield - 7001305949 Escorts Service 50% Off with Cash O...
Russian Call Girl Brookfield - 7001305949 Escorts Service 50% Off with Cash O...narwatsonia7
 
Call Girls Frazer Town Just Call 7001305949 Top Class Call Girl Service Avail...
Call Girls Frazer Town Just Call 7001305949 Top Class Call Girl Service Avail...Call Girls Frazer Town Just Call 7001305949 Top Class Call Girl Service Avail...
Call Girls Frazer Town Just Call 7001305949 Top Class Call Girl Service Avail...narwatsonia7
 
VIP Call Girls Mumbai Arpita 9910780858 Independent Escort Service Mumbai
VIP Call Girls Mumbai Arpita 9910780858 Independent Escort Service MumbaiVIP Call Girls Mumbai Arpita 9910780858 Independent Escort Service Mumbai
VIP Call Girls Mumbai Arpita 9910780858 Independent Escort Service Mumbaisonalikaur4
 
Call Girl Bangalore Nandini 7001305949 Independent Escort Service Bangalore
Call Girl Bangalore Nandini 7001305949 Independent Escort Service BangaloreCall Girl Bangalore Nandini 7001305949 Independent Escort Service Bangalore
Call Girl Bangalore Nandini 7001305949 Independent Escort Service Bangalorenarwatsonia7
 
Call Girls Hosur Just Call 7001305949 Top Class Call Girl Service Available
Call Girls Hosur Just Call 7001305949 Top Class Call Girl Service AvailableCall Girls Hosur Just Call 7001305949 Top Class Call Girl Service Available
Call Girls Hosur Just Call 7001305949 Top Class Call Girl Service Availablenarwatsonia7
 
Sonagachi Call Girls Services 9907093804 @24x7 High Class Babes Here Call Now
Sonagachi Call Girls Services 9907093804 @24x7 High Class Babes Here Call NowSonagachi Call Girls Services 9907093804 @24x7 High Class Babes Here Call Now
Sonagachi Call Girls Services 9907093804 @24x7 High Class Babes Here Call NowRiya Pathan
 
VIP Call Girls Lucknow Nandini 7001305949 Independent Escort Service Lucknow
VIP Call Girls Lucknow Nandini 7001305949 Independent Escort Service LucknowVIP Call Girls Lucknow Nandini 7001305949 Independent Escort Service Lucknow
VIP Call Girls Lucknow Nandini 7001305949 Independent Escort Service Lucknownarwatsonia7
 
Mumbai Call Girls Service 9910780858 Real Russian Girls Looking Models
Mumbai Call Girls Service 9910780858 Real Russian Girls Looking ModelsMumbai Call Girls Service 9910780858 Real Russian Girls Looking Models
Mumbai Call Girls Service 9910780858 Real Russian Girls Looking Modelssonalikaur4
 
Russian Call Girls in Pune Riya 9907093804 Short 1500 Night 6000 Best call gi...
Russian Call Girls in Pune Riya 9907093804 Short 1500 Night 6000 Best call gi...Russian Call Girls in Pune Riya 9907093804 Short 1500 Night 6000 Best call gi...
Russian Call Girls in Pune Riya 9907093804 Short 1500 Night 6000 Best call gi...Miss joya
 
Call Girls Jp Nagar Just Call 7001305949 Top Class Call Girl Service Available
Call Girls Jp Nagar Just Call 7001305949 Top Class Call Girl Service AvailableCall Girls Jp Nagar Just Call 7001305949 Top Class Call Girl Service Available
Call Girls Jp Nagar Just Call 7001305949 Top Class Call Girl Service Availablenarwatsonia7
 
Call Girls In Andheri East Call 9920874524 Book Hot And Sexy Girls
Call Girls In Andheri East Call 9920874524 Book Hot And Sexy GirlsCall Girls In Andheri East Call 9920874524 Book Hot And Sexy Girls
Call Girls In Andheri East Call 9920874524 Book Hot And Sexy Girlsnehamumbai
 
Russian Call Girls Chickpet - 7001305949 Booking and charges genuine rate for...
Russian Call Girls Chickpet - 7001305949 Booking and charges genuine rate for...Russian Call Girls Chickpet - 7001305949 Booking and charges genuine rate for...
Russian Call Girls Chickpet - 7001305949 Booking and charges genuine rate for...narwatsonia7
 
call girls in green park DELHI 🔝 >༒9540349809 🔝 genuine Escort Service 🔝✔️✔️
call girls in green park  DELHI 🔝 >༒9540349809 🔝 genuine Escort Service 🔝✔️✔️call girls in green park  DELHI 🔝 >༒9540349809 🔝 genuine Escort Service 🔝✔️✔️
call girls in green park DELHI 🔝 >༒9540349809 🔝 genuine Escort Service 🔝✔️✔️saminamagar
 
Bangalore Call Girls Marathahalli 📞 9907093804 High Profile Service 100% Safe
Bangalore Call Girls Marathahalli 📞 9907093804 High Profile Service 100% SafeBangalore Call Girls Marathahalli 📞 9907093804 High Profile Service 100% Safe
Bangalore Call Girls Marathahalli 📞 9907093804 High Profile Service 100% Safenarwatsonia7
 
Housewife Call Girls Hoskote | 7001305949 At Low Cost Cash Payment Booking
Housewife Call Girls Hoskote | 7001305949 At Low Cost Cash Payment BookingHousewife Call Girls Hoskote | 7001305949 At Low Cost Cash Payment Booking
Housewife Call Girls Hoskote | 7001305949 At Low Cost Cash Payment Bookingnarwatsonia7
 
Call Girls Hebbal Just Call 7001305949 Top Class Call Girl Service Available
Call Girls Hebbal Just Call 7001305949 Top Class Call Girl Service AvailableCall Girls Hebbal Just Call 7001305949 Top Class Call Girl Service Available
Call Girls Hebbal Just Call 7001305949 Top Class Call Girl Service Availablenarwatsonia7
 
Aspirin presentation slides by Dr. Rewas Ali
Aspirin presentation slides by Dr. Rewas AliAspirin presentation slides by Dr. Rewas Ali
Aspirin presentation slides by Dr. Rewas AliRewAs ALI
 

Último (20)

Call Girls Kanakapura Road Just Call 7001305949 Top Class Call Girl Service A...
Call Girls Kanakapura Road Just Call 7001305949 Top Class Call Girl Service A...Call Girls Kanakapura Road Just Call 7001305949 Top Class Call Girl Service A...
Call Girls Kanakapura Road Just Call 7001305949 Top Class Call Girl Service A...
 
Kolkata Call Girls Services 9907093804 @24x7 High Class Babes Here Call Now
Kolkata Call Girls Services 9907093804 @24x7 High Class Babes Here Call NowKolkata Call Girls Services 9907093804 @24x7 High Class Babes Here Call Now
Kolkata Call Girls Services 9907093804 @24x7 High Class Babes Here Call Now
 
Call Girls Whitefield Just Call 7001305949 Top Class Call Girl Service Available
Call Girls Whitefield Just Call 7001305949 Top Class Call Girl Service AvailableCall Girls Whitefield Just Call 7001305949 Top Class Call Girl Service Available
Call Girls Whitefield Just Call 7001305949 Top Class Call Girl Service Available
 
Russian Call Girl Brookfield - 7001305949 Escorts Service 50% Off with Cash O...
Russian Call Girl Brookfield - 7001305949 Escorts Service 50% Off with Cash O...Russian Call Girl Brookfield - 7001305949 Escorts Service 50% Off with Cash O...
Russian Call Girl Brookfield - 7001305949 Escorts Service 50% Off with Cash O...
 
Call Girls Frazer Town Just Call 7001305949 Top Class Call Girl Service Avail...
Call Girls Frazer Town Just Call 7001305949 Top Class Call Girl Service Avail...Call Girls Frazer Town Just Call 7001305949 Top Class Call Girl Service Avail...
Call Girls Frazer Town Just Call 7001305949 Top Class Call Girl Service Avail...
 
VIP Call Girls Mumbai Arpita 9910780858 Independent Escort Service Mumbai
VIP Call Girls Mumbai Arpita 9910780858 Independent Escort Service MumbaiVIP Call Girls Mumbai Arpita 9910780858 Independent Escort Service Mumbai
VIP Call Girls Mumbai Arpita 9910780858 Independent Escort Service Mumbai
 
Call Girl Bangalore Nandini 7001305949 Independent Escort Service Bangalore
Call Girl Bangalore Nandini 7001305949 Independent Escort Service BangaloreCall Girl Bangalore Nandini 7001305949 Independent Escort Service Bangalore
Call Girl Bangalore Nandini 7001305949 Independent Escort Service Bangalore
 
Call Girls Hosur Just Call 7001305949 Top Class Call Girl Service Available
Call Girls Hosur Just Call 7001305949 Top Class Call Girl Service AvailableCall Girls Hosur Just Call 7001305949 Top Class Call Girl Service Available
Call Girls Hosur Just Call 7001305949 Top Class Call Girl Service Available
 
Sonagachi Call Girls Services 9907093804 @24x7 High Class Babes Here Call Now
Sonagachi Call Girls Services 9907093804 @24x7 High Class Babes Here Call NowSonagachi Call Girls Services 9907093804 @24x7 High Class Babes Here Call Now
Sonagachi Call Girls Services 9907093804 @24x7 High Class Babes Here Call Now
 
VIP Call Girls Lucknow Nandini 7001305949 Independent Escort Service Lucknow
VIP Call Girls Lucknow Nandini 7001305949 Independent Escort Service LucknowVIP Call Girls Lucknow Nandini 7001305949 Independent Escort Service Lucknow
VIP Call Girls Lucknow Nandini 7001305949 Independent Escort Service Lucknow
 
Mumbai Call Girls Service 9910780858 Real Russian Girls Looking Models
Mumbai Call Girls Service 9910780858 Real Russian Girls Looking ModelsMumbai Call Girls Service 9910780858 Real Russian Girls Looking Models
Mumbai Call Girls Service 9910780858 Real Russian Girls Looking Models
 
Russian Call Girls in Pune Riya 9907093804 Short 1500 Night 6000 Best call gi...
Russian Call Girls in Pune Riya 9907093804 Short 1500 Night 6000 Best call gi...Russian Call Girls in Pune Riya 9907093804 Short 1500 Night 6000 Best call gi...
Russian Call Girls in Pune Riya 9907093804 Short 1500 Night 6000 Best call gi...
 
Call Girls Jp Nagar Just Call 7001305949 Top Class Call Girl Service Available
Call Girls Jp Nagar Just Call 7001305949 Top Class Call Girl Service AvailableCall Girls Jp Nagar Just Call 7001305949 Top Class Call Girl Service Available
Call Girls Jp Nagar Just Call 7001305949 Top Class Call Girl Service Available
 
Call Girls In Andheri East Call 9920874524 Book Hot And Sexy Girls
Call Girls In Andheri East Call 9920874524 Book Hot And Sexy GirlsCall Girls In Andheri East Call 9920874524 Book Hot And Sexy Girls
Call Girls In Andheri East Call 9920874524 Book Hot And Sexy Girls
 
Russian Call Girls Chickpet - 7001305949 Booking and charges genuine rate for...
Russian Call Girls Chickpet - 7001305949 Booking and charges genuine rate for...Russian Call Girls Chickpet - 7001305949 Booking and charges genuine rate for...
Russian Call Girls Chickpet - 7001305949 Booking and charges genuine rate for...
 
call girls in green park DELHI 🔝 >༒9540349809 🔝 genuine Escort Service 🔝✔️✔️
call girls in green park  DELHI 🔝 >༒9540349809 🔝 genuine Escort Service 🔝✔️✔️call girls in green park  DELHI 🔝 >༒9540349809 🔝 genuine Escort Service 🔝✔️✔️
call girls in green park DELHI 🔝 >༒9540349809 🔝 genuine Escort Service 🔝✔️✔️
 
Bangalore Call Girls Marathahalli 📞 9907093804 High Profile Service 100% Safe
Bangalore Call Girls Marathahalli 📞 9907093804 High Profile Service 100% SafeBangalore Call Girls Marathahalli 📞 9907093804 High Profile Service 100% Safe
Bangalore Call Girls Marathahalli 📞 9907093804 High Profile Service 100% Safe
 
Housewife Call Girls Hoskote | 7001305949 At Low Cost Cash Payment Booking
Housewife Call Girls Hoskote | 7001305949 At Low Cost Cash Payment BookingHousewife Call Girls Hoskote | 7001305949 At Low Cost Cash Payment Booking
Housewife Call Girls Hoskote | 7001305949 At Low Cost Cash Payment Booking
 
Call Girls Hebbal Just Call 7001305949 Top Class Call Girl Service Available
Call Girls Hebbal Just Call 7001305949 Top Class Call Girl Service AvailableCall Girls Hebbal Just Call 7001305949 Top Class Call Girl Service Available
Call Girls Hebbal Just Call 7001305949 Top Class Call Girl Service Available
 
Aspirin presentation slides by Dr. Rewas Ali
Aspirin presentation slides by Dr. Rewas AliAspirin presentation slides by Dr. Rewas Ali
Aspirin presentation slides by Dr. Rewas Ali
 

Depression in Utah - Sep 2009 Report

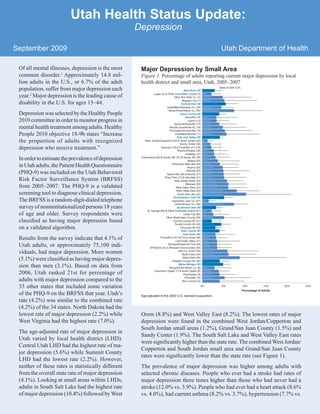
  • 1. Utah Health Status Update: Depression September 2009 Utah Department of Health Of all mental illnesses, depression is the most Major Depression by Small Area common disorder.1 Approximately 14.8 mil- Figure 1. Percentage of adults reporting current major depression by local lion adults in the U.S., or 6.7% of the adult health district and small area, Utah, 2005–2007 population, suffer from major depression each year.2 Major depression is the leading cause of disability in the U.S. for ages 15–44. Depression was selected by the Healthy People 2010 committee in order to monitor progress in mental health treatment among adults. Healthy People 2010 objective 18-9b states “Increase the proportion of adults with recognized depression who receive treatment.” In order to estimate the prevalence of depression in Utah adults, the Patient Health Questionnaire (PHQ-9) was included on the Utah Behavioral Risk Factor Surveillance System (BRFSS) from 2005–2007. The PHQ-9 is a validated screening tool to diagnose clinical depression. The BRFSS is a random-digit-dialed telephone survey of noninstitutionalized persons 18 years of age and older. Survey respondents were classified as having major depression based on a validated algorithm. Results from the survey indicate that 4.1% of Utah adults, or approximately 75,100 indi- viduals, had major depression. More women (5.1%) were classified as having major depres- sion than men (3.1%). Based on data from 2006, Utah ranked 21st for percentage of adults with major depression compared to the 33 other states that included some variation of the PHQ-9 on the BRFSS that year. Utah’s Age-adjusted to the 2000 U.S. standard population. rate (4.2%) was similar to the combined rate (4.2%) of the 34 states. North Dakota had the lowest rate of major depression (2.2%) while Orem (8.8%) and West Valley East (8.2%). The lowest rates of major West Virginia had the highest rate (7.0%). depression were found in the combined West Jordan/Copperton and South Jordan small areas (1.2%), Grand/San Juan County (1.5%) and The age-adjusted rate of major depression in Sandy Center (1.9%). The South Salt Lake and West Valley East rates Utah varied by local health district (LHD). were significantly higher than the state rate. The combined West Jordan/ Central Utah LHD had the highest rate of ma- Copperton and South Jordan small area and Grand/San Juan County jor depression (5.6%) while Summit County rates were significantly lower than the state rate (see Figure 1). LHD had the lowest rate (2.2%). However, neither of these rates is statistically different The prevalence of major depression was higher among adults with from the overall state rate of major depression selected chronic diseases. People who ever had a stroke had rates of (4.1%). Looking at small areas within LHDs, major depression three times higher than those who had never had a adults in South Salt Lake had the highest rate stroke (12.0% vs. 3.9%). People who had ever had a heart attack (8.6% of major depression (10.4%) followed by West vs. 4.0%), had current asthma (8.2% vs. 3.7%), hypertension (7.7% vs.
  • 2. 3.6%), and doctor diagnosed arthritis (7.5% Major Depression by Chronic Disease vs. 2.9%) had major depression at more than Figure 2. Percentage of adults reporting current major depression by twice the rate of those without those chronic selected chronic diseases, Utah, 2005–2007 conditions. Adults with diabetes (6.2% vs. 3.9%) also had higher rates of depression than those not diagnosed (see Figure 2). A multivariate analysis was performed to deter- mine if certain health behaviors were different for Utah adults who had major depression. The analysis controlled for age, sex, race, education, and employment as individual logistic regression models. Persons who were classified with major depression were 5.4 times more likely to report fair or poor health status, 2.3 times more likely to be current smokers, 1.8 times more likely to report binge drinking, and more than 1.5 times more likely to be obese when compared to people not classified with major depression. They were only about half as likely to engage in the rec- Age-adjusted to the 2000 U.S. standard population. ommended amount of physical activity. Major Hypertension and asthma data reported for 2005 and 2007. depression was not related to the consumption of fruits and vegetables (see Figure 3). Lifestyle Behaviors of Utahns With Major Depression Utah has a similar prevalence of major depres- Figure 3. Odds of lifestyle behaviors for persons with major depression sion when compared to other states using the versus persons without major depression, Utah, 2005–2007 PHQ-9 analysis, although geographic variation exists within the State. Major depression may be associated with certain chronic conditions, health, and health behaviors. Targeted screening for and treatment of depression should be con- sidered among persons who have had strokes or heart attacks and persons with chronic diseases. Public health efforts towards increased physical activity, smoking cessation, and alcohol addic- tion should recognize the impact of depression on these behaviors. Timely and appropriate interventions can help improve the quality of life of persons who suffer from this disease. References 1. U.S. Department of Health and Human Ser- vices. Healthy People 2010. 2nd ed. With Under- standing and Improving Health and Objectives Age-adjusted to the 2000 U.S. standard population. 5 a Day and recommended physical activity data reported for 2005 and 2007. for Improving Health. Washington, DC: U.S. Government Printing Office, November 2000. 2. National Institutes of Mental Health “The Numbers Count: Mental Disorders in America.” Retrieved from http://www.nimh.nih.gov/publicat/numbers September 2009 Utah Health Status Update .cfm#MajorDepressive on February 27, 2006. For additional information about this topic, contact Michael Friedrichs, MS, Bureau of Health Promotion, Utah Department A comprehensive report on these data is of Health, Box 142106, Salt Lake City, UT 84114-2106, (801) being prepared and will be available by 538-6244, email: mfriedrichs@utah.gov, or Jennifer Wrathall, fall, 2009 and can be accessed at http:// MPH, Office of Public Health Assessment, Utah Department of health.utah.gov/opha/publications/brfss/ Health, Box 142101, Salt Lake City, UT 84114-2101, (801) 538- Depression/Depression.html. 9259, email: jwratha@utah.gov
  • 3. Spotlights for August 2009 Breaking News, August 2009 Multiple Births Multiple Births Seen Through the Neonatal Follow-up Program (NFP), UDOH, Prospective Study of Very Natural incidence for twins is 1 in 80 (3%) and for triplets 1 in Low Birth Weight Babies, Nov. 2006–Nov. 2007 8000 (0.2%).* Since 1980 in the U.S. there has been an increase in Spontaneous ART multiple births by 75% for twins and by 220% for triplets and qua- Number of Children 192 133 druplets.* The increase in multiple births is attributed to delayed Number of Families 104 69 pregnancy, treatment with fertility drugs, and assisted reproduc- Twins 164 (85%) 80 (60%) tive technology (ART). In the U.S. in the year 2006, ART alone Triplets 9 (5%) 27 (20%) accounted for 1% of all deliveries and 18% of multiple births.* Quadruplets 0 (0%) 8 (6%) Gestational age at delivery decreases as fetal Single Survivor 19 (10%) 18 (14%) number increases. The average gestational Gravity of Illness age for triplets is 32 weeks and for quadru- Spontaneously Multiple plets 29 weeks in the U.S. (5 and 8 weeks Occurring Births as a early, respectively). Babies born early are at Number of Children (Percent) Multiple Births Result of ART risk for multiple long term problems. Pre- Average gestation 29 weeks 28 weeks (Term is 38–40 weeks and premature is 37 weeks and less) maturity is the most powerful predictor of Average birth weight cerebral palsy and the risk of cerebral palsy (1 pound = 454 grams) 1183 grams 1128 grams is increased among multiple births.* Newborn Intensive Care Unit (NICU) stay 68 days 68 days In summary, although positive achievements Discharged from NICU on oxygen 98 (51%) 78 (59%) (Infants with chronic lung disease) in science and technology are undeniable, one must weigh the possibility of undesirable Severe brain bleed placing the infant at risk for cere- 26 (14%) 28 (21%) bral palsy and cognitive impairment consequences such as extreme prematurity Retinopathy of prematurity requiring laser treatment which caries a risk for prolonged hospital placing the infant at risk for long term vision concerns 22 (11%) 12 (9%) stay, long term health problems, neurologi- Congenital anomaly 13 (7%) 24 (18%) cal deficit, and cognitive impairment. * References available upon request. Community Health Indicators Spotlight, August 2009 Salmonella Outbreaks of Salmonella have become a year-round occurrence; they are being identified and investigated even during the off-peak months for foodborne diseases. This new pattern is due in a large part to improved identification of outbreaks through specialized laboratory techniques that can help public health link distant illnesses together as outbreaks. Over the last 12 months, the Utah Department of Health and local health departments in Utah have partnered with the Centers for Disease Control and Prevention and other state and local health departments to investigate outbreaks of Sal- Average Number of Cases of Salmonellosis by Month of monella that have been linked to turkey products, Occurrence, Utah, 1999–2008 peanut butter products, and Salmonella cultures for school laboratories. Several other outbreaks were investigated for which no source was identified. During the spring of 2009, public health in Utah in- vestigated an outbreak of Salmonella infections linked to queso fresco, Mexican-style homemade raw-milk cheese, made privately in people’s homes. Public health officials believe the cheese was contaminated from ingredients used to make the queso fresco, or from cross-contamination of the cheese. Public health has advised the public to: only use pasteurized milk to make queso fresco; keep milk and other ingredients refrigerated; use proper food handling practices to avoid cross contamination; and only buy queso fresco from the refrigerated section of the grocery store, not street vendors or door-to-door salesmen.
  • 4. Monthly Health Indicators Report (Data Through July 2009) Expected/ Fiscal YTD # Expected Cases Budgeted Budgeted Variance # Expected YTD Morbidity Ratio budget҂ (under) Current Month҂ Current Month Current Month (5-yr average) (5-yr average) Month YTD Standard - over Fiscal # Cases YTD YTD҂ Medicaid Expenditures (in Millions) for (obs/exp) for the Month of July 2009† # Cases Capitated Mental Health $ 0.7 N/A $ 112.9 N/A N/A Monthly Report of Notifiable Inpatient Hospital $ 13.0 N/A $ 234.7 N/A N/A Diseases, July 2009 Outpatient Hospital $ 8.4 N/A $ 108.7 N/A N/A Campylobacteriosis (Campylobacter) 18 52 138 191 0.7 Long Term Care $ 11.2 N/A $ 203.1 N/A (N/A) Enterotoxigenic Escherichia coli (E. coli) 10 15 37 41 0.9 Pharmacy $ 2.4 N/A $ 129.0 N/A (N/A) Hepatitis A (infectious hepatitis) 0 2 3 12 0.2 Physician/Osteo Services‡ $ 6.4 N/A $ 86.5 N/A (N/A) Hepatitis B (serum hepatitis) 1 3 5 15 0.3 TOTAL HCF MEDICAID $ 121.3 N/A $ 1,721.1 N/A N/A Measles (Rubeola, Hard Measles) 0 0 0 0 -- % Change§ % Change§ Population Meningococcal Diseases 0 1 1 7 0.2 Charges in of Events Previous Previous Number Norovirus 0 3 6 12 0.5 Millions per 100 From From Total Pertussis (Whooping Cough) 7 26 106 236 0.4 Rate Year Year Salmonellosis (Salmonella) 23 36 156 179 0.9 Health Care System Measures Shigellosis (Shigella) 0 5 13 23 0.6 Overall Hospitalizations (2007) 278,952 9.7% -0.7% $ 4,265.9 +10.1% Varicella (Chickenpox) 0 7 334 459 0.7 Non-maternity Hospitalizations (2007) 164,659 5.6% -0.9% $ 3,554.6 +9.9% Viral Meningitis 4 13 16 46 0.3 Emergency Department Encounters (2007) 682,122 24.0% -1.3% $ 781.0 +17.1% West Nile (human cases) 0 2 1 2 0.4 Outpatient Surgery (2007) 296,596 10.5% -5.7% $ 1,109.0 +8.6% % Change§ Population # Expected YTD Current Quarter Current Quarter Morbidity Ratio Data Year (5-yr average) (5-yr average) Percent/ Previous Affected YTD Standard Number Current # Cases YTD at Risk # Expected From (obs/exp) Rate Year Annual Community Health # Cases Measures Cases Notifiable Diseases Reported Overweight and Obesity (Adults 18+) 2008 1,924,274 1,119,500 58.2% +0.5% Quarterly, 2nd Qtr 2009 Cigarette Smoking (Adults 18+) 2008 1,924,274 179,200 9.3% -20.4% HIV 17 23 39 42 0.9 Influenza Immunization (Adults 65+) 2008 237,275 173,900 73.3% -3.8% AIDS 10 10 23 23 1.0 Health Insurance Coverage (Uninsured) 2008 2,781,954 298,200 10.7% +0.7% Chlamydia 1,545 1,221 3,281 2,488 1.3 Motor Vehicle Crash Injury Deaths 2008 2,781,954 268 9.6 / 100,000 -3.3% Gonorrhea 84 175 180 354 0.5 Suicide Deaths 2008 2,781,954 384 13.8 / 100,000 +1.3% Tuberculosis 9 8 20 17 1.2 Diabetes Prevalence 2008 2,781,954 129,500 4.7% -1.0% Coronary Heart Disease Deaths 2008 2,781,954 1,514 54.4 / 100,000 -4.0% From Previous From 1 Year All Cancer Deaths 2008 2,781,954 2,478 89.1 / 100,000 -5.6% % Change§ % Change§ 1 Year Ago Previous Births to Adolescents (Ages 15-17) 2008 61,727 1,122 18.2 / 1,000 -2.0% Current Month Month Month Early Prenatal Care 2008 55,605 43,997 79.1% -0.4% Program Enrollment for the Ago Month of July 2009 Infant Mortality 2008 55,605 264 4.7 / 1,000 -7.9% Medicaid 197,248 195,257 +1.0% 166,026 +18.8% Childhood Immunization (4:3:1:3:3:1) 2008 53,525 39,400 73.6% -5.8% PCN (Primary Care Network) 23,438 24,103 -2.8% 19,068 +22.9% § % Change could be due to random variation. † The final Medicaid July old adjustment expendiures have not been posted and are not included in this report. The CHIP (Children’s Health Ins. Plan) 40,131 40,742 -1.5% 34,491 +16.4% Medicaid service expenditures reported here are the most current as of the release date of this report. ҂ Determination on tier 1 and tier 2 unemployment enhancements and the ARRA rate differentials for the the school districts are still being decided. For these two reasons the total Medicaid Budget amounts are not ready to be released. ‡ Medicaid payments reported under Physician/Osteo Services do not include enhanced physician payments. Notes: Data for notifiable diseases are preliminary and subject to change upon the completion of ongoing disease investigations. Active surveillance for influenza has ended until the 2009 season.