
Recomendados
Recomendados
Mais conteúdo relacionado
Semelhante a Memory Behavior Analysis
Semelhante a Memory Behavior Analysis (20)
Último
Último (20)
Memory Behavior Analysis
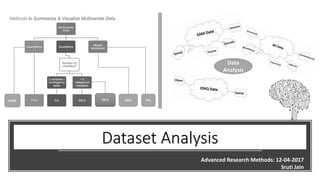
- 1. Data Analysis Dataset Analysis Advanced Research Methods: 12-04-2017 Sruti Jain BADA MFA PLS
- 2. Introduction: Dataset information Datasets Analyzed: 1. The survey of autobiographical memory (SAM) Dataset 2. Object-Spatial Imagery Questionnaire (OSIQ) Dataset 3. BIG 5 personality questionnaire (BFI) Dataset Rows: Total participants of 144 after excluding the mystery group. Supplementary Observations: 9 (mystery group) Columns: 1. Design: memoryGroups, Sex, Age 2. 26 variables (SAM), 30 variables (OSIQ) & 44 variables (BFI) Research Question: How the questions are related to memory & how is behavior and memory related to one another?
- 3. Correlation Plots (1/3) SAM Dataset OSIQ Dataset Episodic Semantic Spatial Future Object Spatial
- 4. Correlation Plots (2/3) BFI Dataset SAM & OSIQ Combined Extraversion ConscientiousnessAgreeableNeuroticism Openness Object Spatial
- 5. Correlation Plots (3/3) Neuroticism Spatial Imagery
- 6. Principal Component Analysis (PCA) Data Analysis BADA MFA PLS
- 7. Results (PCA): Factor Scores
- 8. Results (PCA): Loadings Spatial Imagery Object Imagery SAM Dataset OSIQ Dataset Loadings Plot - SAM Component 1 Inertia: 30.85% Component2Inertia:15.17%
- 9. Results (PCA): Loadings BFI Dataset Openness Agreeable Extraversion Conscientiousness Neuroticism Component 1 Inertia: 17.61% Component2Inertia:9.78%
- 10. PCA Conclusions • Component 1 • Row: Normal versus High Memory group for all the three datasets • Column: • Normal versus High Memory scores (SAM) • Object versus Spatial Imagery (OSIQ) • Neuroticism versus all other personality traits. • Component 2 • Column: Spatial & semantic versus episodic & future memory • Shows negative correlation between spatial and future memory ratings.
- 11. Multiple Correspondence Analysis (MCA) Data Analysis BADA MFA
- 12. Variable Binning
- 13. Results (MCA): Factor Scores Component 1 Inertia: 84.76% Component2Inertia:7.35% Component 1 Inertia: 84.76% Component2Inertia:7.35% Component 1 Inertia: 84.76% Component2Inertia:7.35%
- 14. Results (MCA): Loadings Component 1 Inertia: 84.76% Component2Inertia:7.35%
- 15. MCA Conclusions • Component 1 • Row: Normal versus High Memory group • Column: Normal versus High Memory scores • So Component 1 mainly distinguishes people with high versus normal memory group • Component 2 • Isn’t really explaining much in loadings or factor score plot.
- 16. Barycentric Discriminant Analysis (BADA) Data Analysis BADA MFA PLS
- 17. Result (BADA): Factor Score Plots Component 1 Inertia: 75.80% Component2Inertia:16.46%
- 18. Result (BADA): Loadings Plot Component 1 Inertia: 75.80% Component2Inertia:16.46%
- 19. BADA Conclusions Component 1: The latent structure of the SAM data as revealed by BADA indicated that the first component characterized good versus poor memory. In other words, when people reported having high or low abilities for one category of memory, they tended to do the same for other categories. Component 2: Mainly composed of Spatial memory variable. People who are generally good at Spatial memory task have a poor future thinking ability as they are negatively correlated. Combining the loading with the factor score plots we can infer that age and gender have no effect on memory.
- 20. Partial Least Square Analysis (PLSC) Data Analysis BADA MFA PLS
- 21. Result (PLS): Latent Variable Plot Component 1 The X-latent variables for Dimensions 1 and 2 – Design AgeThe X-latent variables for Dimensions 1 and 2 – Design Memory Groups Component 1 Inertia: 82.37% Component2Inertia:11.27% Component 1 Inertia: 82.37% Component2Inertia:11.27% Result (PLS): Latent Variable Plot Component 1 The X-latent variables for Dimensions 1 and 2 – Design AgeThe X-latent variables for Dimensions 1 and 2 – Design Memory Groups Component 1 Inertia: 82.37% Component2Inertia:11.27% Component 1 Inertia: 82.37% Component2Inertia:11.27%
- 22. Result (PLS): Latent Variable Plot Component 2 The Y-latent variables for Dimensions 1 and 2 – Design AgeThe Y-latent variables for Dimensions 1 and 2 – Design Memory Groups Component 1 Inertia: 82.37% Component2Inertia:11.27% Component 1 Inertia: 82.37% Component2Inertia:11.27%
- 23. Result (PLS): Salience Plot SAM Variables OSIQ Variables Spatial Imagery Object Imagery Component 1 Inertia: 82.37% Component2Inertia:11.27% Component 1 Inertia: 82.37% Component2Inertia:11.27% Result (PLS): Salience Plot SAM Variables OSIQ Variables
- 24. PLS Conclusions • Component 1 • Row: Normal versus High Memory group • Column: Normal versus High Memory scores • Column: Object imagery versus spatial imagery (OSIQ) • So Component 1 mainly distinguishes people with high versus normal memory group • Component 2 • Column: Spatial versus future memory • Distinguishes questions relating to spatial memory versus future memory. Also shows negative correlation between spatial and future memory ratings.
- 25. Multiple Factor Analysis (MFA) Data Analysis BADA MFA PLS
- 26. Result (MFA): Factor Score PlotsResult (MFA): Factor Score Plots Component 1 Inertia: 17.03% Component2Inertia:7.67% Component 1 Inertia: 17.03% Component2Inertia:7.67%
- 27. Result (MFA): Partial Factor Score Plots Partial factor score plot – Table 1 Partial factor score – Plotting Mean of each table with Design – Memory GroupsPartial factor score plot – Table 1 Partial factor score – Plotting Mean of each table with Design – Memory GroupsPartial factor score – Plotting Mean of each table with Design – Memory Groups Result (MFA): Partial Factor Score Plots Partial factor score plot – Table 1 Component 1 Inertia: 17.03% Component2Inertia:7.67% Component 1 Inertia: 17.03% Component2Inertia:7.67%
- 28. Result (MFA): Loadings Plot Component 1 Inertia: 17.03% Component2Inertia:7.67% Component 1 Inertia: 14.69% Component2Inertia:8.11%
- 29. Result (MFA):Inner product C matrix factor Score plot Component 1 Inertia: 14.69% Component2Inertia:8.11% Component 1 Inertia: 17.03% Component2Inertia:7.67%
- 30. Overall Conclusions Component 1 distinguishes High versus Normal Memory Groups across all the three datasets. It mainly comprises of Neuroticism questions from all others in the Combined Dataset. Also Inner Product Combined Data, we see that component 1 separates Memory versus behavior datasets. Component 2 mainly distinguishes between spatial and object memory (OSIQ) and also future versus spatial memory components (SAM). Also there is an effect of Gender but it is not very significant on Component 2. Gender is also imbalanced variable as male count is 107 & female count is 37 which might affect the results. There is also no effect of age on memory or behavior as per the analysis.