2. 64 2 Design Essentials—Friction Material Composite System
BFMC Development Calls for the Following Considerations Friction coeffi-
cient and its stability over a range of operating conditions. The mating part or the
contacting surface and the contact surface form a friction pair and the properties of
the counterpart rotor in the case of a disc brake, influence the μ not only directly but
also indirectly because of complex interactions between material and counterpart
surface. The main material members are polymer matrix fibrous filler particulate
fillers of metal or mineral and lubricants.
The friction of a matrix and its stability upon the type of polymer used can be
affected by the degree of polymerization or cross linking induced. Oxidation during
chemical changes in the surface of the polymer is a result of service.
Most commonly used polymers are straight or modified phenolic or other ther-
mosetting resins and elastomeric polymers.
Polymer blends are invariably used to bring up a compromise between thermal
stability and modulus of elasticity. The advantages of a highly thermally stable poly-
mer are offset by the disadvantage of its high modulus of elasticity.
Among the resins epoxies with amides, and polyimides are a good possibility.
It is up to the designer to bring up an advantage in price working on ratios while
meeting the cost and meeting the technical requirements. The loss in friction of
the less stable material is partly reversible for its μ increases when the operating
temperatures are reduced.
Fiber reinforcement has a primary role to maintain intrinsic friction coefficient
in a design, for instance in the case of asbestos, higher stable friction coefficient is
maintained by virtue of its large area of contact. It deforms easily to give a large
area of contact and fiber bundles easily open up to give clean surfaces.
In the Case of Other Fibers and Particulate Fillers Particulate fillers: General
rule is friction coefficient of any filler is approximately 10–15 % of its hardness
which is related to logarithm of their Vickers Hardness Number (VHN).
Harder mineral fillers: increase in friction of the material Alumina increases the
average friction level but μ also increases considerably as the speed decreases dur-
ing a single application. To avoid such side effects very careful modification of other
members is required.
Softer metals usually increase μ but their effect decreases with the increase in
operating temperatures. The μ of metals vary from 0.30 in antimony to 1.00 for
aluminium with MOS2 0.10 with graphite having a μ of 0.20. Adsorption of water
vapor or degradation products on the surface of the graphite can cause friction to
vary with temperature.
2.1 Brake and Vehicle Data
Designing the friction material composite calls for the essentials integrated to the
brake and vehicle design data (Table 2.1). Friction material composite performance
varies from brake to brake and vehicle to vehicle. It relies more on what brake in
3. 2.1 Brake and Vehicle Data 65
operation in a given vehicle design model. Example duo servo mechanism, Hy-
draulic mechanism, Air assisted hydraulic mechanism, vacuum brakes etc. will vary
the performance of the friction material pad or a liner in different vehicle system.
In order to design a good friction material composite for a given brake system in
a given vehicle model the design inputs need validation and complete testing in
that respective vehicle model. It would be wise to understand and acquire the basic
essential knowledge of the brake system and about the vehicle overall in order to
design the friction material composite system.
Minimum Design Requirement for a Good Friction Material Composite
While we understand the braking needs and vehicle needs for a good friction
material design, essentially the following computation needs to be understood
to calculate the kinetic energy absorption/work done and horse power calcula-
tions/retardation force and finally the torque. In order to achieve the required fully
developed mean deceleration the relationship between coefficient of friction μ for
different line pressures can be correlated with the torque. An interesting mechanism
controlled by the material inputs indicates even a minimum μ of 0.32–0.34 at max-
imum line pressure the material can generate adequate torque to give the required
fully developed mean deceleration. Here the brake system plays a crucial role when
the operating variables like cut in pressure, pedal effort at knee point deceleration,
booster size all play a good role.
Details of torque computation for a typical disc pad application are given for
reference.
2.1.1 Data Collection Before Attempting Any Design
Table 2.1 Brake and vehicle data
Vehicle details Passenger car I Passenger car II
Gross vehicle weight 1280 (kgs) 1443 (kgs)
Maximum speed of vehicle (Kph) 200 200
Classification as per JASO C406 PA PA
Roll radius of tyre F : 0.279 m F : 86 %
R: 0.279 m R: 14 %
Brake front Ventilated disc Ventilated disc
Type C caliper Type C caliper
Size φ 256φ mm ∗ 24 mm thick 256φ mm ∗ 24 mm thick
Mean effective radius 95 mm 105 mm
Nominal Mu 0.42 0.42
Pad area 35 cm2 /pad 45 cm2 /pad
Wheel cylinder φ 51 mm 52 mm
Maximum hydraulic pressure 85.0 kg/cm2 110 kg/cm2
Pedal gain 4.10 4.50
4. 66 2 Design Essentials—Friction Material Composite System
Table 2.1 (Continued)
Vehicle details Passenger car I Passenger car II
Booster ratio 3.15 5.00
Overall gain 12.91 22.50
Master cylinder φ 20.63 mm 22.22 mm
Cut in pressure 30 30
Valve ratio 4.0 (0.25) 3.33 (0.30)
Type PCRV PCRV
Pressure controlled Pressure controlled
Release valve Release valve
2.1.2 Basic Engineering Calculations to Design Based on the
Theoretical Torque
Table 2.2 Basic engineering calculations
Vehicle model Passenger car I Passenger car II
(1280) (1443)
K.E. absorbed at 1
2 ∗ 9.81 ∗ (27.77)2 = 50310 Kgm 1
2 ∗ 9.81 ∗ (27.77)2 = 56717 Kgm
100 Kph
100 kmph = 27.77 m/sec 100 kmph = 27.77 m/sec
Area/brake 2 ∗ 35 cm2 = 70 cm2 2 ∗ 45 cm2 = 90 cm2
Kgm/cm2 of disc pads 309 kgm/cm2 270 kgm/cm2
Horsepower 0.6g 0.6g
calculation
Assume a ‘g’ 0.6g 0.6g
(constant deceleration)
Stop time from 100 27.77
0.6∗9.81 = 4.71 sec 27.77
0.6∗9.81 = 4.71 sec
Kph (sec) or 27.77 mps
Rate of work done 21633
4.71∗75 = 61.23 HP 24388
4.71∗75 = 69.03 HP
(HP)
HP/cm2 of disc brake 61.23/70 = 0.87 HP/cm2 69.03/90 = 0.76 HP/cm2
for two pads (70 cm2 )
μ value from dyno test 0.34 (assumed) 0.34 (assumed)
from 100 Kph
Total retarding force F = (W/g) ∗ a F = (W/g) ∗ a
from 100 Kph/0.6g 1280
9.81 × 27.7
9.81∗0.6 = 615 kg 1443
9.81 × 27.77
9.81∗0.6 = 694 kg
Retarding force/Front disc brake at 615 × 0.86 × = 264.45 kg1
2
(assuming a braking ratio of 0.86 in the front to 0.14 in the rear).
Torque Kgm 264 × 0.279 = 73.65 kg
(retardation force × rolling radius)
With the above said information one can calculate the theoretical torque (Ta-
ble 2.2) that the friction material design can generate. It can be tested and verified
with the dynamometer test.
5. 2.2 Design Drawing as an Input from the Original Equipment Manufacturer 67
2.1.3 Limiting Brake Torque
Limiting Brake Torque computation is calculated for the cast iron disc material of
the disc under GG classification. For a given deceleration ‘g’ based on a given brak-
ing ratio and inertia, limiting brake torque is computed as below and if it exceeds
the torque calculated based on ‘g’ and braking ratio then the disc size requires im-
provement.
Torque equation:
(TE − TA ) · α · ABS
M=
1 − exp − CP ·GBS × t 2 · π · n
α·A
a = 59.7 J/m2 s K Material constants for GG
cP = 51 J/N K Material constant for GG
cP = Specific heat storage capacity (J/N K)
GBS = Weight of brake disc [N]
TE = Final temperature [°C]
TA = Start temperature [°C]
a = Transmission coefficient [J/m2 s K]
ABS = Transmission surface [m2 ]
t = Braking time [s]
It requires extensive understanding of multiphase, phase transfer and mass trans-
fer issues to decide based on the material classification and for a rotor size based on
the above. It is dealt with in detail in Volume 2.
2.2 Design Drawing as an Input from the Original Equipment
Manufacturer
The brake design drawing with the pad/liner furnished by the OE manufacturer will
bear the complete dimensions to scale, the brake system and the friction material
pad/liner in the case of automobile/brake block in the case of rail applications. A
sample copy of the approved design drawing from the design department would
give the details of critical essential technical specifications for testing and data for
approval. Besides that, the dimensions, with the tolerance, is to be completed for
several views of the component design.
Generally with the launch of any new vehicle model the design validation proce-
dure goes for the first 1–2 years of field performance. It will be subject to changes
and validation again as the theoretical design evolved will bear some modifications
once it comes into the field with the other members of the vehicle working together.
A good design should work well before the launch of the vehicle model and
would require only fine tuning of its component members after it is launched.
A typical design drawing is one approved by the design department of the vehicle
manufacturer that normally takes into account the braking and vehicle manufactur-
ers requirements.
6. 68 2 Design Essentials—Friction Material Composite System
A typical Original Equipment design drawing for a friction material design
should bear the critical dimensions besides the overall dimensions to scale and spe-
cific test requirements which are relevant to field design requirements.
Tool correction, changes are a part of prototype tool development, should ad-
here to strict standard specifications and dimensions. It should be well within the
tolerance limits.
2.2.1 Brake and Vehicle Data
a) Vehicle manufacturer
b) Gross vehicle weight in kilograms
c) Front axle weight/Rear axle weight in kilograms
d) Maximum speed of the vehicle (Kmph)
e) Classification as per/Tatas/AK Masters/SABS/JASO etc.
f) Rolling radius of the tyre (mm)
g) Braking ratio—Front to rear
h) Front brake disc and caliper type like ventilated/solid caliper C type
i) Size of the brake
j) Piston dia. (mm)/No. of pistons
k) Mean effective radius
l) Nominal μ
j) Pad contact area
k) Rear brake size
l) Rear wheel cylinder diameter (mm)
m) Maximum hydraulic pressure
n) Pedal gain
o) Booster ratio
p) Overall gain
q) Master cylinder diameter
r) Cut in pressure
s) Valve ratio with type of valve
With some of the above said inputs, braking ratio could be worked out as given
below: (values are assumed)
Gross Vehicle Weight: 1345 Kgs
Rolling radius: 0.262 m
2.3 Braking Ratio
2
DR BERR BF R PR
2
× × ×
DF BERF BF F PF
7. 2.4 Inertia 69
DR = Wheel cylinder dia.—Rear 17.46 mm
DF = Piston diameter—Front 50 mm
BERR = Mean effective radius—Rear 0.09 m
BERF = Mean effective radius—Front 0.095 m
BF R = Brake factor—Rear = 2.0
BF F = Brake factor—Front = 0.8
PR = PF up to 35 kg/cm2 and valve ratio is 0.4
For PF of 77 Kg/cm2 PR = 35 + (77 − 35) × 0.4 = 51.8 Kg/cm2
Rear (17.46)2 2.0 0.09 51.8
= × × ×
Front 502 8.0 0.095 77
2842.4 = BR = 83.7 : 16.3 (F : R) 14630
2.4 Inertia
W
I= × (RR)2 × BR × 1/2
G
W = Gross vehicle weight in Kgs
G = Acceleration due to gravity (9.81 m/sec2 )
RR in meter
BR: Braking ratio
1345
I= × (0.262)2 × 0.837 × 1/2 = 3.94 Kgm sec2
9.81
Disc Rpm (N )
16.67
N= × V (in Kph)
2πRR
= K1 × V V = in Kph
RR = in meter
K1 = 2×3.143×0.262 = 10.122
16.67
Mean torque via stopping distance (SD)
Work done or energy absorbed WD = 0.5 × I × (ω)2
WD = T × Φ
Therefore 0.5 × I × (ω)2 =T ×Φ
I = Moment of inertia
ω = angular velocity
Φ = Stopping distance in radians = S/RR
S = Stopping distance in ‘m’
RR = Rolling radius in ‘m’
×(ω)2
T = 0.5×IΦ
8. 70 2 Design Essentials—Friction Material Composite System
Friction coefficient
T =2×p×A×μ×r
μ = (T /p) × K3
where
1
K3 =
2 × r × A × Hydraulic efficiency
T = Torque (Kg m)
P = Pressure (Kg/cm2 )
A = Area of caliper piston (cm2 )
r = Mean effective radius of disc
Note: Hydraulic efficiency assumed as 100 %
Constant keyed in for computation is based on for a given piston diameter.
2.5 Constants
Vehicle speed to disc revolutions per minute (RPM)
Disc (revolutions per minute) 16.67/2π × RR × V in Kmph
K1 = V /2π × RR where RR is rolling radius
Assuming 60 kph 16.67/(2 × 3.143 × 0.262)
K1 × V K1 = 10.122
Hence disc rpm = 10.122 × 60 = 607 rpm
K2 = Deceleration via torque T = I × angular deceleration
Angular deceleration = Linear deceleration/roll radius
Linear deceleration = (T × RR)/I
Friction coefficient μ (brake factor) = T /p × K3
K3 = 2/r (mean effective radius) × A (piston area) × hydraulic efficiency
K3 = 0.501 ∗ T
K4 = Disc drag/Normal load (brake input)
Disc drag = Torque/Mean effective radius of disc
K4 = Disc drag/Pressure × area of piston × 2 (input load − normal force)/ 0.501
= 1.05.
2.6 Terrain/Landform Topography as a Design Input
Different terrains with their topographical variations become a critical factor for a
design to be successful or a failure. Variations in terrain such as hills/valleys/plains/
rugged terrain/hot/cold/moderate terrains all need to be factored while designing, as
they have serious implication on the frictional performance, high temperature wear
and fade/recovery characteristics.
9. 2.7 Contacting Surface—Rotor Disc and Drum Details as a Design Input 71
In the case of a hot desert with hot days and cool nights the outside temperature
variations can severely harm the brake and similarly in a valley with continuous
snowfall for most part of the year and a hilly region with heavy rains throughout
the year require very careful planning of the design of the friction material compos-
ite. In my next volume details of the design for the terrain and climatic variations
will be dealt with in greater detail. Normally all terrain variations are factored for
the respective terrains in the test schedule while qualifying the brake. Additionally
vehicle testing and field evaluation would give further leads in understanding the
brake systems if there are any specific issues to be addressed.
2.7 Contacting Surface—Rotor Disc and Drum Details as
a Design Input
2.7.1 Friction Induced Changes at the Rotor Surface
Brake discs are normally made from cast iron. Both a Vented disc and a solid disc
are widely used for commercial and technical reasons and each has its own unique
characteristics of performance and wear when we brake. The bulk microstructure
of the rotor comprises of graphitic flakes in a pearlitic matrix. Turning or grinding
of the surface gives a surface finish. After such a finish the surface is grooved and
shows a bright contrast. When friction material surface comes into contact with
the rotor while braking the rotor surface is covered with gray, sometimes brownish
layer when viewed through a microscope. The sites covering the friction material
layer will not exhibit the grooves [39, 40].
Typical Technical Specifications of a Rotor Whether It Is a Grey Cast Iron/or
Alloys
GG20 Cr Cu HC
Carbon—3.70–3.90 % by weight
Chrome—0.20–0.35 % by weight
Copper—0.50–0.65 % by weight
Brinnell Hardness HBS/750 = 205 ± 5
Surface Treatment Given on the Rotor Surface
Surface machining of the friction ring-fine tuned.
Roughness “R3z5”
Zinc surface protection (Zn)—thickness 8 to 20 µm
10. 72 2 Design Essentials—Friction Material Composite System
When we study the microstructure of the rotor discs the cast iron substrate will yield
a pronounced channeling contrast. Due to severe plastic deformation fragmentation
due to deformation is visible and is filled normally by the wear troughs.
Friction materials for disc brake applications have to be designed to provide a
reliable friction behavior for a large variety of different stressing parameters such as
velocity, pressure, temperature and humidity. The designing of the friction material
portion are done in such a way that the desired properties are met. It is highly im-
probable that the distribution of the various constituents can bring about a perfect
homogeneity in a millimeter or a micro scale. Generally the micro constituents tend
to bind themselves with the macro constituents e.g. in the form of a coating on steel
fibers and Sb2 S3 (antimonium trisulphide) or as a premix of MOS2 (molybdenum
disulphide), SnS (tin sulphide) and or Sb2 S3 with silicates such as biotite or vermi-
culite. The macro constituents should be distributed evenly in the surface and the
spacing between them will normally be several millimeters.
The fine microstructure and homogenous chemical composition of friction lay-
ers on both pad and rotor suggest that the iron oxide contains inclusions of solid
lubricants on a very fine scale in the form of nanoparticles.
2.8 Brake Roughness
Disc brake roughness, a rigid body vibration, is caused by brake torque variations
mostly at wheel rotation frequency. It is felt as a tactile pulsation by the driver who
drives, as it often feeds back through the brake pedal and also in the steering wheel.
Both the driver and the passenger may feel brake roughness through vehicle vibra-
tions. It also occasionally causes sheet metal vibration [64].
2.8.1 Roughness—Vibrational Noise
Many vibrations that are not due to brake roughness can occur at wheel rotation
frequency. For example, tire and wheel unbalance can cause tactile and visual vi-
brations that may be sensed at the steering wheel. However, such vibrations do not
require application of the brakes and tend to occur only at specific narrow speed
ranges (typically at 50–60 mph and 70–80 mph, sometimes as low as 30–35 mph).
Poor suspension alignment, bent wheels, and some road surface irregularities can
produce vibrations that are similar to the ones caused by brake roughness. Some-
times these may be more pronounced when the brakes are applied. Therefore, it
is important to be careful in diagnosing and rating brake roughness on a vehicle.
Proper vehicle instrumentation can be used to identify, quantify, and document brake
roughness test data.
Disc brake roughness has been around for a long time, and has many root causes.
Much has been understood on the causes,cures and on testing.
11. 2.8 Brake Roughness 73
Roughness may show up only with cold brakes, sometimes with warmed brakes,
or sometimes for all brake applications. Most vehicles have suspension and steering
systems that get excited into greater vibration amplitudes at certain vehicle speeds
(e.g., 30 mph). Prior brake usage history affects brake temperature distributions,
their resultant brake thermal distortions, and thus also the tendency toward rough-
ness. Experienced test drivers often choose a smooth road, then use specific vehicle
speeds and brake usage sequences to search for brake roughness. Different vehicle
suspensions, different steering systems, different caliper designs, different brake ro-
tors, and different brake linings can all change the occurrence and severity of brake
roughness.
New vehicle start-up time [34] is often a major concern about NVH problems
in general and brake roughness in particular. Prototype vehicles may have brake,
suspension, and steering components that differ from the initial production parts. At
times the new parts may appear to be better, closer to print nominal values, better
finishes, etc. However, if they are different in any way, they may possibly show
more roughness. Even if the production parts are not changed, the higher number of
vehicles from full production may provide some with disc brake roughness.
Some new vehicles may exhibit a brake roughness, including a pulsing feel on
the brake pedal, especially during a light brake application. These symptoms may
disappear after a few brake applications. If so, they probably resulted from con-
tamination of the rotor surface. Local rusting of the rotor and/or oil/grease/paint
contamination of the rotor may be the causes.
If the problem worsens with usage, a systematic diagnostic is required. Rotors
from problem vehicles should be measured for thickness variation (DTV), lateral
run out, and run out second harmonic. At a minimum, this should be measured at
the rotor mid-plane, but preferably also near the Outer Diameter and Inner Diame-
ter. Vehicles vary in their sensitivity to rotor dimensional characteristics. Such sen-
sitivity studies should be performed using production brake linings for the vehicle.
Some brake linings have different elastic and frictional properties, so they influence
the rotor dimensional requirements for an acceptable brake rating.
The brake linings used to evaluate brake roughness should be fully burnished. To
ensure that the rating corresponds to steady-state customer usage conditions. When
rating tests are run, the brake mechanic needs to be extremely careful to ensure that
neither the test linings nor the test rotor rubbing surfaces are contaminated by finger
contact, or oil, grease, paint, or other extraneous materials.
Brake Roughness—Mileage Factor
Some semimetallic and Non-asbestos Organic brake pads cause brake roughness to
worsen with time and vehicle mileage accumulation. This type of disc brake rough-
ness results from a combination of abrasive pad surfaces and frequent highway/
expressway driving.
At least 2500 km of highway driving conditions, with a minimum of brake usage,
is needed to develop high mileage roughness. Since it is mileage and usage sensi-
tive, high mileage roughness may not appear until after 35000 km. Many roughness
12. 74 2 Design Essentials—Friction Material Composite System
symptoms only show up after Fifteen thousand km on the highway. It is not uncom-
mon for drivers to first notice brake roughness after an extended driving vacation,
since this type of driving hastens roughness occurrence. With higher mileage on the
high way due to minimal usage of the brake roughness issue enhances. Abrasive
particles at the brake pad surface can be the first to contact the rotor. Under normal
brake pressures, and when the brakes are heated, most abrasive particles are em-
bedded into the brake pad surface. This limits their abrasive action. However, when
driving at highway speeds with the brakes are released and cooled, a brake pad may
gently and locally rub the rotor.
The abrasive particles may ‘stand proud’ of the surface and dominate the contacts
at such times. Eventually, this local contact of the rotor by the brake pad (especially
by abrasive particles at the lining surface) will locally wear the rotor. This local
rotor wear provides a rotor thickness variation, called RTV. RTV produces uneven
braking torques that may be especially noticeable on gentle brake applications. The
resultant periodic brake torque variations, and their associated brake pedal pulses,
provide initial brake roughness.
2.8.2 Rotor Wear
It is always the localized rotor wear produces most brake roughness. This local
wear almost always is produced during vehicle usage when the brake is released. It
is commonly worse when the brake pads are cool (below the binder resin glass tran-
sition temperature). Under these conditions, a small amount of local brake dragging
wears the rotor at the local contact site. With most disc brakes, this wear is con-
fined primarily to the inboard rotor face. The section Brake Design Factors provides
a more complete explanation why the inboard brake pads cause most brake rotor
RTV problems.
2.8.3 Rotor Thickness Variation due to Excessive Heat
Once the rotor has developed significant RTV, gentle brake applications provide
uneven heating of the rotor. This becomes thermally induced RTV which increases
the initial rotor RTV. Now the brake roughness is more severe. At higher speeds
when it reaches the point it excites suspension or steering component, the brake
roughness is observed to be higher.
2.8.4 Disc Brake Roughness (DBR) Measurement
Vehicle Roughness Measurements
Drivers sense brake roughness through the brake pedal, steering wheel, seat assem-
bly, floorboards, as well as through both visual and audible inputs. These are dif-
13. 2.8 Brake Roughness 75
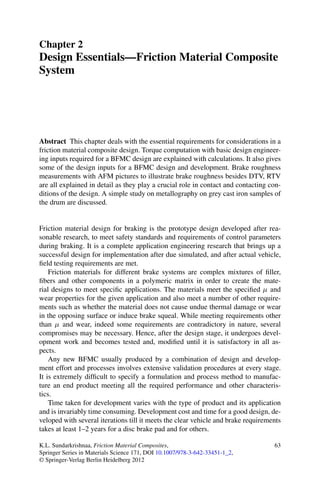
Fig. 2.1 AFM picture of the roughness of the surface in a disc pad sample
ficult to quantify repeatedly. Most customer complaints on brake roughness comes
from the drivers. From an experienced brake test driver roughness ratings are fairly
repeatable, and are needed for final vehicle ratings. Roughness of the surface as is
seen in AFM pictures (Figs. 2.1 to 2.5).
2.8.5 AFM—Brake Pad Roughness
Common methods of vehicle roughness instrumentation are strain-gauged drag
struts and torque wheels. Both permit instrumented readings of brake torque av-
erages and torque variations. All brakes have some torque variations, but not all
torque variations are at wheel frequency and large enough to be detected as brake
roughness. Instrumentation of the drag struts appears to offer both advantages and
disadvantages, compared with the torque wheels.
Wheel torque are self-contained, not requiring application of the instrumentation
directly to each test vehicle. However, they may provide a different wheel offset,
mass, and stiffness than the OE vehicle has. They also may affect brake cooling
rates and temperature distribution. This may affect the brake roughness amplitude
and occurrence conditions. When several test vehicles of the same make and model
are to be evaluated, wheel torques can be quite acceptable. If a number of samples
for a particular vehicle is to be evaluated, for example to obtain an initial quality
rating, the use of wheel torque can be quite effective and efficient. It should be
14. 76 2 Design Essentials—Friction Material Composite System
Fig. 2.2 AFM picture of the roughness of the surface in a disc pad sample—friction material
portion of contact
Fig. 2.3 AFM picture of the roughness of the surface in a disc pad sample—friction material
portion of contact
15. 2.8 Brake Roughness 77
Fig. 2.4 AFM picture of the roughness of the surface in a disc pad sample—friction material
portion of contact
Fig. 2.5 AFM picture of the roughness of the surface in a disc pad sample—friction material of
contact
16. 78 2 Design Essentials—Friction Material Composite System
remembered that torque variations do not necessarily correspond with the brake
force output variations, such as seen by the drag strut, so torque data alone may not
correlate well with driver ratings.
Drag Strut Measurements: Strut instrumentation is particularly useful to char-
acterize individual vehicles for roughness sensitivity. For example, a known set of
rotor/pad sets can be evaluated on a particular vehicle to establish that vehicle’s
suspension sensitivity to roughness. It is known that soft suspensions and soft strut
bushings make vehicles more sensitive to brake roughness inputs. An instrumented
test run with the same sets of brake rotors and linings on three vehicles each with a
different suspension and/or strut bushing stiffness. The measured torque variations
were over three to four times greater on the vehicle with soft strut and suspen-
sion bushings. It appears that strut bushing instrumentation is better for developing
and tuning suspensions to minimize vehicles response to brake roughness inputs.
Strut bushing test data (e.g., absolute amplitude or ratio of force variation to aver-
age force) has provided a good correlation to experienced test drivers’ roughness
ratings.
Instrumented vehicle struts generally provide better vehicle roughness response
data than instrumented wheel torque.
2.8.6 Roughness Measurements in a Dynamometer
Most brake dynamometers have strain gauge torque sensors that can provide the
needed brake torque average and variation numbers. However, a brake dynamometer
does not have the same brake mounting compliance as on a vehicle, and is connected
to the drive motor and load inertia by means of a drive shaft and couplings not as is
in a wheel and tire. In its basic form, a brake dynamometer can provide useful data
on brake roughness. The ratio of peak-peak torque amplitude to average torque pro-
vides a measure of the brake roughness input. A brake dynamometer can measure
differences in this torque ratio for different test temperatures, different brake apply
pressures, and at different times during a simulated brake application. Brake rough-
ness output, the observed vehicle response, varies substantially with this input. Both
brake roughness input and output measurements are needed to determine the best
approach to reduce brake roughness in the vehicle.
Dynamometers normally do not provide information on how brake torque varia-
tions may interact with such things as suspension geometry and component compli-
ance (Fig. 2.6). Few brake dynamometers have the capability to include an entire ve-
hicle corner-complete brake assembly, suspension, and structural components. Very
few brake dynamometers absorb torque through tire/wheel assemblies. However, al-
most any brake dynamometer can roughly simulate brake roughness deflections by
the addition of a spring element (even an actual strut bushing) to the brake tail stock
reaction arm.
This spring should be installed in series with the brake torque load cell. The
spring allows a test brake on a dynamometer to have nearly the same vibrational
17. 2.8 Brake Roughness 79
frequency as the wheel/tire/brake assembly on a vehicle. It is not known if dyno
windup springs improve the correlation of roughness data from brake dynamome-
ters to vehicle drivers. The important consideration is that the brake dynamometer
readily provides brake roughness input data, and can be modified to provide some
simulated output data.
Vehicle roughness response characteristics, for the same brake input, may be
quite different from one vehicle to another. It may be preferable to measure vehicle
suspension response versus frequency behavior using shakers at both front wheels to
simulate brake torque variations. This needs be done for each vehicle platform. Such
data then can provide brake roughness torque variation bounds to achieve different
roughness ratings. Shows the drag strut response signal on three different vehicle
platforms with the same brake, under the same testing conditions. Most, but not
all, of these differences were attributed to the strut bushing stiffness differences.
Note the clear differences of signal amplitude and frequency that occurred before
the brake was applied.
DBR Disc Brake Roughness—Causes
Brake roughness is excited by excessive brake torque variations. These may result
from one or more of several brake-related sources, most of which are first order.
By first order, this means that a significant event occurs only once per wheel
revolution. Examples are:
1. Rotor thickness variations, RTV,
2. First order brake Pad-rotor surface frictional variations,
3. First order brake clamping force variations.
Brake torque variations have their roots in brake design, materials, manufactur-
ing, and usage history. However, there is more to brake roughness than simply the
excitation of the brake.
Vehicle Design Factors
The same brake hardware, installed in different vehicles, can provide large dif-
ferences in reported brake roughness. Even when tested by the same drivers, the
roughness ratings are clearly different for different suspensions and steering sys-
tems. As with most vibrations, the brake roughness response is a function both of
the brake excitation and of the vehicle system response to that excitation. Since the
vehicle response to brake roughness inputs also is intimately tied to vehicle drive
and steering behavior, brake engineers usually have to be content to address brake
roughness problems primarily through brake system modifications. Such constraints
make roughness, fixes difficult to achieve on luxury vehicles with soft suspensions.
This report does not address vehicle suspension and steering design changes to re-
duce observable brake roughness. However, the non-brake contributions to reported
brake roughness problems should be recognized.
18. 80 2 Design Essentials—Friction Material Composite System
2.8.7 Brake Design Factors—Sliding Calipers
Most disc brakes today have sliding calipers, either pin or rail slider types, with
pistons that use their seals for retraction. With such a design, if the outboard brake
lining starts to drag against the rotor, its caliper readily moves over to reduce the
contact travel to a minimal value. This happens because the stiffness of the caliper
assembly is high and its sliding force is low. On the other hand, if the inboard brake
lining drags against the rotor, the caliper piston (suspended by the rubber seal) has a
low stiffness, so it can move readily. The predisposes sliding caliper brakes toward
dragging of their inboard linings. This is further biased by the normal displacement
of the rotor, during cooling, toward the inboard lining. The bottom line is that sliding
caliper disc brake designs have an inherent tendency toward dragging of the inboard
lining.
The caliper piston travel, using its seal for a spring, may be 0.0020 to 0.003 for
a dragging brake with rotor runout. The rotor contact, as might be expected, is along
the runout ramp before, and after the point of maximum runout. Measurements tend
to show brake dragging contact from about 60 to 80 degrees before maximum runout
to about 10 to 60 degrees after maximum runout on the inboard rotor face. When the
rotor has a high runout, the worn zone usually stays within 0.0015 of the maximum.
This makes the worn zone narrower, with a resultant sharper brake torque pulse from
the RTV.
Brake lining drag wear is typically only on the inboard side of the rotor for most
pin and rail slider caliper designs. When outboard wear is found, it normally is only
a fraction of that found on the inboard side, and 180 degrees offset in location. Road
crowns tend to provide a greater contamination to the right side brake assembly in
vehicles with right hand traffic. Typically we one would find more contamination-
based rotor wear to show up on the right side rotors.
Fixed Calipers
Fixed calipers can and do get RTV wear on both sides of the rotor. If the brake
linings are abrasive, the outboard wear can be about the same as that of the inboard.
Fixed calipers are less common than sliding calipers. They tend to be used with
rotors that have less runout, less tendency toward distortion, and are likely to have
suspension systems that are insensitive to brake roughness. There is not a great deal
of data available on fixed caliper disc brake roughness. Old data, from early Lincoln
and Thunderbird fixed caliper disc brakes, indicated their roughness was more noted
when very hard brake lining were used, and when the vehicles were driven in regions
where abrasive road dust was prevalent.
2.8.8 Thickness Variation due to Manufacturing Reasons
Since disc brake roughness is directly related to brake torque variations, it is logical
that variations in the thickness of a rotor, called thickness variation or RTV, would
19. 2.8 Brake Roughness 81
be important. Most caliper disc brakes have a very limited tolerance for RTV before
the brake roughness becomes unacceptable. For this reason, disc brake rotors are
generally machined on both rubbing faces at the same time. This may involve a
straddle cutting on a lathe, or a grinding operation that machines both faces on the
same setup. Since cutting tools and grinders have some compliance, it is important
that the roughing operations provide a minimal level of RTV as well.
Runout
Disc brake rotors have some runouts without exception. It is not possible to elimi-
nate all runout, since this involves bearing machining, bearing seats, bearings, ma-
chine setups, and so forth. A small amount of runout generally will not induce a
detectable brake roughness, at least initially. Large amounts of disc runout require
the caliper and brake pad assemblies to move laterally with the runout, or the brake
clamping forces will vary with angular position. If it does, the brake may develop
roughness immediately due to the brake force variations. It also may develop brake
roughness during a prolonged low-pedal-force brake application, for example dur-
ing a slowing for a freeway exit or a downgrade. During such braking, the rotor
will become heated unevenly as a result of the uneven clamping forces. This uneven
heating of the rotor can increase the rotor runout and provide a significant increase
of rotor thickness variation as well.
Mass Imbalance
Rotors may have castings that provide uneven mass distributions with angular posi-
tion. These will respond to an even heating from brake application with an uneven
change of thickness. This thermally induced TV tends to be self perpetuating, once
initiated.
Ideally, the rotor contact faces should not vary in thickness with angular position.
Residual Stress
Some RTV change after machining is possible if the gray iron casting is not stable.
Initial heating of the rotor has been reported to produce permanent changes of most
dimensions, with runout changes being larger than those for RTV.
Surface Texture
Uneven or irregular surface texture is not often a source for disc brake roughness.
However, the initial roughness rating for new vehicles has been found to be sensi-
tive to grinder alignment and bearing effects, when they produce an uneven surface
20. 82 2 Design Essentials—Friction Material Composite System
texture on the rotor. Lathe turning is not known to produce uneven surface texture,
but poor casting, with porosity, hardness, inclusion, free ferrite variations can result
in finished rotor rubbing surfaces that vary with angular position.
Coatings on the Surfaces
Rotors at times are given a surface treatment, for example to provide rust protec-
tion. It is important to be aware that any coating that affects the friction level, or is
depleted through wear, be thoroughly tested for its effect on brake roughness and
validated. While such coatings may only temporarily affect brake roughness, any
detectable adverse effect can elicit a strong negative first impression by the cus-
tomer.
Reasons—Usage Related
Brake Parasitic Drag Wear When a disc brake is released, the piston seal roll-
back retracts the piston several thousandths of an inch. This small retraction is
needed to minimize brake pedal travel for initial lining contact. However, the small
seal roll-back may result in some local brake pad contact when the brake is released.
This is called parasitic drag. Normally this drag is small, about the same as wheel
bearing or seal drag. However, it can have serious brake roughness consequences
under certain circumstances.
2.8.9 Abrasive Brake Pads
Some brake linings contain abrasives as a part of their composition. For example,
many semi-met friction materials contain fused magnesium oxide of a particle size
that can be abrasive to the rotor. Abrasive materials also may occur as unwanted,
‘tramp’ constituents in brake linings/pads. Silicon carbide is a well known abrasive
material that may be found in synthetic graphite. Accumulated surface materials,
such as road dust or rotor rust particulate may collect on the brake lining rubbing
surfaces. Some abrasive material is possible in and on a brake lining surface. The
harder the brake lining matrix, the smaller the abrasive particles need be to wear the
rotor. For this reason ‘soft’ brake linings and warm brake pad tend to wear the rotors
much less aggressively.
When the brake is nominally released, but with some parasitic drag, the brake
pad surface periodically contacts a portion of the rotor surface. If the brake pad
surface that contacts the rotor is abrasive, even this light contact may result in a
local rotor surface wear. Such wear results in usage TV. This wear is generally on
the inboard face of the rotor. The reason for this is that most disc brake calipers
21. 2.8 Brake Roughness 83
have their pistons on the inboard side, with a sliding mechanism of the caliper for
the outboard shoe loading.
If abrasive contamination comes from road dust, the outboard rotor wear can
be much less, especially for vehicles with closed disc wheels or with closed wheel
covers, These minimize abrasive particulate entry to the brake. If spoked wheels
with large opening are used, both rotor faces may wear about the same from road-
borne abrasive contamination (see Fig. 2.7), which will lead to disc scoring. Road
crowns tend to provide a greater contamination to the right side brake assembly
where there is right hand driving. Consequently, the typical situation is for more
contamination-based rotor wear to show up on the right side rotors.
Runout Induced RTV
RTV change of 0.0015 as measured are common on a large passenger car rotor dur-
ing a slow brake application from 100 to 60 kmph. The initial thickness variation
normally could be under 0.0001 on the rotor, such an instance cannot be attributed
to braking roughness. It is important to remember that a caliper disc brake is always
unstable in terms of thickness variation. The first and second order components of
the rotor runout result in some variation of brake lining contact pressure when some
thermally-induced thickness variation starts. Any RTV will tend to increase with
time during a prolonged light brake application. Some brake linings are more likely
to generate regional hot spots, and associated brake roughness. Soft (in compres-
sion) brake linings are better than rigid materials, as they tolerate the runout with
less frictional force variation. Lighter weight calipers and free moving calipers sim-
ilarly reduce the vehicle sensitivity. On some of the brakes, an increase of hydraulic
brake line size also reduce the runout induced TV. It could lead to softening of the
caliper piston with the larger hydraulic line, reducing the brake lining drag force
variation with runout.
Understanding of brake roughness In the case of steering wheel response,
thickness variation phasing controls the magnitude of the steering wheel response.
From highway to light steady braking steering wheel oscillation becomes worse due
to roughness.
Fixing one side will stop all steering wheel oscillation, but brake pedal pulsation
will continue. Normally Drivers complaint when both rotors have excessive thick-
ness variation as it causes steering input. This phasing effect caused the roughness
to vary substantially, even if the test conditions are repeated. Composite stamped ro-
tors give poor runout than the cast rotor. With cold brakes especially in highway type
usage will result in increased roughness. Abrasive content will cause increased face
wear which is seen in semimetallic formulations. Highway usage-induced rough-
ness does not occur when drivers use brakes enough to keep the linings, pads above
their glass transition temperature of 84 °C. Varying suspensions and strut bushings
will vary the disc brake behavior.
22. 84 2 Design Essentials—Friction Material Composite System
Fig. 2.6 Vented rotor disc
with caliper mounting with an
adaptor in a typical
dynamometer test setup
Fig. 2.7 Scored vented disc
after undergoing several
cycles of thermal history
The drag strut bushing spring rate was the greatest single variable that affects
roughness. Initial rotor thickness variation will be over seven times greater in ef-
fect than initial rotor runout. However, runout was the greatest root source for high
mileage thickness variation increase and high mileage driver complaints of rough-
ness. Uneven coating on a new vehicle wherein the rotor roughness is seen until it
is wiped off during repeated braking.
Issues of disc rotor in contact with the friction material surface are more related
to compressibility of the product mix formulation in question.
23. 2.8 Brake Roughness 85
2.8.10 Metallographic Studies on Grey Cast Iron Samples of
the Drum
Metallographic studies such as macroscopic examination, microstructural analysis
and hardness testing could reveal if there is any abnormality in the drum liner contact
which is very critical as a mating part. Both scored and unscored drum samples
could be taken for studies of metallography.
Macroscopic examination of the grey cast iron with and without scores could
be observed visually. Both the surfaces with and without scoring samples could be
metallographically polished. Micrographs could be taken on samples with etched
and unetched conditions [78]. At different points over the surface it could be stud-
ied. Some locations may reveal graphitic flakes of type E having interdendritic [51]
segregation with preferred orientation in a scored drum. Repetition of other loca-
tions of similar patterns are sometimes seen. In an unscored sample locations may
show tendency for growth of graphite flakes of a particular type. Normally size of
the graphite flakes will correspond to ASTM designation A 247 Plate I.
Etched scored sample will show pearlitic with a few grains of ferrite and some-
times steadite could be noticed. In an unscored sample microstructure reveal a re-
solved pearlite matrix and white etching steadite. Different locations can reveal size
variation of steadite grains.
Vickers hardness testing with 5 kg load may reveal some informations on the
locations where metallographic studies are carried out. There will be variation of
hardness on both scored and unscored samples tested at different locations.
Graphite flake size and distribution depends more on cooling rate and the thick-
ness of the casting. The chemical composition of the cast iron also will influence
the nature of graphite. Sometimes across the section the cooling rates will not be
uniform [90]. Higher content of steadite indicates higher phosphorous content in
the sample.