Building Business Service Intelligence with ITSI
•
3 gostaram•1,137 visualizações

Building Business Service Intelligence with ITSI

Recomendados
Recomendados
Mais conteúdo relacionado
Mais procurados
Mais procurados (20)
Destaque
Destaque (20)
Semelhante a Building Business Service Intelligence with ITSI
Semelhante a Building Business Service Intelligence with ITSI (20)
Mais de Splunk
Mais de Splunk (20)
Último
Último (20)
Building Business Service Intelligence with ITSI
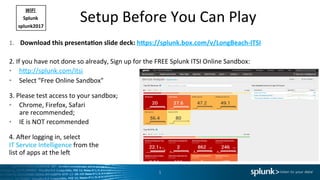
- 1. Setup Before You Can Play 1. Download this presenta2on slide deck: h6ps://splunk.box.com/v/LongBeach-ITSI 2. If you have not done so already, Sign up for the FREE Splunk ITSI Online Sandbox: • hEp://splunk.com/itsi • Select "Free Online Sandbox" 3. Please test access to your sandbox; • Chrome, Firefox, Safari are recommended; • IE is NOT recommended 4. AOer logging in, select IT Service Intelligence from the list of apps at the leO 1 WiFi Splunk splunk2017
- 3. Agenda 3 u IntroducUons and Set Up u Splundamentals – IT TroubleshooUng with Splunk u What is IT Service Intelligence? u Service Intelligence Design PracUces u Let's Play! u What's Next? u Happy Hour!
- 4. Safe Harbor Statement During the course of this presentaUon, we may make forward looking statements regarding future events or the expected performance of the company. We cauUon you that such statements reflect our current expectaUons and esUmates based on factors currently known to us and that actual events or results could differ materially. For important factors that may cause actual results to differ from those contained in our forward-looking statements, please review our filings with the SEC. The forward-looking statements made in this presentaUon are being made as of the Ume and date of its live presentaUon. If reviewed aOer its live presentaUon, this presentaUon may not contain current or accurate informaUon. We do not assume any obligaUon to update any forward looking statements we may make. In addiUon, any informaUon about our roadmap outlines our general product direcUon and is subject to change at any Ume without noUce. It is for informaUonal purposes only and shall not be incorporated into any contract or other commitment. Splunk undertakes no obligaUon either to develop the features or funcUonality described or to include any such feature or funcUonality in a future release. 4
- 7. Challenging Traditional Methods Network Infrastructure Layer Storage Server 74% -36% ApplicaUon Layer SyntheUc APM Byte Code InstrumentaUon AdapUve Thresholding Service Model definiUon & CorrelaUon Engine Business Layer Aggregation/Correlation/Visualization Service Layer Challenges • Too many disparate components • Difficult to define Service Model • Labor intensive • Most implementaUons fail • Very important source is missing! (machine data)
- 8. Data-Defined & Driven Service Insights Infrastructure Layer ApplicaUon Layer Splunk> is the missing link • Data Fidelity • Single Repository for ALL data • Easier to Manage Services • Reduced IntegraUons • Reduced Point SoluUons • CollaboraUve Approach • Quick Ume to value Data Fabric Platform Service Intelligence Network Packet, Payload, Traffic, UUlizaUon, Perf SyntheUc APM Availability, Capacity, User Experience Byte Code InstrumentaUon Usage, Experience, Performance, Quality AdapUve Thresholding Apps, Services, Systems 74% -36% Server Performance, Usage, Dependency Storage UUlizaUon, Capacity, Performance MACHINE DATA
- 9. Splunk Approach to Machine Data 9 Structured RDBMS SQL Schema on Write Tradi2onal ETL Search Schema on Read Splunk Universal Indexing Volume Velocity Variety Unstructured • Define StaUc schema • ETL into Schema • Enrich at write • New data = new columns • New quesUons = new columns • “Data at rest” (delayed info) • Labor Intensive & Ume consuming Ideal for Repor*ng • “Schema-on-the-Fly” • Data in naUve format • Enrich at read • New data = no changes needed • New quesUons = no changes needed • “Data in moUon” (Real Ume) • Fast Ume to value Ideal for Inves*ga*on
- 13. IT Service Intelligence Value Stack § Time Series Index § Schema on Read § Data Model Core Splunk > § Visualizes en2re stack § View the en2re Ecosystem § 3 clicks to get the answer versus 10 Service Model § Adap2ve Threshold § Behavior Anomaly § Correlates Data into Knowledge ML Search Based KPI’s § Accelerators § Trend aggrega2on § Mul2 KPI Alerts ITSI
- 30. Service Intelligence Design – BuEercup Games Infrastructure Layer Application Layer Business Layer Service Layer Order Entry Manufacturing Shipping Fulfillment Supply Chain Online Store EDI Web Tier Middleware • Total Orders • Total Revenue • Unit Count • Unit Failures • Service Level • Delivery Time • Online Orders • Online Revenue • Response Time • ServiceHealth • Incidents/Changes • Customer Sa2sfac2on • HTTP Hits • Error Rate • CPU Load • Memory Used • Disk Used • IO Latency • CPU Load • Memory Used • Disk Used • IO Latency • Response Time • Error Rate • Response Time • Storage Free
- 31. Service Intelligence Design in ITSI 1. High-value business services • BuEercup Games Online Store and Supply Chain 2. Major business funcUons • Order Entry, Manufacturing, Shipping Fulfillment 3. SupporUng services • Web, Middleware, Database 4. Relevant KPIs for each service • Database:, errors, SQL hits, …) 5. Splunk search for each KPI • (index=DB (warn* OR error*) | stats count) 31
- 32. Typical Data Sources Infrastructure Layer Application Layer Business Layer Service Layer Order Entry Manufacturing Shipping Fulfillment Supply Chain Online Store EDI Web Tier Middleware • Applica2on Logs • Corporate Databases • Service Management • Applica2on Logs • Webserver Logs • DB Perf Counters • Wire data • Perf Counters • Access Logs • Network Logs
- 39. New Requirements! 39 ● Create a new KPI for the DB Service: ● Network UUlizaUon ● Modify the ExecuUve Glass Table in order to show off the services you slave over “WE only have about 15min TO DO WHAT ???!!???” Think about how long this would take you today?
- 41. Let’s Talk EnUUes 41 ● Select Database Service ● EnUUes are the relevant things which support this service (usually hosts) ● Select the right entries with filters, ANDs, ORs ● Original EnUty list can come from CMDB, spreadsheet, Splunk search, others
- 42. A KPI in 5 minutes? Absolutely! 42 Click New – Generic KPI Select Data Model ● Host Opera>ng System ● Network ● # bytes ● Next Call it “Network U*liza*on”, with your username up front
- 44. Almost There… 44 Select ● KPI Search Schedule: Every Minute ● En*ty Calcula*on: Average ● Service/Agg Calcula*on: Average ● Calcula*on Window: Last Minute ● Click Next ● Unit: Bps ● Click Next
- 45. Final Steps … 45 Set your thresholds: ● Aggregate (All) ● Per En*ty ● Click “Add Threshold” TWICE ● Make the Neapolitan ice cream colors Yellow, Green, Yellow ● Drag the sliders around in order to get the current data graph enUrely inside the Green (normal) band ● Click Finish ● Other opUons are also available, including adapUve thresholds and anomaly detecUon
- 48. 48 AdapUve Thresholds AdapUve Thresholding works beauUfully with cyclical (and other dynamic) data
- 49. Anomaly DetecUon 49 ● Machine Learning ● “Trending” detects deviaUons for aggregate KPI based on historical trends ● “EnUty Cohesion” detects enUUes which deviate from “pack” behavior
- 51. Clone the Glass Table 51 Return to Saved Glass Tables page (click on Glass Tables in the upper menu bar) CLICK Edit for “BuEercup Games Business Process (IN PROGRESS)” • Select Clone • Title: Add your username to the front • Permissions: Shared in App • Click Clone Page • Click on your new Glass Table from the list, to view it
- 52. Edit & Have Fun! 52 Click on Edit in the upper right corner of your Glass Table Use the “Services” panel on the leO to select Individual KPIs, or Aggregate Service Health Scores • Choose 2 KPIs from Online Store that would be useful in the “Order Process” secUon • Drag the selected widgets onto the canvas, posiUoning in the gray oval • What’s the difference between the and tools at the top leO?
- 53. More Fun with the Glass Table Editor… 53 Use the Configura*ons panel on the right to edit a selected widget • Can change the visualizaUon type, drilldown behavior, and other se{ngs • You should hit Save frequently • Revert All Changes can be helpful, occasionally
- 54. Finishing up … 54 • Add a ServiceHealthScore widget for Online Store under BuEercup • Choose a Viz Type with a sparkline graph, then resize to make it look preEy • Modify the Custom Drilldown acUon to go to the saved glass table, BuVercup Games Online Store • Bonus Points: Make the label bigger, more readable • Click Save • View when done
- 56. A TroubleshooUng Exercise 56 Let’s use ITSI to troubleshoot an outage ● Start at your Glass Table, “<UserName> BuEercup Business Process” ● Customer Care reports that unhappy customers are complaining of failures and long delays when trying to purchase ● The calls began coming in at around the top of the last hour. ● In the upper right corner of the Glass Table, change the Ume picker from Now to XX:00:00.0, where XX is the previous hour. For example, if it is currently 14:05, set the Ume picker to 13:00:00.0, then Apply ● This is how we can “Ume travel” back to see condiUons at a parUcular outage– oh yeah!
- 58. A TroubleshooUng Exercise, cont’d. 58 ● The Online Store Glass Table shows a much more detailed view, including the impacted customer-facing KPIs at the far leO (Revenue, etc) ● Based on this view of all the relevant services, where do you think the root cause lies? ● Which service should we troubleshoot first? ● Click on Health widget for that service, to drill down to a Deep Dive
- 59. Deep Dive 59 ● Deep Dive shows mulUple KPIs and Health Scores in parallel “swim lanes”. ● The Health Score for this Service is the top swim lane. Can you see when it begins to degrade from 100%? ● Mousing over this point in Ume, can you spot the KPI with the leading fault indicaUon, i.e., what failed first? ● To improve readability, make sure the Primary Time Range (upper right corner) is set to Rela2ve> Earliest: 2 Hours Ago
- 60. MulU-KPI Alerts and Notable Events 60 ● Click on Notable Events Review ● MulUple KPIs and Healthscores can be combined in sophisUcated ways to create MulU-KPI alerts ● When a MulU-KPI alert fires, one of the outcomes is the creaUon of a Notable Event ● Notable Events allow NOC personnel and others to triage and coordinate event management efforts
- 61. Service Analyzer 61 ● Click on Service Analyzer > Default Service Analyzer ● Back where we started! ● This view shows a “no-frills” list of services (top) and hoEest KPIs (boEom) ● Provides access into Service Details ● It is useful for NOCs and others who need a high-level situaUonal view
- 63. Summary 63 ● High-value services can be decomposed and modeled in ITSI, using machine data from the relevant systems ● Services and KPIs can be created in minutes, with sophisUcated thresholding techniques to disUnguish “normal” from “not normal” ● Glass Tables allow service health and KPI metrics to be displayed in a way that makes sense to specific groups, such as ExecuUve Leadership, Business Service Owners, the NOC, DevOps & Others ● Deep Dives allow KPIs to be compared side-by-side across any Ume range, acceleraUng root cause analysis and significantly reducing MTTR ● Mul2-KPI Alerts and Notable Events reduce alert noise, producing acUonable events and a means to manage them ● … and it’s fast+fun to build!
- 67. Call Center Service Service Health Transactions ACD Analysis – Core Splunk Call Wait History Inbound Analysis Social Media Online Msg Social Media Mail Support VOIP Service Inbound Calls
- 68. Online Transactions Internal Transfer Service External Wire Service Money Exchange Service Money Transfer Services Service Health Corporate Reconciliation Service Fed Exchange Service Core Splunk Searches Transaction History System Investigation Heat Map Analysis
- 69. CIO Scorecard Enterprise Service Status Major Incidents Service Health Continuous Operational Visibility Volume Revenue Incidents Changes Major Changes Service Health Volume Revenue Incidents Changes Service Health Volume Ontime Delivery Incidents Changes Service Health Volume Revenue Incidents Changes Service Health Volume Revenue Incidents Changes Container Util Service Health Throughput Incidents Changes
- 70. The Vision - Business OperaUons Center • Splunk ITSI has the fundamentals to deliver on the promise of real Ume business visualizaUons • Modeled aOer your Security, Network, and IT OperaUons Centers • Monitoring and diagnosis of important ecommerce and brick and mortar operaUons • Enhanced with process insight from end-to-end, alerts, machine learning and real-Ume response NOC SOC BOC
- 71. Sign Up Now – We’re here to help! Harness the creativity and domain knowledge of your organization to unlock the value of data and solve an important Business Service problem through a joint service intelligence workshop with key stakeholders Define methods for: › Proactive service monitoring › Reduced risk and failures › Faster issue resolution › Increased business performance What is it? › 1 Day Onsite Workshop › Tightly linked with value › Collaborative approach › Build your own Glass Table
- 74. Reference Stuff 74 ● ITSI Sandbox Guide: (An app on your ITSI instance) ● ITSI DocumentaUon: hEp://docs.splunk.com/DocumentaUon/ITSI