Open Position And New Roles Recruitment Dashboard
•
0 gostou•1,108 visualizações

Presenting this set of slides with name - Open Position And New Roles Recruitment Dashboard. This is a three stage process. The stages in this process are Staffing Plan, Recruitment, Staff Management. https://bit.ly/3Ac8ZUl

Recomendados
Recomendados
Mais conteúdo relacionado
Mais procurados
Mais procurados (20)
Semelhante a Open Position And New Roles Recruitment Dashboard
Semelhante a Open Position And New Roles Recruitment Dashboard (20)
Mais de SlideTeam
Mais de SlideTeam (20)
Último
Último (20)
Open Position And New Roles Recruitment Dashboard
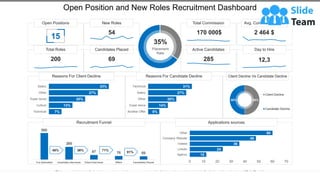
- 1. Reasons For Client Decline Reasons For Candidate Decline Client Decline Vs Candidate Decline Recruitment Funnel Applications sources Open Position and New Roles Recruitment Dashboard This graph/chart is linked to excel, and changes automatically based on data. Just left click on it and select “Edit Data”. Total Roles Candidates Placed 15 54 Open Positions New Roles 69 200 Total Commission Avg. Commission Rate Active Candidates Day to Hire 170 000$ 2 464 $ 285 12,3 50% 50% Client Decline Candidate Decline 7% 13% 20% 27% 33% Technical Culture Exper Ience Other Salary 8% 14% 20% 27% 31% Another Offer Exper Ience Other Salary Technical 560 269 97 76 69 Cvs Submitted Candidate Interviews Client Interviews Offers Candidates Piaced 48% 36% 71% 91% 12 24 36 48 60 0 10 20 30 40 50 60 70 Agency Linkdin Indeed Company Website Other 35% Placement Rate
- 2. Instructions To Edit This Slide This slide has been made in PowerPoint using basic PowerPoint shapes, and all graphics are 100% editable in PowerPoint. You can change color, size and orientation of any element to your liking, and add/edit any piece of text anywhere.
- 3. All images are 100% editable in PowerPoint Change color, size and orientation of any icon to your liking”
- 4. 1. Select the Graph and right click -> Select "Edit Data" 2. An excel matrix will automatically show up 3. Enter the values based on your requirements and hit enter 4. The Graph/Chart shape will automatically adjust according to your data, and anytime you can go and change the value again Edit Excel-linked Chart This is a Data Driven Chart/Graph and the shape automatically adjusts according to your data 1 2 3
- 5. Edit Color 1. Select the shape to change the color and Right click the object( click any object which you want to change color) 2. Choose Format Data Series in the dialog box. 3. Choose “Fill” in the Format Shape box then “Solid” or “Gradient” depending on the appearance of the object. Change colour as shown in the picture. 1 2 3
- 6. Select From Thousands Of Editable Icons On Every Topic These icons are available at the Icons section on www.slideteam.net