Smart City Expo: Making cities work
•
2 gostaram•1,019 visualizações

Ponencia de Francisco Rincón en el Smart City Congress sobre todos los retos y soluciones de las ciudades del futuro, sus mega-tendencias y el Green City Index.

Recomendados
Recomendados
Mais conteúdo relacionado
Mais procurados
Mais procurados (19)
Semelhante a Smart City Expo: Making cities work
Semelhante a Smart City Expo: Making cities work (20)
Mais de Siemens España
Mais de Siemens España (19)
Último
Último (20)
Smart City Expo: Making cities work
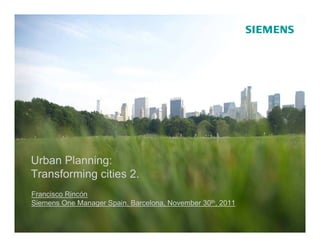
- 1. Urban Planning: Transforming cities 2. Francisco Rincón Siemens One Manager Spain. Barcelona, November 30th, 2011 © Siemens AG 2011. All rights reserved.
- 2. Megatrends imply significant challenges for city designers, decision makers and citizens Megatrends Sustainable Urban Development Globalization & Urbanization Cities are competing globally Global players / trade volume increase to make their urban areas 2030: 60% of population in cities attractive to live and to invest in High density living demands for new patterns in infrastructure Compe- titiveness Demographic Change 65+ generation will nearly double Gover- by 2030 (from 7% to 12%) nance Environ- Quality Need for adequate infrastructures ment of Life as well as health- and elder care Challenge to balance between Climate Change competitiveness, environment and Cities responsible for ~80% GHG quality of life, and to finance Need for resource efficiency infrastructure solutions and environmental care Achieve committed CO2 targets What is feasible in terms of proven technology, and for what cost and RoI? © Siemens AG 2011. All rights reserved. Seite 2 November 2011 - Barcelona . .
- 3. Siemens insights into "how to become sustainable", jointly developed with major world cities Megacity Challenges Comprehensive analysis based on interviews with over 500 city managers in 25 selected megacities Perception Urban infrastructure trends and challenges as well studies as global best practices Commissioned research to GlobScan and MRCMH Other studies: The Sustainable Cities Challenge in Canada, ICT for City Management Green City Index (commissioned research to EIU) Index compares cities across 8 dimensions of Comparative sustainability: CO2, Energy, Buildings, Transport, studies Waste & Land Use, Water, Air, Governance Europe, Africa, North / South America, Asia, Germany Deep-Dives in infrastructure, e.g. Complete Mobility Index Sustainable urban infrastructure series Implemen- "How to become a sustainable city" with focus on tation measures for resource efficiency and CO2 abatement studies Examples: Dublin, London, Munich, Yekaterinburg, Trondheim, ... © Siemens AG 2011. All rights reserved. Seite 3 November 2011 - Barcelona . .
- 4. Comparative Studies: European Green City Index1) 16 quantitative and 14 qualitative indicators in 8 categories were assessed Green action plan CO2 intensity Green management CO2 emissions Public participation in green policy Green CO2 reduction strategy Nitrogen dioxide gover- CO2 Energy consumption Sulphur dioxide nance Energy intensity Ozone Renewable energy consumption Particulate matter Air Energy Clean and efficient energy policies Air quality policies EGCI Water consumption Energy consumption of Water leakages Buil- residential buildings Water Waste water treatment dings Energy efficient buildings standards Water efficiency Energy efficient buildings initiatives and treatment policies Waste & Trans- land use port Municipal waste production Use of non-car transport Waste reduction policies Size of non-car transport network Green land use policies Green transport promotion Congestion reduction policies Set priorities of measures through identification of categories with performance below average 1) A research project conducted by the Economist Intelligence Unit, sponsored by Siemens © Siemens AG 2011. All rights reserved. Seite 4 November 2011 - Barcelona . .
- 5. Green City Index helps to identify categories to focus on Overall CO2 Energy Buildings Transport City Score City Score City Score City Score City Score 1 Copenhagen 87,3 1 Oslo 9,6 1 Oslo 8,7 1 Berlin 9,4 1 Stockholm 8,8 2 Stockholm 86,7 2 Stockholm 9,0 2 Copenhagen 8,7 1 Stockholm 9,4 1 Amsterdam 8,4 3 Oslo 84,0 3 Zurich 8,5 3 Vienna 7,8 3 Oslo 9,2 3 Copenhagen 8,3 4 Vienna 83,3 4 Copenhagen 8,4 4 Stockholm 7,6 4 Copenhagen 9,2 4 Vienna 8,0 5 Amsterdam 83,0 5 Brussels 8,3 5 Amsterdam 7,1 5 Helsinki 9,1 5 Oslo 7,9 6 Zurich 82,3 6 Paris 7,8 6 Zurich 6,9 6 Amsterdam 9,0 6 Zurich 7,8 7 Helsinki 79,3 7 Rome 7,6 7 Rome 6,4 7 Paris 8,9 7 Brussels 7,5 8 Berlin 79,0 8 Vienna 7,5 8 Brussels 6,2 8 Vienna 8,6 8 Bratislava 7,2 9 Brussels 78,0 9 Madrid 7,5 9 Lisbon 5,8 9 Zurich 8,4 9 Helsinki 7,1 10 Paris 73,2 11 London 71,6 10 London 7,3 10 London 5,6 10 London 8,0 10 Budapest 6,6 12 Madrid 67,1 12 Brussels 7,1 10 Tallinn 6,6 13 Vilnius 62,8 14 Rome 62,6 Water Waste and Air quality Environmental 15 Riga 59,6 land use Governance 16 Warsaw 59,0 17 Budapest 57,6 City Score City Score City Score City Score 18 Lisbon 57,3 1 Amsterdam 9,2 1 Amsterdam 9,0 1 Vilnius 9,4 1 Brussels 10,0 19 Ljubljana 56,4 2 Vienna 9,1 2 Zurich 8,8 2 Stockholm 9,4 1 Copenhagen 10,0 20 Bratislava 56,1 3 Berlin 9,1 3 Helsinki 8,7 3 Helsinki 8,8 1 Helsinki 10,0 21 Dublin 54,0 4 Brussels 9,1 4 Berlin 8,6 4 Dublin 8,6 1 Stockholm 10,0 22 Athens 53,1 5 Copenhagen 8,9 5 Vienna 8,6 5 Copenhagen 8,4 5 Oslo 9,7 23 Tallinn 53,0 5 Zurich 8,9 6 Oslo 8,2 6 Tallinn 8,3 6 Warsaw 9,7 24 Prague 49,8 7 Madrid 8,6 7 Copenhagen 8,1 7 Riga 8,3 7 Paris 9,4 25 Istanbul 45,2 8 London 8,6 8 Stockholm 8,0 8 Berlin 7,9 7 Vienna 9,4 26 Zagreb 42,4 9 Paris 8,6 9 Vilnius 7,3 9 Zurich 7,7 9 Berlin 9,3 27 Belgrade 40,0 10 Prague 8,4 10 Brussels 7,3 10 Vienna 7,6 10 Amsterdam 9,1 28 Bucharest 39,1 29 Sofia 36,9 16 Brussels 6,9 30 Kiev 32,3 Areas to start with improvements © Siemens AG 2011. All rights reserved. Seite 5 November 2011 - Barcelona . .
- 6. The Green City Index research series assesses more than 100 cities worldwide European Green City Index (Dec 2009, Copenhagen) German Green City Index (June 2011, tbc) US / Canada Green City Index (June 2011, Aspen) Asian Green Latin America City Index Green City Index (Feb 2011, Singapore) (Nov 2010. Mexico City) African Green City Index (Dec 2011, Durban) © Siemens AG 2011. All rights reserved. Seite 6 November 2011 - Barcelona . .
- 7. Our unique environmental portfolio makes Siemens the perfect partner for sustainable urban development www.siemens.com/urbanization © Siemens AG 2011. All rights reserved. Seite 7 November 2011 - Barcelona . .
- 8. Pioneering solutions: Siemens examples for energy efficiency in the city Existing technology achieves high gains in efficiency and CO2 abatement Renewables CO2-free energy Building Traffic management Wind turbines: to the city technologies system SIPLINK Efficiency up from Example HVDC: 30% less energy used Traffic speed: +37% 12 tons less CO2 emis- 1 MW to 6 MW China 800 kV, through building Commuter times cut sions per ship and day (gearless) 6.4 GW, 2,000 km energy management by 17% by local grid connection Efficient energy High-voltage urban production link Industry Complete Mobility Street lighting Combined Cycle: Efficient energy 40% less energy Higher attractiveness Potential in Europe: From 50% to 60% transport by HV close consumption with of public transport 3.5 million tons less Steam Power Plant: to the consumer variable-speed drives (reduced waiting and CO2 emissions with From 40% to 47% up to 20% fuel savings) LED systems © Siemens AG 2011. All rights reserved. Seite 8 November 2011 - Barcelona . .
- 9. Implementation Study: Pilot London1) Findings (time horizon: 2025) Results Average Two-third of all CO2- abating Abatement abatement cost / Additional potential Mt savings investment technologies pay back their Levers CO2 EUR/t CO2 bn EUR invest ~75% of the abatement potential Insulation 4.5 30 10.4 lies in the hands of individuals / 2.7 150 1.0 businesses who make Buildings Heating efficiency technological choices Lighting 1.4 120 0.9 The total investment required Appliances 1.3 190 0.8 constitutes less than 1% of London's total economic output Other 0.7 460 7.3 until 2025 Higher car efficiency 1.2 320 2.4 Conclusions Financial prioritization Transport Insulation Biofuels 0.5 140 - 0.3 1,700 5.3 Broad technology expertise Hybrid passenger cars across infrastructure areas is Hybrid bus 0.2 240 0.5 mandatory to identify suitable combinations of solutions > Other 0.9 230 4.3 roadmap Energy Energy mix 3.7 40 1.1 Sustainability makes city 2.1 90 4.0 decision makers to think and act CHP as one 1) Siemens Sustainable Urban Infrastructure – London Study, a research project conducted by the McKinsey, sponsored by Siemens © Siemens AG 2011. All rights reserved. Seite 9 November 2011 - Barcelona . .
- 10. Further examples on implementation studies executed by Siemens China: business district in Russia: Yekaterinburg a major city – CO2 abatement Energy Efficiency2) potential 2020 CO2 abatement potential of 46% 44% with "most common" technology Gross Floor Area >10mn m2, ROI: 3-4 yrs 79% with "best" available technology Intelligent building automation (14%) Top 12 technological levers: Lighting automation (7%) Cover all infrastructures in the City Energy saving lamps (6%) Account for 51% of top-down potential New Building KPI system (kwh/m²/a) Save 1bn m3 of gas or 2 days of Russian gas export (2008) "Siemens is the best among low-carbon experts"1) European City: Energy Efficiency, Italy: Airport CO2/NO2 abatement Energy Efficiency Top 9 technological levers: 68% less energy cost potential via 512t CO2/2,9t NO2 abatement per year, e.g. Solar power Street lighting: 99 GWh > 67 GWh (-31%) Combined heat and power Harbor: -81% CO2 emissions Building insulation and automation Hybrid bus: -30% CO2 emissions, 1 mn liter less Lighting fuel consumption Savings: ~3mn€ per year RoI: 2-8 years 1) Customer comment 2) Within the German-Russian governmental dialogue © Siemens AG 2011. All rights reserved. Seite 10 November 2011 - Barcelona . .
- 11. City Account Managers and Global Cities CoC* in London with hubs in the US and China Global CoC Cities CoC Cities CoC Cities Supported by a new Global CoC1) Cities London, and further CoC Cities in US and China focusing on: Urban development City account management development Solution and integration / international projects Marketing and communications 1) CoC: Center of Competence © Siemens AG 2011. All rights reserved. Seite 11 November 2011 - Barcelona . .
- 12. The Crystal at a glance Vision The Crystal is a global knowledge hub for urban sustainability and environmental technologies http://thecrystal.org/ © Siemens AG 2011. All rights reserved. Seite 12 November 2011 - Barcelona . .
- 13. The Crystal at a glance Combined “exhibition and conference facilities” with office space Audience includes “key decision-makers and general public” Dedicated Siemens hospitality activities during the 2012 Games Part of 2012 legacy, supporting local schools attracting green investment Key Figures Exhibition: 2000m2 Auditorium: 270 seats Office space: ca. 160 desks Expected visitors: 100,000+ per year © Siemens AG 2011. All rights reserved. Seite 13 November 2011 - Barcelona . .
- 14. Thank you! http://thecrystal.org/ © Siemens AG 2011. All rights reserved. Seite 14 November 2011 - Barcelona . .