BPAC WITH UFSBI GENERAL PRESENTATION 18_05_2017-1.pptx
Comparative and Common Size Balance Sheets Analysis 2017-2022
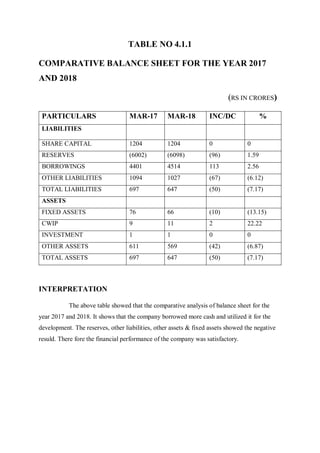
1. TABLE NO 4.1.1
COMPARATIVE BALANCE SHEET FOR THE YEAR 2017
AND 2018
(RS IN CRORES)
PARTICULARS MAR-17 MAR-18 INC/DC %
LIABILITIES
SHARE CAPITAL 1204 1204 0 0
RESERVES (6002) (6098) (96) 1.59
BORROWINGS 4401 4514 113 2.56
OTHER LIABILITIES 1094 1027 (67) (6.12)
TOTAL LIABILITIES 697 647 (50) (7.17)
ASSETS
FIXED ASSETS 76 66 (10) (13.15)
CWIP 9 11 2 22.22
INVESTMENT 1 1 0 0
OTHER ASSETS 611 569 (42) (6.87)
TOTAL ASSETS 697 647 (50) (7.17)
INTERPRETATION
The above table showed that the comparative analysis of balance sheet for the
year 2017 and 2018. It shows that the company borrowed more cash and utilized it for the
development. The reserves, other liabilities, other assets & fixed assets showed the negative
resuld. There fore the financial performance of the company was satisfactory.
2. TABLE NO 4.1.2
COMPARATIVE BALANCE SHEET FOR THE YEAR 2018
AND 2019
(RS IN CRORES)
PARTICULARS MAR-18 MAR-19 INC/DC %
LIABILITIES
SHARE CAPITAL 1204 356 (848) (70.43)
RESERVES (6098) (5107) 991 (16.25)
BORROWINGS 4514 4344 (170) (3.76)
OTHER LIABILITIES 1027 1155 128 12.46
TOTAL LIABILITIES 647 748 101 15.61
ASSETS
FIXED ASSETS 66 59 (7) (10.60)
CWIP 11 15 4 36.36
INVESTMENT 1 0 (1) (100)
OTHER ASSETS 569 673 104 18.27
TOTAL ASSETS 647 748 101 15.61
INTERPRETATION
The above table showed that the comparative analysis of balance sheet for the
year 2018 and 2019. It shows that the company have more other liabilities and utilized it for
the development. The share capital, borrowings, investments & fixed assets showed the
negative resuld. There fore the financial performance of the company was satisfactory.
3. TABLE NO 4.1.3
COMPARATIVE BALANCE SHEET FOR THE YEAR 2019
AND 2020
(RS IN CRORES)
PARTICULARS MAR-19 MAR-20 INC/DC %
LIABILITIES
SHARE CAPITAL 356 356 0 0
RESERVES (5107) (4959) 148 (2.89)
BORROWINGS 4344 4376 32 0.73
OTHER LIABILITIES 1155 976 (179) (15.49)
TOTAL LIABILITIES 748 748 0 0
ASSETS
FIXED ASSETS 59 66 7 11.86
CWIP 15 7 (8) (53.33)
INVESTMENT 0 0 0 0
OTHER ASSETS 673 675 2 0.29
TOTAL ASSETS 748 748 0 0
INTERPRETATION
The above table showed that the comparative analysis of balance sheet for the
year 2019 and 2020. It shows that the company have borrowings and utilized it for the
development. The CWIP & other liabilities showed the negative resuld. There fore the
financial performance of the company was satisfactory.
4. TABLE NO 4.1.4
COMPARATIVE BALANCE SHEET FOR THE YEAR 2020
AND 2021
(RS IN CRORES)
PARTICULARS MAR-20 MAR-21 INC/DC %
LIABILITIES
SHARE CAPITAL 356 356 0 0
RESERVES (4959) (5069) (110) 2.21
BORROWINGS 4376 4405 29 0.66
OTHER LIABILITIES 976 1009 33 3.38
TOTAL LIABILITIES 748 700 (48) (6.41)
ASSETS
FIXED ASSETS 66 60 (6) (9.09)
CWIP 7 6 (1) (14.28)
INVESTMENT 0 0 0 0
OTHER ASSETS 675 635 (40) (5.92)
TOTAL ASSETS 748 700 (48) (6.41)
INTERPRETATION
The above table showed that the comparative analysis of balance sheet for the
year 2020 and 2021. It shows that the company have borrowings, other liabilities and utilized
it for the development. The reserves, CWIP, other assets & fixed assets showed the negative
resuld. There fore the financial performance of the company was satisfactory.
5. TABLE NO 4.1.5
COMPARATIVE BALANCE SHEET FOR THE YEAR 2021
AND 2022
(RS IN CRORES)
PARTICULARS MAR-21 MAR-22 INC/DC %
LIABILITIES
SHARE CAPITAL 356 356 0 0
RESERVES (5069) (4536) 533 (10.51)
BORROWINGS 4405 3753 (652) (14.80)
OTHER LIABILITIES 1009 1087 78 7.73
TOTAL LIABILITIES 700 660 (40) (5.71)
ASSETS
FIXED ASSETS 60 53 (7) (11.66)
CWIP 6 7 1 16.66
INVESTMENT 0 0 0 0
OTHER ASSETS 635 560 (75) (11.81)
TOTAL ASSETS 700 660 (40) (5.71)
INTERPRETATION
The above table showed that the comparative analysis of balance sheet for the
year 2021 and 2022. It shows that the company have reserves, other liabilities and utilized it
for the development. The other assets, borrowings & fixed assets showed the negative resuld.
There fore the financial performance of the company was satisfactory.
6. TABLE NO 4.2.1
COMMON SIZE BALANCE SHEET FOR THE YEAR 2018
(RS in crores)
PARTICULAR 2018 %
LIABILITIES
SHARE CAPITAL 1204 186.08
RESERVES (6098) (942.50)
BORROWINGS 4514 697.68
OTHER LIABILITIES 1027 158.73
TOTAL LIABILITIES 647 100
ASSETS
FIXED ASSETS 66 10.20
CWIP 11 1.70
INVESTMENT 1 0.15
OTHER ASSETS 569 87.94
TOTAL ASSETS 647 100
INTERPRETATION
It showed the financial analysis for the year 2018.
The overall financial performance of the company was satisfactory
7. TABLE NO 4.2.2
COMMON SIZE BALANCE SHEET FOR THE YEAR 2019
(RS in crores)
PARTICULAR 2019 %
LIABILITIES
SHARE CAPITAL 356 47.59
RESERVES (5107) (682.75)
BORROWINGS 4344 580.74
OTHER LIABILITIES 1155 154.41
TOTAL LIABILITIES 748 100
ASSETS
FIXED ASSETS 59 7.88
CWIP 15 2.00
INVESTMENT 0 0
OTHER ASSETS 673 89.97
TOTAL ASSETS 748 100
INTERPRETATION
It showed the financial analysis for the year 2019.
The overall financial performance of the company was satisfactory
8. TABLE NO 4.2.3
COMMON SIZE BALANCE SHEET FOR THE YEAR 2020
(RS in crores)
PARTICULAR 2020 %
LIABILITIES
SHARE CAPITAL 356 47.59
RESERVES (4959) (662.96)
BORROWINGS 4376 585.02
OTHER LIABILITIES 976 130.48
TOTAL LIABILITIES 748 100
ASSETS
FIXED ASSETS 66 8.82
CWIP 7 0.93
INVESTMENT 0 0
OTHER ASSETS 675 90.24
TOTAL ASSETS 748 100
INTERPRETATION
It showed the financial analysis for the year 2020.
The overall financial performance of the company was satisfactory
9. TABLE NO 4.2.4
COMMON SIZE BALANCE SHEET FOR THE YEAR 2021
(RS in crores)
PARTICULAR 2021 %
LIABILITIES
SHARE CAPITAL 356 50.85
RESERVES (5069) (724.14)
BORROWINGS 4405 629.28
OTHER LIABILITIES 1009 144.14
TOTAL LIABILITIES 700 100
ASSETS
FIXED ASSETS 60 8.57
CWIP 6 0.85
INVESTMENT 0 0
OTHER ASSETS 635 90.71
TOTAL ASSETS 700 100
INTERPRETATION
It showed the financial analysis for the year 2021.
The overall financial performance of the company was satisfactory
10. TABLE NO 4.2.5
COMMON SIZE BALANCE SHEET FOR THE YEAR 2022
(RS in crores)
PARTICULAR 2022 %
LIABILITIES
SHARE CAPITAL 356 53.93
RESERVES (4536) (687.27)
BORROWINGS 3753 568.63
OTHER LIABILITIES 1087 164.69
TOTAL LIABILITIES 660 100
ASSETS
FIXED ASSETS 53 8.03
CWIP 7 1.06
INVESTMENT 0 0
OTHER ASSETS 560 90.90
TOTAL ASSETS 660 100
INTERPRETATION
It showed the financial analysis for the year 2022.
The overall financial performance of the company was satisfactory