SlideShare uma empresa Scribd logo
1 de 39
Baixar para ler offline
Objectives to understand :
Central tendency and how to measure the
dispersions.
12/15/2022 1
• Central tendency
• Measures of Dispersion
More about Data Science
Measures of Central Tendency
12/15/2022 2
• Measures of central tendency yield information about “particular
places or locations in a group of numbers.”
• A single number to describe the characteristics of a set of data
More about Data Science
Summary statistics
12/15/2022 3
• Central tendency or
measures of location
– Arithmetic mean
– Weighted mean
– Median
– Percentile
• Dispersion
– Skewness
– Kurtosis
– Range
– Interquartile range
– Variance
– Standard score
– Coefficient of
variation
More about Data Science
Arithmetic Mean
12/15/2022
• Commonly called ‘the mean’
• It is the average of a group of numbers
• Applicable for interval and ratio data
• Not applicable for nominal or ordinal data
• Affected by each value in the data set, including extreme values
• Computed by summing all values in the data set and dividing the
sum by
the number of values in the data set
4
More about Data Science
Population Mean
12/15/2022
N
5
N
2 X 3 X N
  ... 
 X 1
 X

2 4  1 3  1 9  2 6  1 1
5

9 3
5
 1 8 . 6
   X
More about Data Science
Sample Mean
12/15/2022
X   X
 X 1
 X 2
 X 3
 ...  Xn
n n

57  86  42  38  90  66
6

379
6
 63.167
6
More about Data Science
Mean of Grouped Data
12/15/2022
• Weighted average of class midpoints
• Class frequencies are the weights
   fM
 f
  fM
N

f 1M 1  f 2 M 2  f 3 M 3    fiMi
f 1  f 2  f 3    fi
7
More about Data Science
Calculation of Grouped Mean
12/15/2022
Class Interval Frequency(f) Class Midpoint(M) fM
20-under 30 6 25 150
30-under 40 18 35 630
40-under 50 11 45 495
50-under 60 11 55 605
60-under 70 3 65 195
70-under 80 1 75 75
50 2150
fM

2150
 43.0
8
f 50
More about Data Science
Weighted Average
12/15/2022
• Sometimes we wish to average numbers, but we want to assign
more importance, or weight, to some of the numbers.
• The average you need is the weighted average.
More about Data Science
Formula for Weighted Average
12/15/2022
Weighted Average 
 xw
w
where x is a data value and w is
the weight assigned to thatdata
value. The sum is taken over all
data values.
More about Data Science
Example
12/15/2022
1

32  57
 90.2
Suppose your midterm test score is 83 and your final exam score is
95. Using weights of 40% for the midterm and 60% for the final
exam, compute the weighted average of your scores. If the minimum
average for an A is 90, will you earn an A?
Weighted Average 
830.40950.60
0.40 0.60
You will earn an
A!
More about Data Science
Median
12/15/2022
• Middle value in an ordered array of numbers
• Applicable for ordinal, interval, and ratio data
• Not applicable for nominal data
• Unaffected by extremely large and extremely small values
More about Data Science
Median:Computational Procedure
12/15/2022
• First Procedure
– Arrange the observations in an ordered array
– If there is an odd number of terms, the median is the middle term of
the ordered array
– If there is an even number of terms, the median is the average
of the middle two terms
• Second Procedure
– The median’s position in an ordered array is given by (n+1)/2.
More about Data Science
Median:Example with an Odd Number of Terms
12/15/2022
Ordered Array
3 4 5 7 8 9 11 14 15 16 16 17 19 19 20 21 22
• There are 17 terms in the ordered array.
• Position of median = (n+1)/2 = (17+1)/2 = 9
• The median is the 9th term, 15.
• If the 22 is replaced by 100, the median is 15.
• If the 3 is replaced by -103, the median is 15.
More about Data Science
Median:Example with an Even Number of Terms
12/15/2022
Ordered Array
3 4 5 7 8 9 11 14 15 16 16 17 19 19 20 21
• There are 16 terms in the ordered array
• Position of median = (n+1)/2 = (16+1)/2 = 8.5
• The median is between the 8th and 9th terms, 14.5
• If the 21 is replaced by 100, the median is 14.5
• If the 3 is replaced by -88, the median is 14.5
More about Data Science
Median of Grouped Data
12/15/2022
fmed
N  cfp
Median  L  2 W 
Where :
L  the lower limit of the median class
cfp = cumulative frequency of class preceding the median class
fmed = frequency of the median class
W = width of the median class
N = total of frequencies
More about Data Science
Median of Grouped Data -- Example
12/15/2022
Cumulative
Class Interval Frequency Frequency
20-under 30 6 6
30-under 40 18 24
40-under 50 11 35
50-under 60 11 46
60-under 70 3 49
70-under 80 1 50
N = 50
11
40.909
N
 cfp
Md  L 2 W
fmed
50
24
 40 2 10
More about Data Science
Mode
12/15/2022
• The most frequently occurring value in a data set
• Applicable to all levels of data measurement (nominal, ordinal,
interval,
and ratio)
• Bimodal -- Data sets that have two modes
• Multimodal -- Data sets that contain more than two modes
More about Data Science
• The mode is 44
• There are more 44s
than any other value
35 41 44 45
37 41 44 46
37 43 44 46
39 43 44 46
40 43 44 46
40 43 45 48
Mode -- Example
12/15/2022 More about Data Science
Mode of Grouped Data
12/15/2022
• Midpoint of the modal class
• Modal class has the greatest frequency
Class Interval Frequency
20-under 30 6
30-under 40 18
40-under 50 11
50-under 60 11
60-under 70 3
70-under 80 1
1 2
M o
d1
M o d e  L 
 
w 
 d 
 d
 1 2 
 
3 0   1 2  7  1 0  3 6 . 3 1
 
More about Data Science
Percentiles
12/15/2022
• Measures of central tendency that divide a group of data into 100
parts
• Example: 90th percentile indicates that at most 90% of the
data lie below it, and at least 10% of the data lie above it
• The median and the 50th percentile have the same value
• Applicable for ordinal, interval, and ratio data
• Not applicable for nominal data
More about Data Science
Percentiles: Computational Procedure
12/15/2022
• If i is a whole number, the percentile is the average of the values at
the i and (i+1) positions
• If i is not a whole number, the percentile is at the (i+1) position in
the ordered array
100
• Determine the percentile’s location and its
value.
• Organize the data into an ascending ordered array
• Calculate the p th percentile location:
• i 
P
(n)
More about Data Science
Percentiles: Example
12/15/2022
• The location index, i, is not a whole number; i+1 = 2.4+1=3.4; the
whole number portion is 3; the 30th percentile is at the 3rd location of
the array; the 30th percentile is 13.
100
• Raw Data: 14, 12, 19, 23, 5, 13, 28, 17
• Ordered Array: 5, 12, 13, 14, 17, 19, 23, 28
• Location of 30th percentile:
i 
30
(8)  2.4
More about Data Science
Dispersion
12/15/2022
• Measures of variability describe the spread or the dispersion of a
set of data
• Reliability of measure of central tendency
• To compare dispersion of various samples
More about Data Science
Variability
12/15/2022
Mean
No Variability in Cash Flow
Variability in Cash Flow Mean
More about Data Science
Measures of Variability or dispersion
12/15/2022
Common Measures of Variability
• Range
• Inter-quartile range
• Mean Absolute Deviation
• Variance
• Standard Deviation
• Z scores
• Coefficient of Variation
More about Data Science
Range – ungrouped data
12/15/2022
• The difference between the largest and the smallest
values in a set of data
• Simple to compute
• Ignores all data points except the two extremes
• Example:
Range = Largest – Smallest = 48 - 35 = 13
35 41 44 45
37 41 44 46
37 43 44 46
39 43 44 46
40 43 44 46
40 43 45 48
More about Data Science
• Measures of central tendency that divide a group of data into four
subgroups
• Q1: 25% of the data set is below the first quartile
• Q2: 50% of the data set is below the second quartile
• Q3: 75% of the data set is below the third quartile
• Q1 is equal to the 25th percentile
• Q2 is located at 50th percentile and equals the median
• Q3 is equal to the 75th percentile
• Quartile values are not necessarily members of the data set
Quartiles
12/15/2022 More about Data Science
Quartiles
12/15/2022
25% 25% 25% 25%
Q3
Q2
Q1
More about Data Science
• Ordered array: 106, 109, 114, 116, 121, 122, 125,
129
• Q1
• Q2:
• Q3:
Quartiles: Example
12/15/2022
i 
25
(8)  2
100
Q1 
109  11 4
 111.5
2
i 
50
(8)  4
100
Q 2 
116  1 2 1
 118.5
2
i 
75
(8)  6
100
Q 3 
122  1 2 5
 123.5
2
More about Data Science
Interquartile Range
12/15/2022
• Range of values between the first and third quartiles
• Range of the “middle half”
• Less influenced by extremes
Interquartile Range  Q3 Q1
More about Data Science
Deviation from the
Mean
12/15/2022
• Data set: 5, 9, 16, 17, 18
• Mean N 5
• Deviations from the mean: -8, -4, 3, 4, 5
X

65
13
0 5 10 15 20
-8
-4
+3
+4
+5

More about Data Science
Mean Absolute Deviation
12/15/2022
• Average of the absolute deviations from the
mean
X X   X  
5
5 -8 +8 N
9
16
-4
+3
+4
+3 
24
17
18
+4
+5
+4
+5
 4.8
0 24
M .A.D.   X  
More about Data Science
Population Variance
• Average of the squared deviations from the arithmetic
mean
-8
-4
+3
+4
+5
0
X
5
9
16
17
18
X   X   2
64
16
9
16
25
130
2
12/15/2022
2
N
 

130
5
 26.0
 X  
More about Data Science
Population Standard Deviation
• Square root of the variance
2
2

 2


 26.0
 
 26.0
 5.1
 X   
N
130
5
-8
-4
+3
+4
+5
0
X
5
9
16
17
18
X   X   2
64
16
9
16
25
130
12/15/2022 More about Data Science
Sample Variance
• Average of the squared deviations from the arithmetic
mean
625 390,625
71 5,041
-234 54,756
-462 213,444
0 663,866
X
2,398
1,844
1,539
1,311
7,092
X  X X  X 2
2
12/15/2022
2
S 
n 1

663,866
3
 221,288.67
X X 
More about Data Science
Sample Standard Deviation
12/15/2022
• Square root of the sample
variance
2
2
S
S
2

n  1

663,866
3
 221, 288.67
S 
 221, 288.67
 470.41
 X  X 
625 390,625
71 5,041
-234 54,756
-462 213,444
0 663,866
X
2,398
1,844
1,539
1,311
7,092
X  X X  X 2
X
More about Data Science
Uses of Standard Deviation
12/15/2022
• Indicator of financial risk
• Quality Control
– construction of quality control
charts
– process capability studies
• Comparing populations
– household incomes in two cities
– employee absenteeism at two
plants
More about Data Science
Standard Deviation as an Indicator of
Financial Risk
12/15/2022
Financial
Security
Annualized Rate of Return
 
A
B
15%
15%
3%
7%
More about Data Science

Mais conteúdo relacionado

Semelhante a More about data science post.pdf

local_media4419196206087945469 (1).pptx
local_media4419196206087945469 (1).pptxlocal_media4419196206087945469 (1).pptx
local_media4419196206087945469 (1).pptxJayArRodriguez2
 
measure of dispersion
measure of dispersion measure of dispersion
measure of dispersion som allul
 
Measures of Dispersion
Measures of DispersionMeasures of Dispersion
Measures of DispersionKainatIqbal7
 
Numerical measures stat ppt @ bec doms
Numerical measures stat ppt @ bec domsNumerical measures stat ppt @ bec doms
Numerical measures stat ppt @ bec domsBabasab Patil
 
Central tendency and Variation or Dispersion
Central tendency and Variation or DispersionCentral tendency and Variation or Dispersion
Central tendency and Variation or DispersionJohny Kutty Joseph
 
Biostatistics Measures of central tendency
Biostatistics Measures of central tendency Biostatistics Measures of central tendency
Biostatistics Measures of central tendency HARINATHA REDDY ASWARTHA
 
1.0 Descriptive statistics.pdf
1.0 Descriptive statistics.pdf1.0 Descriptive statistics.pdf
1.0 Descriptive statistics.pdfthaersyam
 
measure of variability (windri). In research include example
measure of variability (windri). In research include examplemeasure of variability (windri). In research include example
measure of variability (windri). In research include examplewindri3
 
Biostatistics cource for clinical pharmacy
Biostatistics cource for clinical pharmacyBiostatistics cource for clinical pharmacy
Biostatistics cource for clinical pharmacyBatizemaryam
 
Chapter 3 Ken Black 2.ppt
Chapter 3 Ken Black 2.pptChapter 3 Ken Black 2.ppt
Chapter 3 Ken Black 2.pptNurinaSWGotami
 
Measures of Central Tendency, Variability and Shapes
Measures of Central Tendency, Variability and ShapesMeasures of Central Tendency, Variability and Shapes
Measures of Central Tendency, Variability and ShapesScholarsPoint1
 
Statistics for analytics
Statistics for analyticsStatistics for analytics
Statistics for analyticsdeepika4721
 
Module 3 statistics
Module 3   statisticsModule 3   statistics
Module 3 statisticsdionesioable
 

Semelhante a More about data science post.pdf (20)

local_media4419196206087945469 (1).pptx
local_media4419196206087945469 (1).pptxlocal_media4419196206087945469 (1).pptx
local_media4419196206087945469 (1).pptx
 
Dscriptive statistics
Dscriptive statisticsDscriptive statistics
Dscriptive statistics
 
measure of dispersion
measure of dispersion measure of dispersion
measure of dispersion
 
Measures of Dispersion
Measures of DispersionMeasures of Dispersion
Measures of Dispersion
 
Numerical measures stat ppt @ bec doms
Numerical measures stat ppt @ bec domsNumerical measures stat ppt @ bec doms
Numerical measures stat ppt @ bec doms
 
DESCRIBING VARIABILITY.pptx
DESCRIBING  VARIABILITY.pptxDESCRIBING  VARIABILITY.pptx
DESCRIBING VARIABILITY.pptx
 
Central tendency and Variation or Dispersion
Central tendency and Variation or DispersionCentral tendency and Variation or Dispersion
Central tendency and Variation or Dispersion
 
Biostatistics Measures of central tendency
Biostatistics Measures of central tendency Biostatistics Measures of central tendency
Biostatistics Measures of central tendency
 
1.0 Descriptive statistics.pdf
1.0 Descriptive statistics.pdf1.0 Descriptive statistics.pdf
1.0 Descriptive statistics.pdf
 
Statistics 3, 4
Statistics 3, 4Statistics 3, 4
Statistics 3, 4
 
Descriptive statistics
Descriptive statisticsDescriptive statistics
Descriptive statistics
 
measure of variability (windri). In research include example
measure of variability (windri). In research include examplemeasure of variability (windri). In research include example
measure of variability (windri). In research include example
 
Measures of Dispersion.pptx
Measures of Dispersion.pptxMeasures of Dispersion.pptx
Measures of Dispersion.pptx
 
Biostatistics cource for clinical pharmacy
Biostatistics cource for clinical pharmacyBiostatistics cource for clinical pharmacy
Biostatistics cource for clinical pharmacy
 
Chapter 3 Ken Black 2.ppt
Chapter 3 Ken Black 2.pptChapter 3 Ken Black 2.ppt
Chapter 3 Ken Black 2.ppt
 
Measure of dispersion 10321
Measure of dispersion 10321Measure of dispersion 10321
Measure of dispersion 10321
 
Measures of Central Tendency, Variability and Shapes
Measures of Central Tendency, Variability and ShapesMeasures of Central Tendency, Variability and Shapes
Measures of Central Tendency, Variability and Shapes
 
Mod mean quartile
Mod mean quartileMod mean quartile
Mod mean quartile
 
Statistics for analytics
Statistics for analyticsStatistics for analytics
Statistics for analytics
 
Module 3 statistics
Module 3   statisticsModule 3   statistics
Module 3 statistics
 

Último

Zuja dropshipping via API with DroFx.pptx
Zuja dropshipping via API with DroFx.pptxZuja dropshipping via API with DroFx.pptx
Zuja dropshipping via API with DroFx.pptxolyaivanovalion
 
Al Barsha Escorts $#$ O565212860 $#$ Escort Service In Al Barsha
Al Barsha Escorts $#$ O565212860 $#$ Escort Service In Al BarshaAl Barsha Escorts $#$ O565212860 $#$ Escort Service In Al Barsha
Al Barsha Escorts $#$ O565212860 $#$ Escort Service In Al BarshaAroojKhan71
 
Call Girls Indiranagar Just Call 👗 7737669865 👗 Top Class Call Girl Service B...
Call Girls Indiranagar Just Call 👗 7737669865 👗 Top Class Call Girl Service B...Call Girls Indiranagar Just Call 👗 7737669865 👗 Top Class Call Girl Service B...
Call Girls Indiranagar Just Call 👗 7737669865 👗 Top Class Call Girl Service B...amitlee9823
 
Invezz.com - Grow your wealth with trading signals
Invezz.com - Grow your wealth with trading signalsInvezz.com - Grow your wealth with trading signals
Invezz.com - Grow your wealth with trading signalsInvezz1
 
Midocean dropshipping via API with DroFx
Midocean dropshipping via API with DroFxMidocean dropshipping via API with DroFx
Midocean dropshipping via API with DroFxolyaivanovalion
 
Week-01-2.ppt BBB human Computer interaction
Week-01-2.ppt BBB human Computer interactionWeek-01-2.ppt BBB human Computer interaction
Week-01-2.ppt BBB human Computer interactionfulawalesam
 
Call me @ 9892124323 Cheap Rate Call Girls in Vashi with Real Photo 100% Secure
Call me @ 9892124323  Cheap Rate Call Girls in Vashi with Real Photo 100% SecureCall me @ 9892124323  Cheap Rate Call Girls in Vashi with Real Photo 100% Secure
Call me @ 9892124323 Cheap Rate Call Girls in Vashi with Real Photo 100% SecurePooja Nehwal
 
Digital Advertising Lecture for Advanced Digital & Social Media Strategy at U...
Digital Advertising Lecture for Advanced Digital & Social Media Strategy at U...Digital Advertising Lecture for Advanced Digital & Social Media Strategy at U...
Digital Advertising Lecture for Advanced Digital & Social Media Strategy at U...Valters Lauzums
 
Best VIP Call Girls Noida Sector 22 Call Me: 8448380779
Best VIP Call Girls Noida Sector 22 Call Me: 8448380779Best VIP Call Girls Noida Sector 22 Call Me: 8448380779
Best VIP Call Girls Noida Sector 22 Call Me: 8448380779Delhi Call girls
 
FESE Capital Markets Fact Sheet 2024 Q1.pdf
FESE Capital Markets Fact Sheet 2024 Q1.pdfFESE Capital Markets Fact Sheet 2024 Q1.pdf
FESE Capital Markets Fact Sheet 2024 Q1.pdfMarinCaroMartnezBerg
 
Cheap Rate Call girls Sarita Vihar Delhi 9205541914 shot 1500 night
Cheap Rate Call girls Sarita Vihar Delhi 9205541914 shot 1500 nightCheap Rate Call girls Sarita Vihar Delhi 9205541914 shot 1500 night
Cheap Rate Call girls Sarita Vihar Delhi 9205541914 shot 1500 nightDelhi Call girls
 
Delhi Call Girls Punjabi Bagh 9711199171 ☎✔👌✔ Whatsapp Hard And Sexy Vip Call
Delhi Call Girls Punjabi Bagh 9711199171 ☎✔👌✔ Whatsapp Hard And Sexy Vip CallDelhi Call Girls Punjabi Bagh 9711199171 ☎✔👌✔ Whatsapp Hard And Sexy Vip Call
Delhi Call Girls Punjabi Bagh 9711199171 ☎✔👌✔ Whatsapp Hard And Sexy Vip Callshivangimorya083
 
Junnasandra Call Girls: 🍓 7737669865 🍓 High Profile Model Escorts | Bangalore...
Junnasandra Call Girls: 🍓 7737669865 🍓 High Profile Model Escorts | Bangalore...Junnasandra Call Girls: 🍓 7737669865 🍓 High Profile Model Escorts | Bangalore...
Junnasandra Call Girls: 🍓 7737669865 🍓 High Profile Model Escorts | Bangalore...amitlee9823
 
Log Analysis using OSSEC sasoasasasas.pptx
Log Analysis using OSSEC sasoasasasas.pptxLog Analysis using OSSEC sasoasasasas.pptx
Log Analysis using OSSEC sasoasasasas.pptxJohnnyPlasten
 
Smarteg dropshipping via API with DroFx.pptx
Smarteg dropshipping via API with DroFx.pptxSmarteg dropshipping via API with DroFx.pptx
Smarteg dropshipping via API with DroFx.pptxolyaivanovalion
 
VidaXL dropshipping via API with DroFx.pptx
VidaXL dropshipping via API with DroFx.pptxVidaXL dropshipping via API with DroFx.pptx
VidaXL dropshipping via API with DroFx.pptxolyaivanovalion
 
Chintamani Call Girls: 🍓 7737669865 🍓 High Profile Model Escorts | Bangalore ...
Chintamani Call Girls: 🍓 7737669865 🍓 High Profile Model Escorts | Bangalore ...Chintamani Call Girls: 🍓 7737669865 🍓 High Profile Model Escorts | Bangalore ...
Chintamani Call Girls: 🍓 7737669865 🍓 High Profile Model Escorts | Bangalore ...amitlee9823
 
Best VIP Call Girls Noida Sector 39 Call Me: 8448380779
Best VIP Call Girls Noida Sector 39 Call Me: 8448380779Best VIP Call Girls Noida Sector 39 Call Me: 8448380779
Best VIP Call Girls Noida Sector 39 Call Me: 8448380779Delhi Call girls
 

Último (20)

Zuja dropshipping via API with DroFx.pptx
Zuja dropshipping via API with DroFx.pptxZuja dropshipping via API with DroFx.pptx
Zuja dropshipping via API with DroFx.pptx
 
Al Barsha Escorts $#$ O565212860 $#$ Escort Service In Al Barsha
Al Barsha Escorts $#$ O565212860 $#$ Escort Service In Al BarshaAl Barsha Escorts $#$ O565212860 $#$ Escort Service In Al Barsha
Al Barsha Escorts $#$ O565212860 $#$ Escort Service In Al Barsha
 
Call Girls Indiranagar Just Call 👗 7737669865 👗 Top Class Call Girl Service B...
Call Girls Indiranagar Just Call 👗 7737669865 👗 Top Class Call Girl Service B...Call Girls Indiranagar Just Call 👗 7737669865 👗 Top Class Call Girl Service B...
Call Girls Indiranagar Just Call 👗 7737669865 👗 Top Class Call Girl Service B...
 
Invezz.com - Grow your wealth with trading signals
Invezz.com - Grow your wealth with trading signalsInvezz.com - Grow your wealth with trading signals
Invezz.com - Grow your wealth with trading signals
 
Midocean dropshipping via API with DroFx
Midocean dropshipping via API with DroFxMidocean dropshipping via API with DroFx
Midocean dropshipping via API with DroFx
 
Week-01-2.ppt BBB human Computer interaction
Week-01-2.ppt BBB human Computer interactionWeek-01-2.ppt BBB human Computer interaction
Week-01-2.ppt BBB human Computer interaction
 
Call me @ 9892124323 Cheap Rate Call Girls in Vashi with Real Photo 100% Secure
Call me @ 9892124323  Cheap Rate Call Girls in Vashi with Real Photo 100% SecureCall me @ 9892124323  Cheap Rate Call Girls in Vashi with Real Photo 100% Secure
Call me @ 9892124323 Cheap Rate Call Girls in Vashi with Real Photo 100% Secure
 
Digital Advertising Lecture for Advanced Digital & Social Media Strategy at U...
Digital Advertising Lecture for Advanced Digital & Social Media Strategy at U...Digital Advertising Lecture for Advanced Digital & Social Media Strategy at U...
Digital Advertising Lecture for Advanced Digital & Social Media Strategy at U...
 
Best VIP Call Girls Noida Sector 22 Call Me: 8448380779
Best VIP Call Girls Noida Sector 22 Call Me: 8448380779Best VIP Call Girls Noida Sector 22 Call Me: 8448380779
Best VIP Call Girls Noida Sector 22 Call Me: 8448380779
 
FESE Capital Markets Fact Sheet 2024 Q1.pdf
FESE Capital Markets Fact Sheet 2024 Q1.pdfFESE Capital Markets Fact Sheet 2024 Q1.pdf
FESE Capital Markets Fact Sheet 2024 Q1.pdf
 
Cheap Rate Call girls Sarita Vihar Delhi 9205541914 shot 1500 night
Cheap Rate Call girls Sarita Vihar Delhi 9205541914 shot 1500 nightCheap Rate Call girls Sarita Vihar Delhi 9205541914 shot 1500 night
Cheap Rate Call girls Sarita Vihar Delhi 9205541914 shot 1500 night
 
Delhi Call Girls Punjabi Bagh 9711199171 ☎✔👌✔ Whatsapp Hard And Sexy Vip Call
Delhi Call Girls Punjabi Bagh 9711199171 ☎✔👌✔ Whatsapp Hard And Sexy Vip CallDelhi Call Girls Punjabi Bagh 9711199171 ☎✔👌✔ Whatsapp Hard And Sexy Vip Call
Delhi Call Girls Punjabi Bagh 9711199171 ☎✔👌✔ Whatsapp Hard And Sexy Vip Call
 
Junnasandra Call Girls: 🍓 7737669865 🍓 High Profile Model Escorts | Bangalore...
Junnasandra Call Girls: 🍓 7737669865 🍓 High Profile Model Escorts | Bangalore...Junnasandra Call Girls: 🍓 7737669865 🍓 High Profile Model Escorts | Bangalore...
Junnasandra Call Girls: 🍓 7737669865 🍓 High Profile Model Escorts | Bangalore...
 
Sampling (random) method and Non random.ppt
Sampling (random) method and Non random.pptSampling (random) method and Non random.ppt
Sampling (random) method and Non random.ppt
 
Abortion pills in Doha Qatar (+966572737505 ! Get Cytotec
Abortion pills in Doha Qatar (+966572737505 ! Get CytotecAbortion pills in Doha Qatar (+966572737505 ! Get Cytotec
Abortion pills in Doha Qatar (+966572737505 ! Get Cytotec
 
Log Analysis using OSSEC sasoasasasas.pptx
Log Analysis using OSSEC sasoasasasas.pptxLog Analysis using OSSEC sasoasasasas.pptx
Log Analysis using OSSEC sasoasasasas.pptx
 
Smarteg dropshipping via API with DroFx.pptx
Smarteg dropshipping via API with DroFx.pptxSmarteg dropshipping via API with DroFx.pptx
Smarteg dropshipping via API with DroFx.pptx
 
VidaXL dropshipping via API with DroFx.pptx
VidaXL dropshipping via API with DroFx.pptxVidaXL dropshipping via API with DroFx.pptx
VidaXL dropshipping via API with DroFx.pptx
 
Chintamani Call Girls: 🍓 7737669865 🍓 High Profile Model Escorts | Bangalore ...
Chintamani Call Girls: 🍓 7737669865 🍓 High Profile Model Escorts | Bangalore ...Chintamani Call Girls: 🍓 7737669865 🍓 High Profile Model Escorts | Bangalore ...
Chintamani Call Girls: 🍓 7737669865 🍓 High Profile Model Escorts | Bangalore ...
 
Best VIP Call Girls Noida Sector 39 Call Me: 8448380779
Best VIP Call Girls Noida Sector 39 Call Me: 8448380779Best VIP Call Girls Noida Sector 39 Call Me: 8448380779
Best VIP Call Girls Noida Sector 39 Call Me: 8448380779
 

More about data science post.pdf

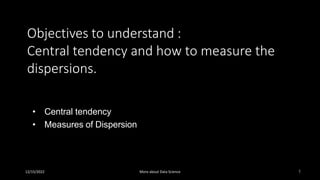
  • 1. Objectives to understand : Central tendency and how to measure the dispersions. 12/15/2022 1 • Central tendency • Measures of Dispersion More about Data Science
  • 2. Measures of Central Tendency 12/15/2022 2 • Measures of central tendency yield information about “particular places or locations in a group of numbers.” • A single number to describe the characteristics of a set of data More about Data Science
  • 3. Summary statistics 12/15/2022 3 • Central tendency or measures of location – Arithmetic mean – Weighted mean – Median – Percentile • Dispersion – Skewness – Kurtosis – Range – Interquartile range – Variance – Standard score – Coefficient of variation More about Data Science
  • 4. Arithmetic Mean 12/15/2022 • Commonly called ‘the mean’ • It is the average of a group of numbers • Applicable for interval and ratio data • Not applicable for nominal or ordinal data • Affected by each value in the data set, including extreme values • Computed by summing all values in the data set and dividing the sum by the number of values in the data set 4 More about Data Science
  • 5. Population Mean 12/15/2022 N 5 N 2 X 3 X N   ...   X 1  X  2 4  1 3  1 9  2 6  1 1 5  9 3 5  1 8 . 6    X More about Data Science
  • 6. Sample Mean 12/15/2022 X   X  X 1  X 2  X 3  ...  Xn n n  57  86  42  38  90  66 6  379 6  63.167 6 More about Data Science
  • 7. Mean of Grouped Data 12/15/2022 • Weighted average of class midpoints • Class frequencies are the weights    fM  f   fM N  f 1M 1  f 2 M 2  f 3 M 3    fiMi f 1  f 2  f 3    fi 7 More about Data Science
  • 8. Calculation of Grouped Mean 12/15/2022 Class Interval Frequency(f) Class Midpoint(M) fM 20-under 30 6 25 150 30-under 40 18 35 630 40-under 50 11 45 495 50-under 60 11 55 605 60-under 70 3 65 195 70-under 80 1 75 75 50 2150 fM  2150  43.0 8 f 50 More about Data Science
  • 9. Weighted Average 12/15/2022 • Sometimes we wish to average numbers, but we want to assign more importance, or weight, to some of the numbers. • The average you need is the weighted average. More about Data Science
  • 10. Formula for Weighted Average 12/15/2022 Weighted Average   xw w where x is a data value and w is the weight assigned to thatdata value. The sum is taken over all data values. More about Data Science
  • 11. Example 12/15/2022 1  32  57  90.2 Suppose your midterm test score is 83 and your final exam score is 95. Using weights of 40% for the midterm and 60% for the final exam, compute the weighted average of your scores. If the minimum average for an A is 90, will you earn an A? Weighted Average  830.40950.60 0.40 0.60 You will earn an A! More about Data Science
  • 12. Median 12/15/2022 • Middle value in an ordered array of numbers • Applicable for ordinal, interval, and ratio data • Not applicable for nominal data • Unaffected by extremely large and extremely small values More about Data Science
  • 13. Median:Computational Procedure 12/15/2022 • First Procedure – Arrange the observations in an ordered array – If there is an odd number of terms, the median is the middle term of the ordered array – If there is an even number of terms, the median is the average of the middle two terms • Second Procedure – The median’s position in an ordered array is given by (n+1)/2. More about Data Science
  • 14. Median:Example with an Odd Number of Terms 12/15/2022 Ordered Array 3 4 5 7 8 9 11 14 15 16 16 17 19 19 20 21 22 • There are 17 terms in the ordered array. • Position of median = (n+1)/2 = (17+1)/2 = 9 • The median is the 9th term, 15. • If the 22 is replaced by 100, the median is 15. • If the 3 is replaced by -103, the median is 15. More about Data Science
  • 15. Median:Example with an Even Number of Terms 12/15/2022 Ordered Array 3 4 5 7 8 9 11 14 15 16 16 17 19 19 20 21 • There are 16 terms in the ordered array • Position of median = (n+1)/2 = (16+1)/2 = 8.5 • The median is between the 8th and 9th terms, 14.5 • If the 21 is replaced by 100, the median is 14.5 • If the 3 is replaced by -88, the median is 14.5 More about Data Science
  • 16. Median of Grouped Data 12/15/2022 fmed N  cfp Median  L  2 W  Where : L  the lower limit of the median class cfp = cumulative frequency of class preceding the median class fmed = frequency of the median class W = width of the median class N = total of frequencies More about Data Science
  • 17. Median of Grouped Data -- Example 12/15/2022 Cumulative Class Interval Frequency Frequency 20-under 30 6 6 30-under 40 18 24 40-under 50 11 35 50-under 60 11 46 60-under 70 3 49 70-under 80 1 50 N = 50 11 40.909 N  cfp Md  L 2 W fmed 50 24  40 2 10 More about Data Science
  • 18. Mode 12/15/2022 • The most frequently occurring value in a data set • Applicable to all levels of data measurement (nominal, ordinal, interval, and ratio) • Bimodal -- Data sets that have two modes • Multimodal -- Data sets that contain more than two modes More about Data Science
  • 19. • The mode is 44 • There are more 44s than any other value 35 41 44 45 37 41 44 46 37 43 44 46 39 43 44 46 40 43 44 46 40 43 45 48 Mode -- Example 12/15/2022 More about Data Science
  • 20. Mode of Grouped Data 12/15/2022 • Midpoint of the modal class • Modal class has the greatest frequency Class Interval Frequency 20-under 30 6 30-under 40 18 40-under 50 11 50-under 60 11 60-under 70 3 70-under 80 1 1 2 M o d1 M o d e  L    w   d   d  1 2    3 0   1 2  7  1 0  3 6 . 3 1   More about Data Science
  • 21. Percentiles 12/15/2022 • Measures of central tendency that divide a group of data into 100 parts • Example: 90th percentile indicates that at most 90% of the data lie below it, and at least 10% of the data lie above it • The median and the 50th percentile have the same value • Applicable for ordinal, interval, and ratio data • Not applicable for nominal data More about Data Science
  • 22. Percentiles: Computational Procedure 12/15/2022 • If i is a whole number, the percentile is the average of the values at the i and (i+1) positions • If i is not a whole number, the percentile is at the (i+1) position in the ordered array 100 • Determine the percentile’s location and its value. • Organize the data into an ascending ordered array • Calculate the p th percentile location: • i  P (n) More about Data Science
  • 23. Percentiles: Example 12/15/2022 • The location index, i, is not a whole number; i+1 = 2.4+1=3.4; the whole number portion is 3; the 30th percentile is at the 3rd location of the array; the 30th percentile is 13. 100 • Raw Data: 14, 12, 19, 23, 5, 13, 28, 17 • Ordered Array: 5, 12, 13, 14, 17, 19, 23, 28 • Location of 30th percentile: i  30 (8)  2.4 More about Data Science
  • 24. Dispersion 12/15/2022 • Measures of variability describe the spread or the dispersion of a set of data • Reliability of measure of central tendency • To compare dispersion of various samples More about Data Science
  • 25. Variability 12/15/2022 Mean No Variability in Cash Flow Variability in Cash Flow Mean More about Data Science
  • 26. Measures of Variability or dispersion 12/15/2022 Common Measures of Variability • Range • Inter-quartile range • Mean Absolute Deviation • Variance • Standard Deviation • Z scores • Coefficient of Variation More about Data Science
  • 27. Range – ungrouped data 12/15/2022 • The difference between the largest and the smallest values in a set of data • Simple to compute • Ignores all data points except the two extremes • Example: Range = Largest – Smallest = 48 - 35 = 13 35 41 44 45 37 41 44 46 37 43 44 46 39 43 44 46 40 43 44 46 40 43 45 48 More about Data Science
  • 28. • Measures of central tendency that divide a group of data into four subgroups • Q1: 25% of the data set is below the first quartile • Q2: 50% of the data set is below the second quartile • Q3: 75% of the data set is below the third quartile • Q1 is equal to the 25th percentile • Q2 is located at 50th percentile and equals the median • Q3 is equal to the 75th percentile • Quartile values are not necessarily members of the data set Quartiles 12/15/2022 More about Data Science
  • 29. Quartiles 12/15/2022 25% 25% 25% 25% Q3 Q2 Q1 More about Data Science
  • 30. • Ordered array: 106, 109, 114, 116, 121, 122, 125, 129 • Q1 • Q2: • Q3: Quartiles: Example 12/15/2022 i  25 (8)  2 100 Q1  109  11 4  111.5 2 i  50 (8)  4 100 Q 2  116  1 2 1  118.5 2 i  75 (8)  6 100 Q 3  122  1 2 5  123.5 2 More about Data Science
  • 31. Interquartile Range 12/15/2022 • Range of values between the first and third quartiles • Range of the “middle half” • Less influenced by extremes Interquartile Range  Q3 Q1 More about Data Science
  • 32. Deviation from the Mean 12/15/2022 • Data set: 5, 9, 16, 17, 18 • Mean N 5 • Deviations from the mean: -8, -4, 3, 4, 5 X  65 13 0 5 10 15 20 -8 -4 +3 +4 +5  More about Data Science
  • 33. Mean Absolute Deviation 12/15/2022 • Average of the absolute deviations from the mean X X   X   5 5 -8 +8 N 9 16 -4 +3 +4 +3  24 17 18 +4 +5 +4 +5  4.8 0 24 M .A.D.   X   More about Data Science
  • 34. Population Variance • Average of the squared deviations from the arithmetic mean -8 -4 +3 +4 +5 0 X 5 9 16 17 18 X   X   2 64 16 9 16 25 130 2 12/15/2022 2 N    130 5  26.0  X   More about Data Science
  • 35. Population Standard Deviation • Square root of the variance 2 2   2    26.0    26.0  5.1  X    N 130 5 -8 -4 +3 +4 +5 0 X 5 9 16 17 18 X   X   2 64 16 9 16 25 130 12/15/2022 More about Data Science
  • 36. Sample Variance • Average of the squared deviations from the arithmetic mean 625 390,625 71 5,041 -234 54,756 -462 213,444 0 663,866 X 2,398 1,844 1,539 1,311 7,092 X  X X  X 2 2 12/15/2022 2 S  n 1  663,866 3  221,288.67 X X  More about Data Science
  • 37. Sample Standard Deviation 12/15/2022 • Square root of the sample variance 2 2 S S 2  n  1  663,866 3  221, 288.67 S   221, 288.67  470.41  X  X  625 390,625 71 5,041 -234 54,756 -462 213,444 0 663,866 X 2,398 1,844 1,539 1,311 7,092 X  X X  X 2 X More about Data Science
  • 38. Uses of Standard Deviation 12/15/2022 • Indicator of financial risk • Quality Control – construction of quality control charts – process capability studies • Comparing populations – household incomes in two cities – employee absenteeism at two plants More about Data Science
  • 39. Standard Deviation as an Indicator of Financial Risk 12/15/2022 Financial Security Annualized Rate of Return   A B 15% 15% 3% 7% More about Data Science