S&P 500 broadening wedge
•
0 gostou•1,401 visualizações

Dow Jones Europe Index is testing primary support at 320. Breach would signal a down-trend. Follow-through below 315 would confirm. Penetration of the rising trendline and 13-week Twiggs Momentum peak below zero both strengthen the bear signal.

Recomendados
Mais conteúdo relacionado
Mais de Scutify
Mais de Scutify (20)
Último
Último (20)
S&P 500 broadening wedge
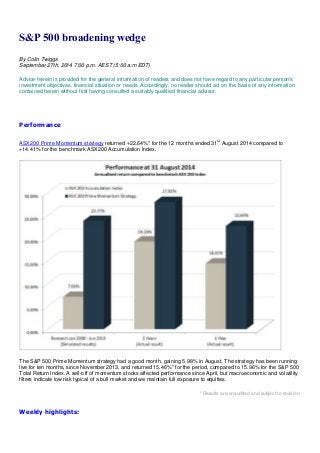
- 1. S&P 500 broadening wedge By Colin Twiggs September 27th, 2014 7:00 p.m. AEST (5:00 a:m EDT) Advice herein is provided for the general information of readers and does not have regard to any particular person's investment objectives, financial situation or needs. Accordingly, no reader should act on the basis of any information contained herein without first having consulted a suitably qualified financial advisor. Performance ASX200 Prime Momentum strategy returned +22.64%* for the 12 months ended 31st August 2014 compared to +14.41% for the benchmark ASX200 Accumulation Index. The S&P 500 Prime Momentum strategy had a good month, gaining 5.98% in August. The strategy has been running live for ten months, since November 2013, and returned 15.46%* for the period, compared to 15.96% for the S&P 500 Total Return Index. A sell-off of momentum stocks affected performance since April, but macroeconomic and volatility filters indicate low risk typical of a bull market and we maintain full exposure to equities. * Results are unaudited and subject to revision. Weekly highlights:
- 2. The Dollar is rising Gold and crude oil are falling European stocks remain bearish Asian stocks are bearish despite China showing strength US stocks reflect a bull market We are at the September quarter-end and can expect stock weakness to continue into October. Stock markets Dow Jones Europe Index is testing primary support at 320. Breach would signal a down-trend. Follow-through below 315 would confirm. Penetration of the rising trendline and 13-week Twiggs Momentum peak below zero both strengthen the bear signal. * Target calculation: 320 - ( 340 - 320 ) = 300 Dow Jones Asia Index broke primary support at 3200 despite bullishness on the Hang Seng and Shanghai Composite. Expect a test of support at 3000 (at the rising trendline). Reversal of 13-week Twiggs Momentum below zero would further strengthen the bear signal. Follow-through below 3000 would confirm a primary down-trend.
- 3. * Target calculation: 3100 + ( 3100 - 2800 ) = 3400 Shanghai Composite Index, however, continues to test resistance at 2350. Breakout would confirm a primary up-trend. Rising 13-week Twiggs Money Flow indicates medium-term buying pressure.
- 4. Bear in mind that Dow Asia and Dow Europe are priced in USD and reflect strength in the US Dollar as well as weakness in local markets — though the two are closely connected. The S&P 500 is consolidating around the 2000 level in a broadening wedge formation. Do not be surprised if the index rallies early next week, to test medium-term resistance at 2020. Fund managers are normally willing to support the market at quarter-end and lock in quarterly performance bonuses. But this is likely to be followed by weakness in October as they sell off non-performing stocks and increase cash holdings until new opportunities present themselves. Breakout below the broadening wedge — and penetration of both support at 1950 and the (secondary) rising trendline — would warn of a correction. A large volume spike from triple-witching hour on September 19th, however, has exaggerated weakness on Twiggs Money Flow. Breakout above 2020 would signal a fresh advance. * Target calculation: 2000 + ( 2000 - 1900 ) = 2100 CBOE Volatility Index (VIX) remains in the low range (below 20) typical of a bull market.
- 5. The ASX 200 is testing support at 5300/5350. Penetration of the rising trendline warns of a correction to 5000. Declining 13-week Twiggs Money Flow, below zero, after a long-term bearish divergence, also signals weakness. Breach of 5300 would confirm a test of 5000. Recovery above 5550 is unlikely, but would suggest another test of 5650. * Target calculation: 5650 + ( 5650 - 5350 ) = 5950