Water Worries -- Nitrogen From Septic Tanks, Fertilizer, Poor Sewage Treatment Damaging Long Island's Bays
•Transferir como PPTX, PDF•
1 gostou•1,399 visualizações

Prof Christopher Gobler of Stony Brook University, a global expert on algal blooms and their causes, presents his overview of Long Island's nitrogen pollution problem and how that is triggering destructive algal blooms throughout our bays. The main culprit? 500,000 septic tanks.

Recomendados
Recomendados
Mais conteúdo relacionado
Mais procurados
Mais procurados (20)
Semelhante a Water Worries -- Nitrogen From Septic Tanks, Fertilizer, Poor Sewage Treatment Damaging Long Island's Bays
Semelhante a Water Worries -- Nitrogen From Septic Tanks, Fertilizer, Poor Sewage Treatment Damaging Long Island's Bays (20)
Mais de Save The Great South Bay
Mais de Save The Great South Bay (19)
Último
Último (20)
Water Worries -- Nitrogen From Septic Tanks, Fertilizer, Poor Sewage Treatment Damaging Long Island's Bays
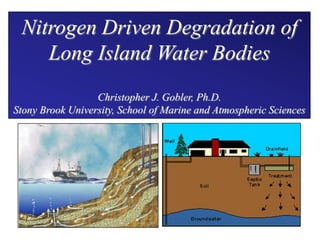
- 1. Nitrogen Driven Degradation of Long Island Water Bodies Christopher J. Gobler, Ph.D. Stony Brook University, School of Marine and Atmospheric Sciences
- 2. “Nitrogen is the critical limiting factor to algal growth in Long Island coastal marine waters” – Dr. John Ryther, Woods Hole Oceanographic Institute, Science Magazine, 1971
- 3. Population, Suffolk County, NY, USA >25,000,000 lbs of nitrogen per year from human waste 1,600,000 Population 1,400,000 1,200,000 1,000,000 800,000 New York City 600,000 400,000 200,000 0 1900 1910 1920 1930 1940 1950 1960 1970 1980 1990 2000 2010
- 4. Long Island Legacy: Household wastewater In Suffolk County, 70% of homes have septic tanks or cesspools. Septic tank In eastern Suffolk County, more than 90% of homes have septic tanks or cesspools. Nitrogen Water table / aquifer Groundwater flow Nitrogen
- 5. 18 year change in groundwater nitrogen levels 40% increase Nitrogen content (mg/L) 4 Glacial Magothy 200% increase 3 2 1 0 1987 Suffolk County Comprehensive Water Resources management plan, 2010 2005
- 6. Rising nitrogen levels in our bays Total Kjeldahl nitrogen (mg/L) 1.80 Great South Bay 1.60 1.60 Peconic Estuary 1.40 1.40 1.20 1.20 1.00 y = 2E-05x - 0.03 R² = 0.041 0.80 0.60 1.00 y = 3E-05x - 0.657 0.80 0.60 0.40 0.40 0.20 0.20 0.00 12/2/73 5/25/79 11/14/84 5/7/90 10/28/95 4/19/01 0.00 4/16/75 10/6/80 3/29/86 9/19/91 3/11/97
- 7. NYSDEC Impaired Water Bodies list Samples for eelgrass genetic analyses Hempstead Bay, Great South Bay, Moriches Bay, Quantuck Bay, and Shinnecock Bay listed on the NYSDEC 303d list of impaired water bodies due to “onsite waste disposal and urban runoff”. 100 kilometers! ¼ of L.I. coast!
- 8. Nitrogen budget for Great South Bay Fertilizer = 15% Atmospheric deposition = 30% Wastewater =55% Kinney and Valiela, 2011 •~70% of N entering Moriches and Shinnecock Bay is from wastewater (Gobler et al, in progress for NYSDOS).
- 9. Peconic nitrogen loading budgets
- 10. What impairments are brought about by excessive nitrogen loading? • • • • • • Loss of critical habitats: Eelgrass, salt marshes Low dissolved oxygen levels, hypoxia Acidification, low pH Macroalgal blooms: Sea lettuce, Ulva Toxic algal blooms: Red tides, brown tides Loss or depletion of shellfisheries and finfisheries
- 11. Nitrogen impacts on salt marshes • Salt marshes are critical habitats for protecting land, filtering terrestrial pollutants, migratory birds, and marine life on Long Island. • Nitrogen is accelerating the disappearance of salt marshes across Long Island.
- 13. Nitrogen loading as a driver of salt marsh loss on Long Island, Deegan et al 2012, Nature CAT scans of marsh roots Collapsing salt marsh Western Bays, Nassau County
- 16. Nitrogen impacts on seagrasses • Eelgrass are critical habitats for marine life on Long Island. • Nitrogen is accelerating the disappearance of eelgrass across Long Island.
- 17. Impacts of nitrogen loading on seagrass
- 18. Effect of nitrogen load on eelgrass growth, Peconic Estuary 120 Leaf mass (mg / SS) 100 80 60 40 20 0 0 230 480 Nitrogen loading (µM) Rodgers 2010; Rodgers, Peterson, Gobler, in prep 700
- 19. Regional view of nitrogen pollution index of salt marshes Dr. Fred Short, UNH Long Island eelgrass beds show multiple signs of degradation due to enrichment with sewagederived nitrogen.
- 20. Low (no) oxygen -another consequence of excessive nitrogen loading (Hewlett Bay) Dissolved Oxygen, mg L⁻¹ 12 10 8 6 4 2 0 Bottom NYS acute standard
- 21. Samples for eelgrass genetic analyses Harmful algal blooms across Long Island Cochlodinium PSP Toxic cyanobacteria PSP DSP PSP, DSP Ulva Toxic cyanos Cochlodinium Cochlodinium PSP PSP, DSP PSP Ulva Ulva Brown tide DSP Toxic cyanos Cochlodinium
- 23. Alexandrium red tides and paralytic shellfish poisoning (PSP) Alexandrium Saxitoxin
- 24. Saxitoxin producing Alexandrium fundyense in NY waters = cells not detected = < 100 cells L-1 = 100 - 1,000 cells L-1 = > 1,000 cells L-1
- 25. Northport-Huntington Bay PSP-shellfish bed closures across Long Island since 2006
- 26. Expansion of PSP-induced shellfish bed closures on Long Island, 2005 – 2012 Prior to 2006, Long Island had never experienced a PSP event Acres of shellfish beds closed by PSP 14000 12000 10000 8000 6000 4000 2000 0 2005 2006 2007 2008 2009 2010 Northport Bay Northport and Huntington Bay 2011 2012 Northport, Huntington, and Shinnecock Bay, Mattituck Inlet and Sag Harbor Cove Northport, Huntington, and Shinnecock Bay
- 27. Wastewater-derived nitrogen is promoting the intensity and toxicity of Alexandrium blooms. Waste water N
- 28. Samples for eelgrass genetic analyses Enhanced nutrient loading Gobler et al 2012 Cochlodinium Wallace and Gobler, sub mitted Ulva more intense &/or toxic HABs Hattenrath et al 2010 Alexandrium Hattenrath et al in prep Dinophysis Gobler et al 2011, Gobler and Sunda 2012 Brown tide
- 29. Nitrogen impacts on shellfish • Landings of clams and scallops have declined 99% since 1980. • Linkages to nitrogen driven HABs, habitat loss, and water quality degradation. Hard clam landings (bushels) in Great South Bay 800,000 700,000 600,000 500,000 400,000 300,000 200,000 100,000 2006 2004 2002 2000 1998 1996 1994 1992 1990 1988 1986 1984 1982 1980 1978 1976 1974 1972 1970 0
- 30. What impairments are brought about by excessive nitrogen loading? • • • • • • Loss of critical habitats: Eelgrass, salt marshes Low dissolved oxygen levels, hypoxia Acidification, low pH. Macroalgal blooms: Sea lettuce, Ulva Toxic algal blooms: Red tides, brown tides Loss or depletion of shellfisheries and finfisheries
Notas do Editor
- From Cuomo's 2100 commission “Tidal wetlands can protect coastal communities from storm damage by reducing wave energy and amplitude, slowing water velocity, and stabilizing the shoreline through sediment deposition. More than half of normal wave energy is dissipated within the first three meters of marsh vegetation such as cord grass. In addition, given sufficient sediment deposition, wetlands are able to build elevation in response to sea-level rise, providing a buffer against climate change and coastal submergence.” Western bay marshes protect the mainland from wave energy from almost every direction every day – if they continue to degrade it will provide less protection from erosion causing wave energy
- An “essential fish habitat” Eelgrass meadows like this one in Fire Island inlet are disappearing from Long Island’s bays