
Recomendados
Mais conteúdo relacionado
Destaque
Destaque (17)
Mais de Sascha Schlobinski
Último
Último (20)
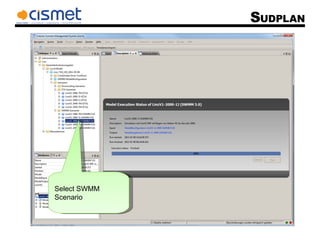
Md atr2-linz pilot current-status_swmm result scenario
- 2. Visualise SWMM Result (table)
- 3. Add metadata Visualise SWMM Result (Spatial Extent)
- 4. Select CSO in map
- 6. Show Overflow and ETA for this CSO for all Scenarios