Short term gains Vedanta stock
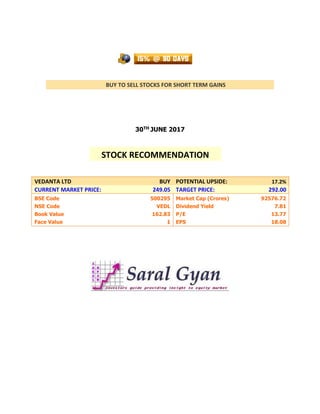
- 1. BUY TO SELL STOCKS FOR SHORT TERM GAINS 30TH JUNE 2017 VEDANTA LTD BUY POTENTIAL UPSIDE: 17.2% CURRENT MARKET PRICE: 249.05 TARGET PRICE: 292.00 BSE Code 500295 Market Cap (Crores) 92576.72 NSE Code VEDL Dividend Yield 7.81 Book Value 162.83 P/E 13.77 Face Value 1 EPS 18.08 STOCK RECOMMENDATION
- 2. 15% @ 90 DAYS – JUNE 2017 - 2 - SARAL GYAN CAPITAL SERVICES Comparative Chart (Last 1 Year) Returns: Vedanta & Nifty: Nifty: 14.3% Vedanta: 84.2% Stock Resistance and Support: 1st Resistance – 260 1st Support – 233 2nd Resistance – 276 2nd Support – 220
- 3. 15% @ 90 DAYS – JUNE 2017 - 3 - SARAL GYAN CAPITAL SERVICES Financials at a Glance: Quarterly Results of Vedanta Ltd (Rs. In Crores) Particulars Mar 2017 Dec 2016 Sep 2016 Jun 2016 Audited / UnAudited UnAudited UnAudited UnAudited UnAudited Net Sales 22,511.27 19,320.03 16,583.72 14,364.01 Other Operating Income -- 97.05 193.96 73.07 Total Income From Operations 22,511.27 19,417.08 16,777.68 14,437.08 Consumption of Raw Materials 6,550.28 6,077.58 4,864.26 5,036.20 Purchase of Traded Goods 101.02 93.77 25.29 428.7 Increase/Decrease in Stocks 126.9 -775.34 -95.3 -491.48 Power & Fuel 2,985.18 2,781.73 2,258.84 2,206.76 Employees Cost 591.28 618.83 550.75 578.48 Depreciation 1,603.69 1,520.25 1,528.85 1,492.04 Admin. And Selling Expenses -- -- -- -- R & D Expenses -- -- -- -- Provisions And Contingencies -- -- -- -- Other Expenses 4,806.52 4,740.98 4,506.46 3,238.81 Other Income 920.76 1,032.90 1,252.08 1,093.53 P/L Before Int., Excpt. Items & Tax 6,667.16 5,392.18 4,390.61 3,041.10 Interest 1,503.48 1,508.22 1,450.28 1,393.06 P/L Before Excpt. Items & Tax 5,163.68 3,883.96 2,940.33 1,648.04 Exceptional Items -114.4 -- -- -- P/L Before Tax 5,049.28 3,883.96 2,940.33 1,648.04 Tax 669.53 896.81 662.34 491.35 P/L After Tax 2,988.88 2,987.15 2,277.99 1,156.69 Prior Year Adjustments -- -- -- -- Net Profit/(Loss) 2,988.88 2,987.15 2,277.99 1,156.69 Minority Interest -- -1,118.83 -1,026.07 -541.67 Equity Share Capital 296.5 296.5 296.5 296.5 EPS 5.33 6.29 4.22 2.07 No Of Shares with Public 1,10,09,48,011 1,10,09,48,011 1,10,09,48,011 1,10,09,48,011 Public Share Holding (%) 37.14 37.14 37.14 37.14
- 4. 15% @ 90 DAYS – JUNE 2017 - 4 - SARAL GYAN CAPITAL SERVICES Basis of Recommendation: i) Technical Analysis Disclaimer: Important Notice: Saral Gyan Capital Services is an Independent Equity Research Company. © SARAL GYAN CAPITAL SERVICES This Service is provided on an "As Is" basis by Saral Gyan Capital Services. Saral Gyan Capital Services and its affiliates disclaim any warranty of any kind, imputed by the laws of any jurisdiction, whether express or implied, as to any matter whatsoever relating to the Service, including without limitation the implied warranties of merchantability, fitness for a particular purpose. Neither Saral Gyan Capital Services nor its affiliates will be responsible for any loss or liability incurred to the user as a consequence of his or any other person on his behalf taking any investment decisions based on the above recommendation. Use of the Service is at any persons, including a Customer's, own risk. The investments discussed or recommended through this service may not be suitable for all investors. Investors must make their own investment decisions based on their specific investment objectives and financial position and using such independent advisors as they believe necessary. Information herein is believed to be reliable but Saral Gyan Capital Services and its affiliates do not warrant its completeness or accuracy. The service should not be construed to be an advertisement for solicitation for buying or selling of any securities.