The document summarizes the findings of surveys of non-profits and individuals in Ohio regarding economic struggles and the social safety net. The surveys found that:
1) Non-profits saw large increases (average of 60%) in demand for services like food and shelter from 2008-2011. Many turned clients away due to lack of resources.
2) Individuals reported problems with health care, hunger, and meeting basic needs despite being employed. Over 80% of respondents earned less than $30,000 annually.
3) Both non-profits and individuals supported reforms like increasing funding for social programs, making health care more affordable, expanding job training programs, and raising eligibility levels for assistance.
1. www.policymattersohio.org
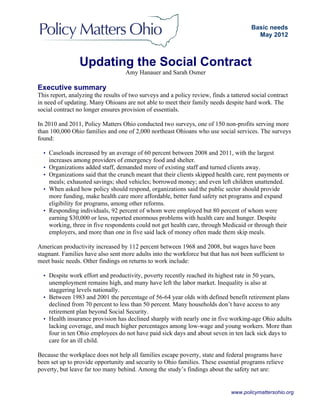
Updating the Social Contract
Amy Hanauer and Sarah Osmer
Executive summary
This report, analyzing the results of two surveys and a policy review, finds a tattered social contract
in need of updating. Many Ohioans are not able to meet their family needs despite hard work. The
social contract no longer ensures provision of essentials.
In 2010 and 2011, Policy Matters Ohio conducted two surveys, one of 150 non-profits serving more
than 100,000 Ohio families and one of 2,000 northeast Ohioans who use social services. The surveys
found:
• Caseloads increased by an average of 60 percent between 2008 and 2011, with the largest
increases among providers of emergency food and shelter.
• Organizations added staff, demanded more of existing staff and turned clients away.
• Organizations said that the crunch meant that their clients skipped health care, rent payments or
meals; exhausted savings; shed vehicles; borrowed money; and even left children unattended.
• When asked how policy should respond, organizations said the public sector should provide
more funding, make health care more affordable, better fund safety net programs and expand
eligibility for programs, among other reforms.
• Responding individuals, 92 percent of whom were employed but 80 percent of whom were
earning $30,000 or less, reported enormous problems with health care and hunger. Despite
working, three in five respondents could not get health care, through Medicaid or through their
employers, and more than one in five said lack of money often made them skip meals.
American productivity increased by 112 percent between 1968 and 2008, but wages have been
stagnant. Families have also sent more adults into the workforce but that has not been sufficient to
meet basic needs. Other findings on returns to work include:
• Despite work effort and productivity, poverty recently reached its highest rate in 50 years,
unemployment remains high, and many have left the labor market. Inequality is also at
staggering levels nationally.
• Between 1983 and 2001 the percentage of 56-64 year olds with defined benefit retirement plans
declined from 70 percent to less than 50 percent. Many households don’t have access to any
retirement plan beyond Social Security.
• Health insurance provision has declined sharply with nearly one in five working-age Ohio adults
lacking coverage, and much higher percentages among low-wage and young workers. More than
four in ten Ohio employees do not have paid sick days and about seven in ten lack sick days to
care for an ill child.
Because the workplace does not help all families escape poverty, state and federal programs have
been set up to provide opportunity and security to Ohio families. These essential programs relieve
poverty, but leave far too many behind. Among the study’s findings about the safety net are:
Basic needs
May 2012
2. Updating the Social Contract
www.policymattersohio.org2
• Cash assistance helps some poor families, but many fewer than in the past. About three in four
poor Ohio children lived in a family that got no cash assistance in 2008. General assistance, the
program that once provided help to desperately poor adults with no children, no longer exists.
• The supplemental nutritional assistance program provides very low-income households with a
modest $1,100 average per year to purchase food. A family of three earning $23,801 or more
does not qualify, but last year the program helped one in seven Americans, the highest share on
record. An additional program provides a modest $33.52 average per month to poor infants and
pregnant mothers at risk of malnutrition. Last year Congress tried to slash both programs.
• Childcare is costly – center-based infant care would consume more than one-third of a median
single parent’s income in Ohio. About 51,000 Ohio children were helped through a federal
program, and about the same number got help through a state program. This enables parents to
work and improves care quality, but federal and state cutbacks mean fewer will be eligible and
overall funding will be reduced.
• In Ohio, a little over half a million workers are unemployed, with long-term unemployment
levels reaching a sixty-year high in 2011. Unemployment insurance kept more than three million
Americans out of poverty in 2009, while stabilizing communities and reducing a downward
spiral in our economy. This program, too, is under threat at the federal level.
• Unlike nearly every other industrialized democracy, the United States does not provide universal
health coverage and tens of millions of Americans are uninsured as a result. Medicare covers
elderly and some disabled Americans, while Medicaid covers many of the poorest and of those
who private companies exclude because of disease or disability. The Affordable Care Act will
expand Medicaid, allow business and individuals to purchase insurance through an exchange,
charge employers who don’t provide coverage and eliminate some coverage denials. This
represents an unusual expansion of the social contract at a time when many parts of the contract
are under threat.
• Social Security lifts 859,000 Ohioans out of poverty and has turned old age from the time of life
when poverty was most likely to the time of life when it is least likely.
• The U.S. does not have a solid federal housing policy. Federal housing assistance peaked in 1978
and provides half what it once did in assistance. Ohio, with one of the nation’s most vibrant
housing trust funds, does better than many states in this area, but many are still left behind.
Much of the way that we provide security and assistance to families is through the tax code, but that
assistance is skewed toward the upper middle class and wealthy. The home mortgage deduction costs
the U.S. treasury $103.7 billion a year and provides more assistance to those purchasing more
expensive homes. Deductions for retirement savings cost $108.2 billion annually and are of greater
assistance to upper middle-income and high-income earners who can afford to save more. The
Earned Income Credit, targeted toward poor and moderate-income working families, costs just $55.1
billion a year. This credit helps working families and is now the nation’s largest poverty relief
program, lifting 6.5 million working families out of poverty each year.
In all, our survey found that Ohio families are struggling despite working and our review of policy
found deep retrenchments in the social contract. If American families are to meet their own needs, we
will have to ensure that either work or policy does more to bring about opportunity and security.
3. Updating the Social Contract
www.policymattersohio.org3
I. Introduction
In 1934, at least 50 percent of the elderly in America did not have enough income to support
themselves, according to estimates.1
Fast forward more than 75 years, and the nationwide poverty
rate among the elderly is now below 9 percent.2
What happened? In part, America’s economy grew
steeply over this period and we became a much wealthier nation. But not all social ills were so well
controlled by the growth in our economy. The incredible progress on elderly poverty occurred
because we decided, as a nation, to set up a strong structure to address poverty among older adults.
We passed the Social Security Act, which ensured that Americans who worked and their spouses
would be supported after retirement. Thirty years later, we strengthened it with the passage of
Medicare, which helped ensure that retirees’ medical expenses would be covered.
During this country’s worst economic crisis on record, Americans acknowledged the shortcomings of
the traditional sources of economic security, such as “assets, labor, family, and charity,” and
demanded a government response.3
Business, government, workers and citizens worked together to
create a social contract that would better ensure lifelong relief from poverty for Americans. We
always liked wealth building, but for much of the twentieth century we used some our substantial
wealth to do a better job of providing for most Americans’ well being. The workplace was always
envisioned as the main source of support. For many workers, wages or salaries were complemented
by employer-provided health insurance and employer-provided retirement plans that often offered
defined benefits for as long as workers lived. But where support through the workplace fell short,
Americans created Social Security and later Medicare for retirement security; cash, food and health
assistance for poverty defense; and other strands in a safety net that was never perfect, but that
increased opportunity and security for our families.
Over the last thirty years however, workers have been exposed to great vulnerability as jobs have
been lost and employers have discarded benefits, or forced employees to contribute at rates they
cannot afford. On the government side, many programs have been weakened and in some cases
dismantled, forcing families to rely upon charity to make ends meet.4
The notable exception is the
Earned Income Credit, which has expanded and provides substantial assistance to many working
families with children, and the Patient Protection and Affordable Care Act, which hasn’t been fully
implemented but will expand an important part of the safety net.
Despite the weakened social contract, our public supports continue to sharply reduce poverty, do
much to enable that people get health care, assist in purchasing necessities, help out when work is not
available or possible, and in other ways enable our communities to function. One in six Ohio
residents receives Social Security. The program is best-known for assisting retirees and their spouses,
but also helps some with disabilities and some survivors whose wage-earning parent or spouse died.
Social Security lifted 859,000 Ohio residents (including 47,000 children) out of poverty, on average,
1
Social Security Administration, Historical Background and Development of Social Security, available at
http://www.ssa.gov/history/briefhistory3.html.
2
U.S. Census Bureau, Income, Poverty and Health Insurance in the United States: 2009 – Highlights:
http://1.usa.gov/cikdtw (between 2008 and 2009, the poverty rate among those age 65 and above dropped from 9.7
percent to 8.9 percent).
3
Social Security Administration, supra note 1.
4
See section on the increased demand for social services.
4. Updating the Social Contract
www.policymattersohio.org4
each year from 2007 to 2010.5
And in the midst of the deep slump in 2011, the federal Supplemental
Nutrition Assistance Program provided a lifeline for nearly one in six Ohioans.6
During and after the Great Depression, policymakers realized that for American business and workers
to thrive, we needed to make sure that our growing prosperity included working people. Many
business leaders understood that they needed well-educated workers and therefore needed a strong
public school system. They also knew that if they wanted workers to take jobs where they could be
laid off or there was a risk of being injured, such as in manufacturing and the skilled trades, then
there had to be protection against unemployment and injury. Out of that recognition grew our
unemployment and workers’ compensation systems. Many employers decided that if they wanted
peaceful and profitable workplaces and a good customer base, they had to share some of the growing
prosperity with the workers who were producing that wealth. Throughout the middle of the twentieth
century, in the U.S. and in Ohio, broadly growing prosperity translated into broadly rising living
standards and increased well being and security for families across the income range. While
inequality existed – indeed often exceeded levels in other advanced industrialized countries – it was
still the case that poor and wealthy families alike were seeing income growth. The social contract
always worked best for educated white male workers, but many Ohio families were able to enjoy
growing wages, health insurance, and retirement security when they were working and to be buoyed
by unemployment compensation and the social safety net if they lost their jobs.
This paper examines the strengths and weakness of our current social contract, how it compares to the
social contract of the past, and how we can ensure that the combination of public systems and private
employment can lift families and communities to a stable life free from poverty. The first section,
below, reviews the results of two surveys conducted in northeast Ohio. The second large section
reviews the portion of well-being that is delivered through the labor market and how that has changed
over time, homing in on wages, health insurance, retirement, sick days, medical leave, and labor law
enforcement. The third large section looks at how the public sector was tapped to provide some of
what the labor market didn’t, including cash assistance, elderly assistance, health care for some, food
assistance, unemployment insurance and some help with housing and child care – we examine, too,
how these have changed over time. The fourth main section explores how we deliver much assistance
through the tax code and how we might be surprised at who benefits most from that help.
II. Non-profits and clients speak out
To better understand the impact of the economic downturn on Ohio nonprofits and the clients they
serve, Policy Matters conducted two surveys over the course of the past year – one of non-profit
leadership and one of clients.
Nonprofit Survey
The nonprofit survey sampled 150 health and human service nonprofits located in Northeast Ohio
between September 2010 and January 2011. In total, the nonprofits that were surveyed assist more
than 100,000 individuals or families a year. The survey yielded a response rate of approximately 33
percent. Figure 1 below displays the diversity of the respondent organizations, many of which serve
multiple needs in the community.
5
National Women’s Law Center, Social Security: Vital to Ohio Women and Families, (visited June 22, 2011).
6
The Wall Street Journal, Real Time Economics Blog, May 31, 2011, Share of Population on Food Stamps Grows in
Most States, available at http://on.wsj.com/laExlP.
5. Updating the Social Contract
www.policymattersohio.org5
These entities have long been part of the fabric of social life in northeast Ohio. Between 2008 and
2011 most of these nonprofits saw enormous increases in their caseloads. While on average caseloads
increased 60 percent, organizations that provide emergency food and housing assistance saw the
greatest increase in demand for their services, with caseloads expanding 50 to 300 percent. The
survey confirms that emergency food banks are increasingly becoming a lifeline for clients in need.7
Nonprofits indicated that when clients lose eligibility for public programs, most seek help from food
pantries and food banks and some turn to shelters and religious institutions.
Most organizations coped with greater community need by adding staff, demanding more of existing
staff, or increasing programs. However, some nonprofits were forced to limit or ration services, and
some organizations provided services at a loss. The majority of respondents indicated that
government funding in various forms has been the most helpful public sector response. Others
reported that government assistance in the form of delivery systems, such as the Benefit Bank and
food pantries, has been helpful. However, respondents overwhelmingly agreed that funding cuts have
been the most problematic government reaction.
7
See Dave Davis, “Calls to 2-1-1 help agency up by 11 percent,” The Plain Dealer, January 25, 2011,
http://blog.cleveland.com/metro/2011/01/record_numbers_of_suburban_res.html.
Figure 1
What is the focus of your organization?
(select all that apply)
Source: Policy Matters survey of northeast Ohio non-profits
0
5
10
15
20
25
30
6. Updating the Social Contract
www.policymattersohio.org6
The survey also sheds light on the ways that clients who depend on social services cope during an
economic downturn. The results demonstrate the desperate situations that individuals and families are
facing. When asked how their clients manage if they unable to make ends meet, the nonprofits
indicated that the individuals and families they serve are likely to:
• Miss rent or mortgage payments;
• Forego health care;
• Borrow money or incur debt;
• Skip meals;
• Do under-the-table work;
• Spend savings;
• Leave children without child care;
• Break the law;
• Get rid of a vehicle.
According to our survey, organizations support a variety of policy changes for their clients.
As Figure 2 indicates, nonprofits favor improved healthcare affordability, increased funding of safety
net programs, workforce development and training, and more. Because the question was open-ended,
respondents chose a range of answers, but the answers nonetheless coalesced around better funding.
Figure 2
What policy change would help your clients?
Source: Policy Matters survey of northeast Ohio non-profits
0
2
4
6
8
10
12
Improvinghealthcare
affordability
Retainingorincreasingfunding
forsafetynetprograms
Moreprogramsforworkforce
developmentandtraining
Increasingprogrameligibiltyto
covermorefamilies
Increasinghousing/rental
assistancesubsidiesthatcover
thecostofliving
Extendingtimeforpeopleon
benefits
Moreprogramsthathelp
familiestransferfromassistance
tobeingontheirown
Increasedprotectiontothemost
vulnerablepopulations
Increasingchildcareassistance
paymentsandavailability
Moreempowermentprograms
Strongerconsumerprotections
Bettertransportationroutesand
assistance
7. Updating the Social Contract
www.policymattersohio.org7
Client Survey
To flesh out what non-profit leaders were saying, in 2011 Policy Matters asked the Cleveland Sight
Center to help survey 2,000 clients of three northeastern Ohio nonprofits that provide housing,
financial, and tax counseling to low-income families.8
The survey asked the clients about their work,
wages, benefits, and how they have weathered the recession.
The results demonstrate the extent to which the economic downturn has impacted low-income
families. These were largely working families – only 8 percent of respondents said they were
unemployed. Nonetheless, nearly a third of respondents lost a job during the previous year, and more
than two-thirds reported that their hours, wages, or tips were reduced during that time. These
households were living on modest incomes – about 80 percent of the respondents said they earned
$30,000 or less. Although they were struggling financially, respondents had made efforts to be
financially secure. Of those who responded, nearly all had a high school degree or GED. Nearly 30
percent had some college education or an associate’s degree, and 17 percent indicated that they had a
four-year degree.
One of the biggest problems revealed by the survey was inability to access health insurance. Even
though 92 percent of respondents were employed, only about one in five had health insurance
through their employers. About another one in five got coverage through Medicare/Medicaid. Some
purchased private insurance, despite their modest incomes, but more than 40 percent of the
respondents said they did not have adult health insurance, and 36 percent indicated that the children
in their household did not have health coverage.
The survey found that health care costs were rising and that costs were a barrier to getting the
medication that patients were supposed to take. A substantial majority said they had not filled
prescriptions because they lacked money, and about half said their health care costs had increased.
Some families are leaning on free clinics and emergency rooms to meet healthcare needs; 14 percent
said they had used a free clinic in the past, and over a third of respondents said they used urgent care
or an emergency room.
A smaller but still alarming percentage of respondents faced issues with food security. More than one
in five respondents reported that they often skipped meals or went hungry because there wasn’t
enough money to buy food. More than 25 percent of respondents relied on family or friends for free
food because they did not have money to purchase food. Some reported that they could not access
government assistance – 11 percent said they needed food assistance but did not qualify. Only 18
percent of respondents were currently on food assistance/stamps, and 17 percent were referred to
agencies for free food.
With regard to finances, the survey sheds light on challenges families face in building assets and
saving for the future. More than 75 percent of the respondents had a checking account, savings
account or both. However, a majority of respondents also indicated that they relied on a payday loan
or a check-cashing service during the previous year. Saving money was a priority for nearly a third of
respondents, who said they put money into a savings account during the past year, and 18 percent
indicated they would like a savings plan with resources and tips on saving money. However, when it
8
Response rates ranges from 17 to 38 percent depending on the question, with an average response rate of 23 percent.
8. Updating the Social Contract
www.policymattersohio.org8
comes to saving for retirement, only 4 percent said they put money into retirement savings. And
nearly half (44 percent) of respondents said they have “overwhelming debts.”
The survey revealed that a large majority of the respondents had filed taxes previously, with almost
half indicating that they had their taxes prepared at a free tax site. Among those who took advantage
of the free services and obtained a refund, one in five reported saving the money. Over half used the
credit to pay utility, credit card and other bills. One in four used the refund to pay rent or a mortgage,
and nearly a quarter reported that they used the money for food.
The northeast Ohio surveys of clients and non-profit organizations confirm that low-income families
need the services that the public and non-profit sectors provide. Many families can’t find work, as
large public surveys show, but even those who are working are not consistently able to meet their
families’ needs through their workplace compensation and benefits. But the surveys also reveal a
social contract that is badly frayed – while families, including working families, need help with
health insurance coverage, housing, food costs and other essentials, they are not always able to get it.
Not-for-profit organizations have doubled and sometimes tripled what they are trying to do, but it is
not sufficient. This paper now turns to examining how compensation and safety net programs have
changed and what it has meant for families in Ohio and the U.S.
III. Working our way out of poverty
Americans place a high value on work. In 2003, 73 percent of Americans polled said that work was
“extremely important” or “very important” in their life, ranking higher than friends, money, or
religion.9
Across much of the political spectrum, 61 percent of Americans said they would continue
working even if they won $10 million in the lottery.10
Good jobs should provide a living wage and employment-based benefits that enable family security.
If we had full employment in high-quality jobs, the need for much of the safety net would go away.
However, many Ohio families are unable to obtain work or do not earn sufficient wages and benefits
to support themselves and their families.
There are two large problems with the notion that families should support themselves through work
alone however. The first is that we have never had universal employment in this country. Even in
what is considered the best economic times, official unemployment typically remains above 4
percent.11
In recessions and recoveries, official unemployment can be much higher. Unemployment
has fallen in 2012, a welcome trend, but 7.5 percent of Ohioans remained unemployed in March
2012, with rates much higher if we include those who have stopped looking. The second problem is
that many jobs do not pay enough for a worker and a family to escape poverty or attain security. And
increasingly jobs fail to provide health insurance, pension coverage and contributions to the other
parts of compensation needed for a secure life.
9
Gallup News Service, Family, Health Most Important Aspects of Life, January 3, 2003, http://bit.ly/JFyqkd.
10
Gallup News Service, Work and Workplace, August 8-10, 2005, http://bit.ly/IV9hD9.
11
The national unemployment rate was 4.6 percent in July 2007 before the recession began and 4.3 percent in March
2003 before the previous recession. See Center for Budget and Policy Priorities, Chad Stone, et. al. “Addressing
Longstanding Gaps in Unemployment Insurance Coverage,” August 7, 2007, http://bit.ly/KYJaHA.
9. Updating the Social Contract
www.policymattersohio.org9
Wages
While worker productivity has increased 112 percent since the minimum wage was enacted in 1968,
wages have not kept pace.12
In fact, over the past 30 years, the United States has gone from a country
where everyone saw income grow to a country where the very top of the income ladder has benefited
the most while the typical workers’ wages have stagnated. Figure 3 below shows how the bottom 90
percent of earners and the top 1 percent saw roughly comparable income growth between 1946 and
the late 1970s in percentage terms. Beginning in the 1980s, however, the figure shows that earnings
of the top 1 percent shot up exponentially, at rates sometimes exceeding 300 percent annually, while
earnings of the bottom 90 percent stayed roughly the same.
Figure 3
Uneven distribution of gains contrasts with earlier era,
when growth was widely shared
Source: Center on Budget and Policy Priorities
The result of this and other problems is that Ohio poverty was reported at a 30-year high of 15.3
percent in 2010.13
Ohio’s unemployment rate has improved in 2012 but remains troubling.14
Both the
unemployment and the poverty rates are to some degree the result of our current weak economy. But
other disturbing trends, like our dramatically growing inequality, continue through recessions and
recoveries. Figure 4 shows how extreme inequality is on a national level when we separate out the
12
Economic Policy Institute, “Fix it and Forget it,” December 19, 2009, http://bit.ly/K35HDA.
13
“Ohio poverty at more than a 30-year high, census numbers show,” September 14, 2011, Associated Press story on
Cleveland Plain Dealer blog: http://bit.ly/IQUokd.
14
Ohio jobs data sends mixed messages for March, April 20th
, 2012, Policy Matters Ohio http://bit.ly/IaA7RS.
10. Updating the Social Contract
www.policymattersohio.org10
very top earners. In 2009, the bottom 90 percent of families earned only $31,000 on average, the top
1 to 10 percent of families earned $164,647 on average, and the top 1 percent earned $1,137,684.
Beyond that point, inequality spiked even more astronomically, with the top .01 to .1 percent earning
more than $3 million on average and the top .001 percent earning a mind-boggling sum in excess of
$27 million a year.
Figure 4
Average income per family
Source: Mother Jones, It’s The Inequality, Stupid,
http://motherjones.com/politics/2011/02/income-inequality-in-america-chart-graph
Ohio follows, to a much lesser extent, the nationwide trend of increasing inequality, although data on
the very top earners at the state level is not available. Still, available data shows that the state’s
richest 20 percent of families have average incomes over six times that of the poorest 20 percent.
Between the late 1980s and the mid-2000s, the richest 5 percent of families saw average income
increase by $2,599 annually, compared to the poorest fifth of families only experiencing an average
income increase of $112 per year.15
In short, despite overall economic growth, many working people have seen stagnant or falling wages
and many are unable to find work at all. Increases in costs for necessities like health insurance, child
care, and care for the elderly have meant that incomes go less far than they used to for housing and
the essential services, like child care, elder care and health care, that today’s sandwich generation
needs. While wages have been stagnant, benefits through the workplace have often worsened and
15
Center on Budget and Policy Priorities, Fact Sheet, Ohio: Income Inequality Grew in Ohio Over the Past Two Decades,
http://www.cbpp.org/cms/index.cfm?fa=view&id=2716, April 2008.
11. Updating the Social Contract
www.policymattersohio.org11
economists have discussed a “new normal” in which higher unemployment levels are likely to persist
longer into recoveries.
Some argue that employers should be held to a higher standard and should provide workers with
reasonable wages and benefits. Others instead say that the public sector should intervene and ensure
that Ohioans can get the income and benefits they need if they are working or trying to work. What is
clear is that the shredded safety net combined with lower employer expectations have combined in a
way that leaves Ohioans too vulnerable.
Labor laws
Over thirty percent of American workers are contingent workers – temporary workers, self-employed
or independent contractors – and as a result are not protected by labor laws, such as the Fair Labor
Standard Act and Employee Retirement Income Security Act.16
This means they can be left out of
benefits, regulations and safety net programs including unemployment insurance, workers’
compensation, overtime, vacation, minimum wage, health and safety regulations, family and medical
leave, and Social Security.
Employers trying to reduce costs and evade taxes deliberately misclassify many workers. By
misclassifying workers, these employers avoid paying full taxes, and avoid contributing to workers
compensation and unemployment. Worker misclassification deprives the unemployment insurance
system of an estimated 7.5 percent of its revenue each year.17
When these workers get injured or lose
their jobs, they are not eligible for the benefits that appropriately classified workers can claim.
Even properly classified workers are sometimes not fully protected under the law. Most labor
enforcement is based on a complaint system rather than an audit system, which places the burden on
the worker to report violations. Many workers are not willing to report violations for fear of
retaliation or losing their jobs. Government studies have found that between 50 and 100 percent of
employers in the garment, nursing home and poultry industries are in violation of work wage and
hour laws.18
Ohio has just six wage and hour investigators on its state staff – less than one
investigator for every 728,000 Ohio private-sector workers.19
Retirement
In 1983, 70 percent of employees age 56-64 had defined benefit retirement plans, which are plans
where the employer pays the employee a fixed amount, no matter the status of the market.20
By 2001,
less than half of employees in the same age group had this type of retirement plan. Instead, many
employers now avoid paying retirement benefits of any kind, or instead use defined contribution
retirement plans. With defined contribution plans, employers and employees can contribute to a
retirement plan, but there is no guarantee that benefits will be sufficient – it depends on how much is
put in, the performance of the stocks in which funds are invested, and the strength of the stock market
16
New America Foundation, Lauren Damme, The Vulnerable American Worker, July 2010, http://bit.ly/JAGOPx
(visited July 11, 2011).
17
New America Foundation, supra note 29 at 4.
18
Id.
19
Halbert, Hannah, Policy Matters Ohio, Shrinking employment law enforcement funding raises risk of wage theft, June
2011 and follow up interview, February 2012.
20
Economic Policy Institute, EPI Issue Brief, Shifting Risk: Workers Today Near Retirement More Vulnerable and with
Lower Pensions, July 21, 2005, available at http://www.epi.org/publications/entry/ib213/.
12. Updating the Social Contract
www.policymattersohio.org12
at the time of withdrawal. The risk shifting places families at risk of losing significant retirement
funds if they need to retire at a market low point.
In 2007 only 60 percent of family heads of households had access to a job-related pension or
retirement plan, and of those, only 55 percent were taking advantage of the plan.21
This means
roughly half of the American workforce lacks access to an employer-based retirement plan and fewer
than a third are able to use those plans. It is even worse for young and part-time workers: In 2009,
less than half of young or part-time workers had retirement plans at work.22
Health insurance
Health insurance is another necessity that has been largely tied to employment in the United States.
While Americans are expected to rely on employers for health insurance, in the last three decades the
number of employers that offer insurance has dropped sharply. 23
In 1980 over 70 percent of Ohioans
had private insurance from an employer; by 2011, only 57 percent had health insurance through their
jobs.24
The result is that in 2010, nearly one in five working age adult Ohioans were uninsured.
Low-wage workers, those least able to purchase private insurance, face especially large barriers.
According to the U.S. Department of Labor, only a quarter of low-wage earners had access to
medical benefits in 2009, compared to 70 percent of all private-sector workers.25
Growing insurance
costs make it increasingly unattainable for lower-income families. Indeed, in 2010 the average cost of
a family insurance plan was $13,770, and the average worker’s share of the premium increased to 30
percent (more than $4,000).
Young workers also face significant barriers to obtaining health insurance. In a 2009 survey, 31
percent of young workers were uninsured, up from 24 percent in 1999. Of those without health
insurance, nearly half said that they were uninsured because they could not afford their employer’s
policy, and 31 percent reported their employer did not offer health insurance.26
The situation will improve substantially once the healthcare reform’s Affordable Care Act takes
effect in 2014. According to the Congressional Budget Office, by 2021 about 95 percent of legal
nonelderly residents will have insurance (compared to about 82 percent without the legislation).27
The new law will enable individuals and employers to purchase insurance from health exchanges,
will eliminate exclusion from coverage based on health status, and will assist more low and
moderate-income families in paying for coverage. This is a rare step forward in an era of
retrenchment for the social contract.
21
The White House Middle Class Task Force, February 2010, Annual Report of the White House Task Force on the
Middle Class, www.whitehouse.gov/sites/default/files/microsites/100226-annual-report-middle-class.pdf
22
www.aflcio.org/aboutus/laborday/upload/laborday2009_report.pdf
23
2010 Kaiser Family Foundation, The Uninsured: A Primer, at http://www.kff.org/uninsured/upload/7451-06.pdf.
24
The Ohio Health Family Survey, Key 2010 OFHS Findings, available at http://bit.ly/JqAREa.
25
U.S Department of Labor, Bureau of Labor Statistics, at http://www.bls.gov/news.release/ebs2.nr0.htm.
26
AFL-CIO Working America, “Young Workers: A Lost Decade,” at http://bit.ly/LgaVgK.
27
CBO Analysis of the Major Health Care Legislation Enacted in March 2010, Congressional Budget Office, Testimony
before Subcommittee on Health Committee on Energy & Commerce, U.S. House of Representatives on March 30, 2011.
13. Updating the Social Contract
www.policymattersohio.org13
When workers get sick
Many workers do not have access to paid sick days. The U.S. only guarantees medical leave in
accordance with the provisions of the Family Medical Leave Act. This leave is unpaid, in contrast to
the policy in the 163 countries that have some form of paid sick leave for workers.28
In Ohio, 42
percent of employees do not have paid sick days, leaving 2.2 million Ohio workers who must work
when ill or forego pay. Adults in families with children substantially increased their hours of work
over the past generation, making it more likely that a sick child does not have a stay-at-home parent.
Yet access to paid sick days has not increased and only 30 percent of workers can use paid sick days
to care for sick children. This means more than 3.55 million Ohio workers would have to forego pay
to care for a sick child.29
In addition to the costs to working families, this has larger societal costs. Workers forced to work
when ill can spread illness and put customers at risk, particularly in the restaurant industry. In one
instance, a Chipotle restaurant employee in Kent, Ohio, who had norovirus ended up infecting over
500 people, costing the community between $130,000 and $300,000.30
Adults without paid sick leave are more likely to use emergency rooms than standard doctors’ offices
because the ER operates during non-work hours. One study on the costs of unpaid sick leave noted
that in 2006, “nearly 4.4 million hospital admissions in the U.S., totaling $30.8 billion in hospital
costs, could have been prevented with timely and effective ambulatory care or adequate patient self-
management of the condition.”31
IV. Public sector steps in
As outlined above, work in America is not enough for many workers. Our work-based system leaves
us with outrageous inequality, high levels of poverty amid plenty, low levels of health insurance
coverage, substantial numbers who lack retirement income, inadequate income even during work
years to meet needs for many families, and no assurance of security when illness hits. Because of
those inadequacies of the labor market, we have used public policy and public budgets to try to assist
families. The social contract that was established was meant to have public policy provide necessities
that employment couldn’t or didn’t provide.
A combination of state and federal programs provide opportunity and security for Ohio families. A
key part of that is a safety net to help Americans who don’t earn enough through work to meet basic
needs. This section assesses the strengths and weaknesses of these programs. As an overview, the
strength of these programs is that they pull people out of deep poverty and provide necessities that
families wouldn’t otherwise get. The flaw with many of these programs is that they sometimes
provide only the bare minimum, often are not available to everyone who needs them, and have
remained at a very modest level, even as our economy has grown dramatically. In some cases, despite
a growing overall economy, these programs have become more restrictive and stingier.
28
Economic Policy Institute, Access to Sick Days is Vastly Unequal, available at http://bit.ly/e9blJ1.
29
Hanauer, Amy, A Healthy Standard: Paid Sick Days in Ohio, Policy Matters Ohio, 2007
30
Policy Matters Ohio, Outbreak in Ohio: Cost of the 2008 Norovirus Incident in Kent: http://bit.ly/ILtfAk.
31
Gould, Elise, Kai Filion, and Andrew Green, “The Need for Paid Sick Days,” Economic Policy Institute, June 29, 2011,
www.epi.org/publications/entry/7247/.
14. Updating the Social Contract
www.policymattersohio.org14
Cash assistance
For some of the poorest Ohio families with children, Ohio provides cash assistance. However, in
2008 only about one-fourth of Ohio’s poor children lived in a family that received cash assistance.32
The program is important in providing basic income to some of the neediest Ohio families, but it
leaves 74 percent of poor children to survive without cash help beyond their poverty-level family
earnings. Because of job loss and dramatic increases in poverty in Ohio, the state’s cash assistance
caseload was third largest in the nation with an average of 102,446 families receiving assistance
during the 2010 fiscal year – an increase of more than 30 percent over the level three years before.33
However, participation in cash assistance did not rise as much during the 2009-2011 slump as it had
in previous recessions, in large part because restrictive program requirements rendered families
ineligible despite needing assistance.
Cash assistance is considerably less common and more restrictive now than it used to be. Prior to
1996, individuals and families living in poverty were entitled to cash assistance under Aid to Families
with Dependent Children (AFDC). However, in 1996 Congress eliminated AFDC and replaced it
with Temporary Assistance for Needy Families (TANF). TANF eliminated cash assistance as an
entitlement and instead provided a block grant to states.34
Congress placed a 60-month lifetime limit
on federal assistance, but allowed states to provide extensions for up to 20 percent of caseloads.35
The TANF program also requires participant engagement in “work activities.” Benefits are now tied
to employment or school enrollment. However, many poor families can’t find jobs. This leaves many
households without government assistance and without jobs. Nationally in 2010 there were 1.3
million single mothers who were both jobless and without any cash assistance.36
According to the Center on Budget and Policy Priorities, some of these families face barriers to
employment, including disabilities, children with disabilities, or lack of transportation or childcare.37
In this economic climate, even those without barriers to employment face problems meeting work
requirements. In 2011, only 23 percent of Ohio TANF recipients were engaged in work activities, the
lowest rate since 1997. A spokesperson for the Ohio Job and Family Services Directors’ Association
attributed this to the recession, which has eliminated jobs.38
Making matters worse for working
families, county funding cuts have forced layoffs and eliminated programs that provide education and
job training, meaning that fewer recipients are getting the resources they need to obtain the limited
number of jobs that are available.
32
According to the Ohio’s Kids Count 2010 Data Book, the American Community Survey found that there were 496,890
Ohio children living in poverty, but only 132,601 receiving cash assistance in 2008. This differs from the number later in
this paragraph both because the years differ (2008 vs 2010) and because this number measures children and the 2010
number measures families, some of which have more than one child.
33
Id.
34
U.S. Department of Health and Human Services, supra note 8.
35
CLASP, TANF Policy Brief: Cash Assistance Since Welfare Reform, January 21, 2011, http://bit.ly/eXJFNj.
36
Ibid.
37
The Center on Budget and Policy Priorities, “Policy Basics: An Introduction to TANF,” available at
http://www.cbpp.org/cms/index.cfm?fa=view&id=936&saved=1.
38
Catherine Candisky, “Welfare-to-Work Faltering in Ohio: State Fined $136M for Failing to Find Jobs for Enough Aid
Recipients,” The Columbus Dispatch, May 22, 2011, http://bit.ly/LR1x5X.
15. Updating the Social Contract
www.policymattersohio.org15
Ohio also lacks sufficient funding to meet increased demand during this weak economy. As the state
faces an increase in caseloads, drastic funding cuts are pending. For example, the Montgomery
County Department for Child and Family Services (which administers Ohio Works First funds)
received $17.2 million in TANF funds in 2009 but despite increased demand was projected to receive
less than half of that by 2013.39
Ohio no longer provides cash assistance to adults without children if they don’t qualify for
unemployment compensation. General assistance, once provided to needy single adults without
children, was abolished in 1995. At that time, the New York Times reported on previous reductions in
general assistance (but not outright elimination) that, “researchers in Ohio and elsewhere have
concluded that most former recipients simply totter on the edge of subsistence. With few job skills,
and often with disabilities and addictions, they somehow just manage to get by, frequently with the
help of the underground economy, family members and friends.”40
Food
Some may find it hard to believe that Americans skip meals, go hungry, or suffer from malnutrition,
but they do. Now that cash assistance is time-limited and comes with work requirements, there are
families in Ohio and the U.S. that have no cash income at all. The Supplemental Nutritional
Assistance Program (SNAP), formerly the food stamp program, is the main way that the public sector
tries to ensure that very poor families don’t go hungry, even if they don’t get cash assistance. This
program provides low-income households with modest benefits to purchase food at authorized stores:
in 2009 the average annual food stamp payment in Ohio was $1,105.41
The program is administered
through the U.S. Department of Agriculture and state agencies determine eligibility and distribute the
benefits via a card similar to a debit card. To qualify, a family of three must earn less than $23,800.
During the deep slump of the past three years, SNAP, modest as it is, has been increasingly relied
upon as a safety net. Last year one in seven Americans was receiving SNAP, the highest share of the
U.S. population on record, due in part to easing of eligibility guidelines, but also because of the
weakened economy.42
Ohio has seen similar increases: According to USDA data, the average
monthly participation in SNAP in Ohio “grew 44 percent to 1.66 million people in 2010 from 1.15
million in 2008.”43
As of June 2011, a quarter of residents in 70 of Ohio’s 88 counties were eligible
for food assistance.44
The economic crisis stretched to suburbs: In Cuyahoga County the use of food
stamps increased more than 20 percent in 22 suburbs between 2008 and 2010.45
39
Joanne Huist Smith, “State Cuts, Soaring Need Cut into Services for Young, Old and Poor,” Dayton Daily News,
March 28, 2011, http://bit.ly/fPGzch.
40
Sack, Kevin, “Trying to Cut Welfare the Ohio Way”, The New York Times, April 3, 1995.
41
U.S. Department of Agriculture, Frequently Asked Questions about the Supplemental Nutrition Assistance Program, at
www.fns.usda.gov/snap/faqs.htm#1.
42
Food Research and Action Center (FRAC), SNAP/Food Stamp Monthly Participation Data, February 2011,
http://frac.org/reports-and-resources/snapfood-stamp-monthly-participation-data/ (visited June 23, 2011).
43
Cornelius Frolik, “U.S. loses $300M a year to food stamp fraud,” Dayton Daily News, May 11, 2011
http://bit.ly/Ju2rDA.
44
Politifact, “Rep. Dennis Kucinich says one-quarter of residents qualify for emergency food in 70 of Ohio's 88
counties,” The Plain Dealer, June 1, 2011, http://bit.ly/oUdFAd (visited June 27, 2011).
45
Margaret Bernstein, “Cleveland Food bank Surpasses its 2011 Harvest for Hunger goal by 1 Million Meals,” The Plain
Dealer, June 9, 2011, http://blog.cleveland.com/metro/2011/06/cleveland_foodbank_surpasses_i.html.
16. Updating the Social Contract
www.policymattersohio.org16
In many ways the SNAP program is a success. Unlike TANF, which is funded through block grants
to states, the SNAP program is funded through the Farm Bill, which means the program can expand
to meet increased need.46
Additionally, unlike other safety net programs, it is not tied to employment
status, which means that, working or not working, families in need can obtain some assistance with
SNAP benefits. The current caseloads reflect this difference; the TANF program caseloads increased
13 percent from December 2007 to December 2009, whereas SNAP caseloads expanded by 45
percent.47
SNAP’s expansion better reflects the increase in poverty and need during this recession.
Despite the strength of the SNAP program as a vital safety net for workers, the eligibility levels are
quite low, and the benefits paid are small. Even so, the U.S. House of Representatives last year
passed a proposal that would have reduced funding for the program by almost 20 percent and
converted it to block grants to states. The proposal did not become law but its passage in the House
gives a sense of how vulnerable the program is.48
The SNAP program staves off hunger but provides just $1,100 per recipient per year on average, and
cuts off eligibility at around $23,800 for a family of three. Pregnant women, infants and very young
children are at particular risk for malnutrition, which can cause costly lifelong disabilities and
deficits. To address this, the Special Supplemental Nutrition Program for Women, Infants and
Children (WIC) was established in 1972 as a program of the United States Department of Agriculture
(USDA) for nutrition among low-income families.49
Pregnant women, postpartum women, infants
and children up to age five are eligible if they are in a family earning less than 185 percent of the
poverty line and if a counselor deems them at risk of malnutrition.50
It provides nutritious food,
education at clinics, and referrals to other health services.
In 2010 in Ohio, 292,937 women and children received WIC and the average monthly benefit per
person was $33.52.51
Modest as this figure is, participation has been associated with improved birth
outcomes and lower Medicaid costs.52
This program too is under attack: The House appropriations
bill passed in May 2011 would have slashed funding for WIC and would have ended assistance to
approximately 9,700 to 14,600 Ohio recipients.53
Childcare subsidies
Over half a million Ohio children under age of six need childcare because their parents work.54
The
cost is high: The average annual fee in Ohio for full-time center care of an infant is $7,761. For single
Ohio parents with the median income of $21,538, the cost for one infant would comprise 36 percent
of family income if they chose center-based care.55
To ease this financial burden and enable low-
46
U.S. Department of Agriculture, A Short History of SNAP, http://1.usa.gov/aHGw0d.
47
Dorothy Rosenbaum, House-Passed Proposal to Block-Grant And Cut SNAP (Food Stamps) Rests on False Claims
About Program Growth, Center on Budget and Policy Priorities, Last updated May 5, 2011.
48
Id.
49
USDA Food and Nutrition Service, About WIC, http://1.usa.gov/gDa7Go (visited June 25, 2011).
50
http://www.fns.usda.gov/wic/howtoapply/eligibilityrequirements.htm
51
Children’s Defense Fund, Children in Ohio, (visited June 27, 2011) http://bit.ly/K3ghu3.
52
National WIC Association, How WIC Impacts the People of Ohio, http://nwica.org/sites/default/files/Ohio.pdf
53
Center on Budget and Policy Priorities, Zoë Neuberger and Robert Greenstein, House WIC Cuts Would End Food
Assistance for 300,000 to 450,000 Low-Income Women and Children, June 23, 2011, http://bit.ly/ir81Mo.
54
National Association of Child Care Resource and Referral Agencies (NACCRRA), 2011 Child Care in the State of:
Ohio, available at http://www.naccrra.org/publications/naccrra-publications/publications/SFS-Ohio.pdf.
55
Id.
17. Updating the Social Contract
www.policymattersohio.org17
income parents to work, the federal government administers several programs aimed at improving
affordability and quality of childcare, including the Child Care Development Block Grant (CCDBG),
TANF and Title XX/Social Services Block Grants. The federal government is the primary funder of
these programs (over $200 million), but the state also contributes $84 million to the CCDF, as well as
$200,000 from the TANF block grant.56
While many needy families do not qualify, those that do
benefit in several ways – quality of care can be increased,57
ability to work is made much more
reliable,58
and income from work can stretch further.
Close to 30,000 Ohio families (with 51,000 children) receive assistance through these federally
funded programs in the form of reduced childcare fees.59
An additional 50,000 children with family
incomes below 150 percent of the poverty line can also get more modest state-level assistance.60
This
assistance allows families to pay a smaller and more manageable fee for childcare. For instance, in
2010 an eligible family of three with an income at 100 percent of poverty ($18,310) would have paid
7 percent of family income or about $1,300 toward childcare and the program would have picked up
the remaining cost.61
The childcare assistance program is extremely helpful to those who qualify, even if childcare costs
remain substantial for poor families. It also helps to improve quality. For instance, Ohio is one of 13
states that has established or is establishing a Quality Rating Improvement System (QRIS), which
rates childcare programs and creates incentives for providers to improve their quality rating. Ohio
established a QRIS in 2007, and already has 24 percent of licensed providers participating.62
Ohio initially was able to avoid cuts to childcare programs by receiving federal block grants from
Child Care and Development Fund (CCDF), including $207 million in 2011.63
However, these funds
were only temporary, and instead of finding another source of revenue, Ohio leaders have slashed
funding for vital services including childcare. Under the budget passed last year, the income-
eligibility threshold was reduced from 150 percent of poverty to 125 percent of poverty (with an
exception for those already receiving assistance). Those above 150 percent of poverty—for instance,
a family of three making $27,980 a year (151 percent of poverty)— already didn’t qualify, and a
family of three living on $23,348 a year (126 percent of poverty) will no longer be eligible. In
56
U.S. Department of Health and Human Services, Administration for Children and Families, The Office of Child Care’s
National Child Care Information and Technical Assistance Center, State Profile: Ohio, http://nccic.acf.hhs.gov/.
57
The Future of Children, Princeton-Brookings, 11 Caring for Infants and Toddlers 15 Spring/Summer 2001)
58
National Women’s Law Center, Child Care: Helping Families Work and Children Succeed, http://bit.ly/L3lXcM
(“single mothers of young children who received child care assistance were 39 percent more likely to still be employed
after two years and former welfare recipients were 82 percent more likely to still be employed after two years than those
who did not receive any help paying for child care”)
59
National Association of Child Care Resource and Referral Agencies (NACCRRA), 2011 Child Care in the State of:
Ohio, available at www.naccrra.org/publications/naccrra-publications/publications/SFS-Ohio.pdf.
60
Ohio Department of Job and Family Services, Child Care Fact Sheet
61
National Women’s Law Center, State Child Care Assistance Policies 2010: Ohio.
62
National Women’s Law Center, Promising State Child Care Quality and Infant/Toddler Initiatives, April 07, 2011,
available at http://www.nwlc.org/sites/default/files/pdfs/statechildcarequalityinitiativesapril2011_0.pdf.
63
U.S. Department of Health and Human Services, Administration for Children and Families, Office of Child Care,
CCDF Funding Allocations, available at http://www.acf.hhs.gov/programs/ccb/law/allocations/state.htm
18. Updating the Social Contract
www.policymattersohio.org18
addition to the stricter income requirements, the Ohio budget calls for reducing spending on childcare
programs from $134.2 million in 2011 to $123.5 million in 2012.64
Unemployment insurance
The deep slump of 2009 to 2012 produced some of the worst unemployment levels since World War
II. In 2009, the number of workers unemployed longer than six months was the highest since 1946.65
The unemployment rate among men soared; from May 2007 to May 2009, male unemployment
increased 119 percent. In Ohio, as of March 2011, more than 400,000 workers were officially
unemployed.66
Unemployment insurance was created in 1935 with two goals: to temporarily replace involuntarily
unemployed workers’ wages, and to promote economic stability by spurring consumer spending.67
In
addition to helping workers make ends meet, unemployment insurance reduces chaos in workers’
lives and improves their chances of returning to work once the economy improves.68
Individuals who
exhaust unemployment benefits before finding work are more likely to end up on Social Security
disability and possibly Medicaid.
Federal-State unemployment insurance (UI) provides financial assistance to “eligible workers who
are unemployed through no fault of their own (as determined under state law), and meet other
eligibility requirements of state law.”69
Funding is based on an employer tax in all states – three states
also allow employee contributions. To be eligible for unemployment insurance in Ohio, a worker
must have been employed at least 20 weeks during the previous “base period” and must have earned
an average weekly wage of at least $222.70
Typically the unemployed worker receives about two-
fifths of previous pay for a limited amount of time.71
The time limits are generally extended for states
experiencing high unemployment, or during times of economic downturn and the federal government
pays for the extensions.
In 2009, unemployment insurance kept over 3 million Americans out of poverty.72
Despite this huge
success, many unemployed workers are not eligible for benefits. Currently only a little more than a
quarter of the unemployed (32 percent) collect state unemployment benefits.73
One problem is that
unemployment insurance was designed to serve the needs of the demographics of that time, which
was a workforce mostly comprised of married male breadwinners. Despite major workforce shifts
64
Joe Vardon, “Kasich’s Budget: Current Child-Care Enrollees Can Stay; Subsidy Eligibility Would be Tighter for New
Families,” Columbus Dispatch, April 12, 2011.
65
Urban Institute, Reducing Poverty and Economic Distress after ARRA, http://bit.ly/JecYhW. (visited June 13, 2011).
66
Ohio Department of Job and Family Services, April 2012 Press Release, available at http://1.usa.gov/GKDt43.
67
United States Government Accountability Office, Unemployment Insurance: Information on Benefit Receipt,
www.gao.gov/new.items/d05291.pdf (visited June 28, 2011).
68
Economic Policy Institute, Extending unemployment insurance is the fiscally responsible thing to do,
http://bit.ly/cw6xUp (visited June 28, 2011).
69
United States Department of Labor, State Unemployment Insurance Benefits, http://bit.ly/ujLac.
70
Ohio Department of Job and Family Services, Unemployment Compensation FAQ’s, available at
http://jfs.ohio.gov/unemp_comp_faq/faq_elig_definitions1.stm.
71
In the majority of state workers are eligible for a maximum of 26 weeks of Unemployment Insurance. Center on Budget
and Policy Priorities, Introduction to Unemployment Insurance, http://bit.ly/chXWfH (visited June 25, 2011).
72
Center on Budget and Policy Priorities, Unemployment: By the Numbers, http://bit.ly/JgDtWA (June 30, 2011).
73
National Employment Law Project, Unemployment Insurance Modernization: Filling the Gaps in the Unemployment
Safety Net While Stimulating the Economy, http://bit.ly/Kn1oXB. (visited June 27, 2011.)
19. Updating the Social Contract
www.policymattersohio.org19
and some modernization of the program, eligibility requirements have not been completely updated
to reflect today’s worker demographics.
Workers who earn low wages or work part-time jobs often do not qualify for unemployment
insurance in Ohio because they cannot meet base earnings and minimum-weeks-worked
requirements. Workers in training programs qualify for benefits in some states but not in Ohio.
Additionally, workers who need to quit work for “compelling family circumstances” (such as a
spouse being transferred, a family member needing full-time care or a domestic violence situation)
are ineligible for benefits because their job loss is categorized as “voluntary”.74
Overall, just 23
percent of unemployed Ohio workers qualified for benefits last year.
Under the American Recovery and Reinvestment Act, $7 billion was set aside for states that
modernized their unemployment insurance.75
Ohio already enacted some modernization reforms
years ago, including the policy of counting workers’ most recent earnings when applying for benefits,
allowing the state to receive $88.2 million of the recovery act funds.76
Unfortunately Ohio did not
fully modernize its system under either governors Strickland or Kasich, and consequently forfeited
$176.3 million in federal funds.
States like Ohio also face financial challenges because they’ve underfunded their unemployment
systems. Dozens of states (including Ohio) exhausted state unemployment funds and obtained federal
loans to prevent disruptions in benefits. As a result, Ohio currently owes $2.3 billion in federal loan
funds. The state has had to pay interest on this borrowing and has not yet come up with a long-term
fix to the solvency problem. A key element of this solution should be to raise the share of wages that
employers pay taxes on. However, state policymakers so far have shied away from the issue. Federal
legislation was introduced to raise the taxable wage base and forgive debt for states that establish
solvency plans, but it has not moved forward.77
In the meantime, as federal law requires, small tax
increases covering all participating employers have begun and will grow each year.
Health insurance
The United States has traditionally done much less to ensure health insurance coverage than other
wealthy countries. However, throughout the middle years of the twentieth century, many families
were able to receive health insurance coverage through a family member’s workplace. For families
where the main wage earner had retired, Medicare provided coverage, and for poor jobless families,
Medicaid was a safety net. Over the last 30 years, however, coverage through the workplace declined
and more low-wage families found themselves without coverage and unable to afford to purchase it.
This section describes what is available and what will change with the newly passed Patient
Protection and Affordable Care Act.
74
Center of Budget and Policy Priorities, Addressing Longstanding Gaps in Unemployment Insurance Coverage,
http://www.cbpp.org/cms/index.cfm?fa=view&id=517 (visited June 28, 2011).
75
Schiller, Zach, August 2010, “Less than one year left until Ohio loses $176 million for unemployment compensation,”
Policy Matters Ohio, http://www.policymattersohio.org/pdf/UCRelease2010_08.pdf (visited June 28, 2011).
76
Policy Matters Ohio, Less than two months until Ohio loses $176 million for unemployment Compensation, July 11,
2011, http://policymattersohio.org/UnemploymentRelease2011_0711.htm.
77
Catherine Candisky, “State Debt for Jobless Benefits Looming,” The Columbus Dispatch, December 19, 2010,
available at http://bit.ly/ho1aFa.
20. Updating the Social Contract
www.policymattersohio.org20
Medicare is the largest public health program in the country. Created in 1965 as Title XVIII of the
Social Security Act, Medicare provides health insurance to people age 65 and older, regardless of
income or health history.78
When the program was implemented in 1966, a little more than fifty
percent of those ages 65 and above had hospital coverage, compared to almost universal coverage
today.79
In addition to assisting seniors, Medicare was expanded in 1972 to cover people under 65
who have permanent disabilities.
As of 2009, 47 million Americans were enrolled in Medicare, and 16 percent of Ohioans received
Medicare coverage. As of 2009, 40 percent of the Ohio recipients lived below 200 percent of
poverty.80
For many elderly, Medicare provides “essential, but incomplete” protection against
medical expenses.81
Gaps remain in coverage – for instance, Medicare does not cover long-term care,
dental or vision – and as a result, most beneficiaries have some form of supplemental coverage.82
In
addition, the program has high deductibles and cost-sharing requirements, no limit on out-of-pocket
spending, and a gap in prescription drug coverage. Lastly, securing stable funding and maintaining a
high quality of care as the population ages will remain a political battle. Nonetheless, this program is
an American success story, providing solid coverage at lower cost than most private programs and
eliminating fears about medical costs for many older Americans.
Medicaid provides public health insurance and long-term care coverage for eligible low-income
individuals and for some with chronic disease or disability who private plans exclude. Importantly,
Medicaid was designed to meet increased demand during an economic downturn; enrollment can
expand based on need because the program does not allow waiting lists or enrollment caps.
Medicaid works well, but more Ohioans should qualify. Many parents as well as adults without
dependent children are not eligible, unless they are pregnant or disabled. In addition, in most states
lawfully-residing immigrants are ineligible for the first five years of residency.83
There are millions
of low-income Americans who are currently not eligible for Medicaid. This will improve
dramatically when additional parts of the Affordable Care Act take effect in 2014.
In Ohio, 18 percent of the population relies on Medicaid.84
The Affordable Care Act will expand
Medicaid to cover individuals at 133 percent of poverty, increasing enrollment and spending (relative
to the baseline) by an estimated 31.9 percent by 2019.85
In the meantime, the program must survive
attacks by Congress. Under the House budget bill passed on April 15, 2011, Medicaid would have
been converted to a block grant and funding reduced 49 percent by 2030.86
Although the attempt
78
Kaiser Family Foundation, Fact Sheet, Medicare at a Glance, http://bit.ly/K0LkJG (visited June 29, 2011).
79
Social Security Administration, 30th Anniversary of Medicare, Health Care Financing Review,
http://www.ssa.gov/history/pdf/WhatMedicareMeant.pdf
80
Kaiser Family Foundation, Ohio: Distribution of Medicare Enrollees by Federal Poverty Level, states (2008-2009),
U.S. (2009), www.statehealthfacts.org/profileind.jsp?ind=295&cat=6&rgn=37 (visited June 29, 2011).
81
Diane Rowland, Sc.D., and Barbara Lyons, Ph.D., Medicare, Medicaid, and the Elderly Poor, Health Care Financing
Review 64, http://www.ssa.gov/history/pdf/WhatMedicareMeant.pdf (visited June 29, 2011).
82
Kaiser Family Foundation, Fact Sheet, Medicare at a Glance, http://bit.ly/K0LkJG (visited June 29, 2011).
83
Id.
84
Kaiser Family Foundation, State Health Facts, Facts At-A-Glance, available at http://bit.ly/KflO4w.
85
Kaiser Family Foundation, Ohio: Medicaid Expansion, available at http://bit.ly/K0LUXG.
86
Center on Budget and Policy Priorities, Ryan Medicaid Block Grant Would Cause Severe Reductions in Health Care
and Long-Term Care for Seniors, People with Disabilities, and Children, May 3, 2011, at http://bit.ly/mvEEhD.
21. Updating the Social Contract
www.policymattersohio.org21
failed, it would have resulted in states having to raise taxes, cut other spending, or cap enrollment,
tighten eligibility, and reduce benefits.
Medicaid is also vital for kids. A staggering one-third of children in the United States receive health
coverage from Medicaid or Children’s Health Insurance Program (CHIP), and over half of all low-
income children participate in one of the two plans.87
Medicaid provides health insurance for the
poorest children, and CHIP fills gaps by providing care for children who are low-income but outside
the eligibility range of Medicaid. In Ohio, a family at 200 percent of the poverty level is eligible for
CHIP, and 265,680 children were covered in early 2011.88
Nearly half of all Medicaid enrollees are
children. While the program reaches a large number of children living in poverty, 7.9 percent of
children in Ohio were uninsured last year, and over a quarter of the state’s two-year-olds are not fully
immunized.89
In March 2010, President Barack Obama signed the Patient Protection and Affordable Care Act after
a long, protracted battle to deal with our growing health insurance crisis. By the time the Affordable
Care Act is fully enacted in January 2015, small businesses and individual Americans will be able to
purchase health insurance through an exchange, employers who don’t provide coverage will be
required to pay penalties, insurers will not be able to deny coverage for any reason or charge
premiums based on health problems, and Medicaid will be expanded to cover more of the near-poor.
90
As we document significant erosion of the social contract, this law represents a rare reinforcement
of the social contract and will go a long way toward reducing the insecurity of Ohio families.
Social Security
Social Security provides economic insurance for families in the form of retirement benefits, disability
benefits, life insurance benefits, and Medicare. The program was initially implemented in response to
huge increases in poverty among the elderly. Even before the Great Depression, major demographic
shifts including increased urbanization, reliance on wages rather than working the land, and a
decrease in extended-family households that made the elderly especially vulnerable. It is believed
that over half of the elderly in 1934 had insufficient income to support themselves.91
Today, nearly one in six Ohioans receives Social Security. This crucial safety net lifts 859,000 Ohio
residents out of poverty. While most beneficiaries are elderly, 47,000 Ohio children receive Social
Security payments because a working parent who paid into the system died, became disabled, or
retired. According to one estimate, without Social Security benefits over half of women aged 65 and
older would be in poverty, whereas with Social Security that rate is reduced to 10 percent. 92
87
Kaiser Family Foundation, Kaiser Commission on Key Facts, Health Coverage of Children: The Role of Medicaid and
CHIP, February 2011, available at http://www.kff.org/uninsured/upload/7698-05.pdf.
88
Children’s Defense Fund, Children in Ohio, available at http://bit.ly/gtdXOx.
89
As of January 2011, 47 percent of Ohio Medicaid enrollees were children. Ibid.
90
Kaiser Family Foundation, Summary of Coverage Provisions in the Patient Protection and Affordable Care Act,
publication #8023-R available at www.kff.org.
91
Social Security Administration, Historical Background and Development of Social Security, available at
http://www.ssa.gov/history/briefhistory3.html.
92
National Women’s Law Center, Social Security: Vital to Ohio Women and Families, available at
www.nwlc.org/sites/default/files/pdfs/ohio_ss_factsheet.pdf.
22. Updating the Social Contract
www.policymattersohio.org22
Despite its many successes, Social Security needs to modernize. The program is designed with a
certain worker in mind – a male breadwinner who works full-time. The current system is also biased
in favor of married couples, so those who are single or divorced do not fare as well as their married
counterparts. 93
Additionally, because Social Security benefits are tied to employment, workers (primarily women)
who have gaps in employment history or worked part-time suffer from lower retirement pensions. For
example, women work 12 years fewer than men on average, resulting in less savings, fewer
promotions and fewer pay raises over a lifetime.94
This combined with the fact that women live
longer than men means that elderly women often deplete savings in order to pay for healthcare costs
and have greater reliance upon Social Security.
Housing
Many Ohio families lack access to safe and decent affordable housing. According to the Coalition on
Homelessness and Housing in Ohio (COHHIO), over a quarter million Ohio households spent more
than half of their income on housing in 2010. A widely accepted formula deems housing unaffordable
if it comprises more than 30 percent of a household budget.
The United States does not have a federal housing policy, in the way that it has food stamps,
Medicaid, Medicare, Social Security, or even cash assistance (constrained as that now is). While
federal and state programs help some low-income families, there is no guarantee, little consistency,
and an extreme shortfall. Assistance peaked in 1978 and today is funded at about half that level.
Meanwhile, the very low-income population grew from 10 million in 1978 to 16.3 million in 2005. 95
Public housing provides some eligible low-income families with access to a varied housing stock,
including single-family homes and high-rise apartments. Public housing also acts as a crucial safety
net for the elderly and the disabled: Two-thirds of families in public housing have a family member
who is elderly or disabled. 96
Federal housing vouchers (such as Section 8) help some very low-income families secure housing by
subsidizing the cost of rent above 30 percent of the family’s income. The voucher program is
managed by a local public housing authority and lets renters live in privately owned housing.97
But
the program has a waiting list and many eligible families cannot get any assistance.
Federal housing assistance helps only one in five low-income households in need.98
We provide
much more to help financially secure families with housing than we do to help the neediest.
Federally, approximately $230 billion supports home ownership, which benefits upper middle class
93
Urban Institute, C. Eugene Steuerle, Melissa M. Favreault, Social Security for Yesterday's Family?, 2002,
www.urban.org/retirement_policy/url.cfm?ID=310598 (June 29, 2011).
94
Cornelius Frank, “More Women Outlive Retirement Savings, Rely on Social Security,” Springfield News-Sun, June 9,
2011, available at http://bit.ly/lodS3Z.
95
Coalition on Homelessness and Housing in Ohio, http://www.cohhio.org/ (visited June 21, 2011).
96
U.S. Department of Housing and Urban Development, HUD’s Public Housing Program, available at
http://portal.hud.gov/hudportal/HUD?src=/topics/rental_assistance/phprog.
97
http://portal.hud.gov/hudportal/HUD?src=/topics/housing_choice_voucher_program_section_8
98
National Low-Income Housing Coalition, “Housing Assistance for Low Income Households: States do not Fill the
Gaps,” page 4, October 2008, available at http://www.nlihc.org/doc/PATCHWORK.pdf.
23. Updating the Social Contract
www.policymattersohio.org23
and wealthy families disproportionately, while only $60 billion is focused on the rental sector.99
Even
though extremely low-income renters comprise a quarter of all renters,100
9 million extremely low-
income renters currently compete for only 6.2 million affordable homes.101
Because of a federal shift toward home ownership and a decrease in funding, state governments are
increasingly called upon to fill the gaps. In Ohio, state-based programs such as the Housing
Assistance Program and the Housing Trust Fund provide some housing assistance for low-income
families. The Housing Assistance Program provides funding for emergency home repair, repair to
make homes accessible to residents with disabilities, counseling and down payments for low-income
individuals and families.102
In 2010 the program gave grants totaling $6 million and provided
homeless assistance worth $20 million.103
Ohio’s Housing Trust Fund was created as a result of a grassroots effort to improve housing
conditions in the state. Ohio has one of the most vibrant Housing Trust Funds in the nation, the result
of savvy negotiating by Ohio housing advocates.104
In 1990 voters approved Issue 1, a constitutional
amendment making housing a public purpose, and a year later the legislature passed implementing
legislation.105
Today the Housing Trust Fund supports homelessness prevention, construction/rehabilitation of
rental units and homeownership units and supportive services to low-income households. In addition
to supporting families in need, the program helps Ohio’s economy. An analysis of the economic
impact of the Housing Trust Fund found an extremely positive impact on the regional economy,
ranging from a $2.31 return to a $14.54 return per dollar spent, depending on how the estimate is
calculated.106
Another way to help with housing is by making homes more energy efficient. A small number of
poor families get this help. It’s a smart investment. The Weatherization Assistance Program, created
in 1976, improves the energy efficiency of low-income households, helps lower rising home energy
bills and improves home health and safety.107
The program got a huge boost under the 2009
American Recovery and Reinvestment Act, which allocated $5.1 billion to state weatherization
assistance programs, including nearly $248 million to Ohio.108
Since July 2009, this program has
99
National Low-Income Housing Coalition, 2011 Advocate’s Guide to Housing and Community Development Policy,
page 23, available at http://www.nlihc.org/doc/2011-Advocates-Guide.pdf.
100
Id. at 11.
101
National Low-Income Housing Coalition, supra note 107.
102
Ohio Department of Development, Housing, Shelter and Supportive Services Programs, Housing Assistance Grant
Program, http://bit.ly/IVeIC5 (visited June 30, 2011).
103
Ohio Department of Development, FY 2010 Homeless Assistance Grant Program Award Recipients, at
http://bit.ly/Jh2YWr.
104
Housing Matters Newsletter, Texas Low Income Housing Information Service, 2007, http://bit.ly/JeUNPw.
105
Ohio Housing Trust Fund, 2010 Annual Report, available at http://bit.ly/IVeMli.
106
Coalition on Homelessness and Housing in Ohio, Economic and Job Creation Impact Study of the Ohio Housing Trust
Fund Allocation, Fiscal years 2006-2009, http://bit.ly/LiZHba.
107
U.S. Department of Energy, Weatherization Assistance Program, “The Recovery Act: Ohio Close Up,” January 2010,
http://www1.eere.energy.gov/wip/project_map/project_details_new.aspx?pid=92.
108
U.S. Department of Health and Human Services, Office of Community Services, Fact Sheet: Low Income Housing
Energy Assistance Program, available at http://1.usa.gov/JeV7xL.
24. Updating the Social Contract
www.policymattersohio.org24
created 1,000 jobs, weatherized 5,602 homes, and helped homeowners save an average of $350 a year
(32 percent) on energy bills.109
The program is a success as an economic investment, as a form of assistance to low-income families,
and as a way of reducing carbon emissions. According to the U.S. Department of Energy, for every
$1 invested in the program $2.73 is returned to the household and society, with $1.67 in reduced
energy bills and $1.06 in non-energy benefits such as jobs, improved housing quality, and improved
health and safety.110
In addition to saving homeowners money, the weatherization program addresses
other issues in the home such as problems with unsafe combustion systems, mold or moisture.
The weatherization program only helps only a fraction of the families that could benefit from better
weatherization. Those who do get assistance see long-term benefits, but many are left out. Overall,
the weatherization program is extremely effective but it should be expanded to generate jobs, reduce
pollution and help families lower their energy costs.
V. Help through the tax code – but who benefits?
Increasingly, the United States is delivering social benefits through our tax code. This is particularly
true of programs designed to help with healthcare, child-rearing, retirement and home ownership.111
Benefits through the tax code include tax expenditures (such as deductions, which reduce the amount
of taxes someone owes) and tax credits. Tax expenditures promote certain policies (such as home
ownership, retirement saving or higher education investment) by allowing filers to deduct from taxes
owed, reducing their tax bill and government revenue. Tax credits, on the other hand, apply against
any taxes owed, and the difference (up to the full amount of the credit) is refunded to the taxpayer.
Because low and moderate-income families typically do not owe as much in taxes, they often are not
able to take full advantage of deductions.
Some tax policies, such as the Earned Income Credit, are extremely helpful to low- and moderate-
income families. However, the federal tax code is largely skewed in favor of those who make
$50,000 a year or more, which means many working families cannot access benefits that encourage
asset building and developing wealth. Major changes are needed to develop a tax system that lifts
more families out of poverty.
Table 1, below, lists the major federal tax deductions and credits that help individuals save or meet
basic expenses. Retirement deductions are the biggest ticket item in terms of overall cost to the
federal budget – in 2010 families with enough spare income to put money away each month for
retirement were able to reduce their tax liabilities, in total, by $108.2 billion. This is an important
public policy. Social Security benefits are modest and families need to save beyond Social Security to
retire comfortably. However, wealthy and upper middle earning families benefit far more from this
set of deductions than lower-middle or low-earning families.
109
U.S. Department of Energy, Weatherization Assistance Program, “The Recovery Act: Ohio Close Up,” January 2010,
http://www1.eere.energy.gov/wip/project_map/project_details_new.aspx?pid=92.
110
Id.
111
New America Foundation, Lauren Damme, The Regressive Delivery of Social Welfare Benefits in the U.S., November
2010, http://newamerica.net/sites/newamerica.net/files/policydocs/NSC%205.pdf (visited July 18, 2011).
25. Updating the Social Contract
www.policymattersohio.org25
At about the same cost, $103.7 billion, is the home mortgage deduction. This costly program is
extremely helpful in enabling people to buy a home. However, as with retirement deductions, many
of the principal beneficiaries are wealthier families. The ability to deduct the cost of a second home
skews this program even further toward spending on the wealthy.
Coming in third in terms of overall cost to the government is the Earned Income Credit, which is
targeted toward families of modest income. The cost of this, the government’s largest anti-poverty
program, is less than a fourth of the cost of the retirement and home mortgage deductions combined,
each of which vastly disproportionately benefits upper middle income and wealthy families.
Earned Income Credit
The Earned Income Tax Credit (EIC) is a refundable tax credit for low- to moderate-income working
families. The credit aims to make work pay by countering payroll taxes and returning money to
families. An estimated half of all families with children will receive the credit at some point. In
112
New America Foundation, http://bit.ly/Ku4YNK (source for cells labeled 2005 UI)
113
Urban Institute, Leonard Berman, et. al., Distributional Effects of Defined Contribution Plans and Individual
Retirement Accounts, August 2004, http://bit.ly/J3ZsUB (this is source for cells labeled 2004 UI)
114
Urban Institute, Home Ownership: What Are the Benefits? 2008, http://bit.ly/jOk1Ip (source: cells labeled 2008 UI)
115
Urban Institute, A Reference Manual for Child Tax Benefits,2010 A Reference Manual for Child Tax Benefits (source
for cells labeled 2010 UI)
116
Urban Institute, Education: What tax incentives exist to help families pay for college?, 2008 http://bit.ly/JFUhqv.
(source for cells labeled UI 2008)
Table 1
Costs and benefits: Selected tax credits and exemptions
Credit or exemption Total cost
(billions,
in 2010)112
Number of
recipients
(millions)
Average annual benefit
Retirement deductions
(includes defined
contributions, IRAs,
Keogh plans)
$108.2 143.5 (2004 UI)113 Defined contributions and IRAs:
$528 (2004 UI)
Home mortgage
deduction
$103.7 35 (2006 UI)114 $1,850 (2006 UI)
Earned income tax
credit
$55.1 26.5 (2010 IRS
data)
$2,216 (2010 IRS data)
Child tax credit $54.4 35.7 (2010 UI) $1,025 (2010 UI)115
Higher Education
(Hope Credit, Lifetime
Learning Credit, and
Tuition and Fees
Deduction)
$9.6 Number of students
receiving credit:
(2005 UI)116:
Hope Credit: 2.1
Lifetime Learning
Credit: 4.07
Tuition & fee
deduction: 3.9
Average benefits (2005 UI):
Hope Credit: $1,069
Lifetime Learning: $978
Tuition & fee deduction: $314
Child care tax credit $3.6 6.66 (2010 UI) $532 (2010 UI)
Source: Urban Institute reports (see footnotes) and Internal Revenue Service data 2010
26. Updating the Social Contract
www.policymattersohio.org26
addition to the federal EIC, 24 states and the District of Columbia offer state credits but Ohio does
not.117
The credits assist working families with expenses and partially make up for the fact that most
state and local taxes are regressive and consume a greater share of moderate-income families income
than of higher income families. Because filers must work to claim the credit, the EIC is seen as
encouraging work, and was expanded when welfare became more restrictive.
The EIC is now the country’s largest poverty relief program. In 2011, the credit lifted 6.6 million
working families out of poverty, including 3.3 million children.118
In addition to reducing poverty,
the EIC supplements low wages, encourages work, and attempts to balance a tax system that
overwhelmingly supports the wealthy. For many, the credit is a lifeline. Survey data reveals that
families use the credit to pay for groceries, clothing, household necessities, rent, mortgage payments,
or to fix cars, invest in education or make home repairs.
A number of studies show that this tax credit is one factor behind increased workforce participation
among the poor, especially single women with children. One study found that an approximate $400
EIC increase boosted employment rates by 3.2 percentage points.119
While the EIC has proven successful on many grounds, there are ways that the tax credit could help
more. First, we could put in place a state EIC, which would supplement the federal credit. Second,
low-income households with children where both spouses work are often ineligible for higher credits,
even if the parents earn low wages. We could encourage work by allowing exclusion of half the
income of the lower-earning spouse, giving the family a larger credit and reflecting the greater
expenses faced by two-worker households when compared to households with a parent available for
child care, household chores, and other unpaid work in the home. In addition, childless workers aged
18-24 currently are not eligible for the EIC. Some suggest changing the eligibility age to 18, with a
provision excluding full-time students.
Despite the success of the EIC, more should be done to make the tax code work for low- and
moderate-income families – in total tax expenditures raise the income of the highest income by 13.5
percent, while only raising the income of the bottom fifth of earners by 6.5 percent.120
Child credit
The Child Tax Credit (CTC) provides parents with a qualifying income up to a $1,000 credit per
child.121
The CTC is one of the largest refundable tax credits, with $54.4 billion in tax expenditures
in 2010.122
The credit has two components: a basic, non-refundable tax credit, and an additional
credit that is refundable. Non-refundable tax credits can only be deducted against taxes owed, so
families who earn too little to pay income taxes cannot benefit, even though they pay a
disproportionate share of payroll taxes, sales taxes and other state and local taxes. Unlike the EIC, the
CTC is only partially refundable, meaning that the filer receives a refund only if the credit exceeds
117
http://www.policymattersohio.org/eitc-april2012.
118
http://www.eitc.irs.gov/central/abouteitc/
119
Center on Budget and Policy Priorities, A Hand Up, supra note x.
120
Center for American Progress, Earned Income Tax Credit and Child Tax Credit 101, January 31, 2008,
http://www.americanprogress.org/issues/2008/01/eitc_101.html (visited July 5, 2011).
121
IRS, 10 Facts About the Child Tax Credit, http://1.usa.gov/b2aBNK (visited July 6, 2011).
122
Damme, supra note 127 at 6.
27. Updating the Social Contract
www.policymattersohio.org27
the amount of tax owed. Families can get a refund equal to 15 percent of earnings above $3,000, and
up to $1,000 per child. 123
In 2009 the CTC lifted 2.3 million people above the official poverty line, including 1.3 million
children.124
Despite this, the CTC is slightly regressive because more of it goes to families with
taxable income than to families who don’t earn enough to pay income tax. Families without taxable
income must file for the Additional CTC, the refundable portion of the credit. Families who earn less
than $3,000 do not qualify for the credit at all, and families who earn between $3,000 and $9,667
only receive a partial credit.125
Approximately 10.6 million low-income children did not qualify for
the credit in 2007, and 11 million received only a partial credit. In addition, 50 percent of African-
American and 46 percent of Hispanic children either received partial or no credit because their family
had low or no earnings. Many working families earn too little to qualify for a full or even a partial
credit. According to the Urban Institute, a fully refundable CTC would reduce poverty by 9.2
percent.126
Child Care Credit
The Child and Dependent Care Tax Credit (CDCTC) helps subsidize preschool or childcare by
providing families with a tax credit between 20 and 35 percent of childcare costs, up to $3,000 for
one child or $6,000 for two or more children.127
Families who make less than $15,000 per year
qualify for the 35 percent rate, and the credit decreases by 1 percent for every $2,000 dollars in
income.
Families who make between $75,000 and $200,000 benefit most from the CDCTC. Because the tax is
non-refundable, families not making enough to pay federal income tax are not helped. President
Obama has proposed that the 35 percent rate be expanded to all families making up to $85,000 per
year. This would increase the average family’s credit from $1,200 to $2,100, and would allow
235,000 new children to be served.128
Saver’s Credit
The saver’s credit is designed to offset the first $2,000 that workers voluntarily contribute to IRAs
and 401(k)s, as well as to promote saving for retirement.129
Individuals earning up to $26,500,
married couples filing jointly and earning up to $53,000, and heads of household earning up to
$39,750 qualify for the saver’s credit.130
The IRS reports that in 2006 (the most recent year for which
data is available), joint filers claimed an average $213, heads of household $149, and single filers
$128.131
123
Center for Budget and Policy Priorities, Policy Basics: The Child Tax Credit, November 10, 2009,
http://www.cbpp.org/files/policybasics-ctc.pdf (visited July 20, 2011)
124
Id.
125
Center for Budget and Policy Priorities, supra note 144.
126
Center for American Progress, supra note 146.
127
Urban Institute and Brookings Institution Tax Policy Center, Quick Facts: Child and Dependent Care Tax Credit
(CDCTC), http://www.taxpolicycenter.org/press/quickfacts_cdctc.cfm (visited July 1, 2010).
128
Id.
129
IRS, Plan Now to Get Full Benefit of Saver’s Credit; Tax Break Helps Low- and Moderate-Income Workers Save for
Retirement, http://www.irs.gov/newsroom/article/0,,id=200742,00.html (visited July 6, 2011)
130
IRS, Saver’s Credit for Retirement Savings Contribution, August 2008, at http://1.usa.gov/9fGIR7 (visited July 2011).
131
IRS, Plan Now to Get Full Benefit of Saver’s Credit, supra note 33.
28. Updating the Social Contract
www.policymattersohio.org28
The number helped by the credit is likely to decrease unless credits and qualifying income levels are
adjusted for inflation.132
President Obama has proposed changes that would improve access to the
saver’s credit for lower-income Americans. His primary change would make the credit refundable
for families who don’t have federal tax liability and would deposit the credit directly into the savings
account, maximizing the savings impact.133
Legislation to expand the Saver’s Credit during tax time
was introduced previously but is awaiting introduction in the current Congress.134
An alternative
approach, proposed by The New America Foundation, is a saver’s bonus that would match deposits
made into eligible savings accounts, up to $500. This would allow saving for more purposes,
encourage asset building among the poor, and level a playing field that now perversely provides more
than 90 percent of wealth-building tax credits (those for home ownership and retirement) to those
earning more than $50,000.135
Student Loan Interest Deduction
The Student Loan Interest Deduction (SLID) is a tax deduction to help those who took out student
loans in pursuit of higher education.136
The SLID is a deduction, rather than a credit, and therefore
does not need to be itemized. The maximum deduction for tuition and fees is approximately $4,000,
however, this credit changes relative to income. In fiscal year 2010, it is estimated that this reduced
taxes by $760 million on those eligible.137
The filer’s maximum adjusted gross income must be below
$80,000 or $160,000 if filing as a married couple.138
Loan interest deductions are either $2,500 or the
balance of the loan. In the 2011 tax year just passed, this policy reduced taxes on those eligible by
$1.4 billion.139
While a student loan interest deduction is a good start, more should be done to support students. The
New York Times reported that in 2010 student loan debt outpaced credit debt for the first time, and is
expected to exceed $1 trillion in the coming year.140
That year, students graduated with $24,000 in
debt on average.141
Dramatic decreases in state funding for education have made the cost out of
reach for many families. As a percent of the Ohio budget, “higher education spending peaked in 1978
at 17.7 percent . . . .has fallen each year since 1996…[in 2005 was] 11.7 percent.”142
In 2008, the
132
Center on Budget and Policy Priorities, Saver's Credit For Moderate-Income Families Would Fade Away Over Time
Under House-Passed Pension Bill, July 17, 2006, http://www.cbpp.org/cms/?fa=view&id=123, (July 6, 2011).
133
http://www.taxpolicycenter.org/taxtopics/2011_savers_credit.cfm
134
http://hdl.loc.gov/loc.uscongress/legislation.111hr1961 and http://hdl.loc.gov/loc.uscongress/legislation.111s3090
135
New America Foundation, The Saver's Bonus: Encouraging and Facilitating Savings by Working Families at Tax
Time, July 2009, http://newamerica.net/publications/policy/savers_bonus (visited July 5, 2011).
136
IRS, Student Loan Interest Deduction, March 10, 2011, http://www.irs.gov/taxtopics/tc456.html (July 19, 2011).
137
New America Foundation, Federal Education Budget Project, Background and Analysis: Federal Education Tax
Benefits, June 7, 2011, http://febp.newamerica.net/background-analysis/federal-education-tax-benefits?print.
138
IRS, Topic 456 - Student Loan Interest Deduction, http://www.irs.gov/taxtopics/tc456.html, March 1, 2011.
139
New America Foundation, supra note 180.
140
The New York Times, Tamar Lewin, “Burden of College Loans on Graduates Grows,” April 11, 2011,
http://www.nytimes.com/2011/04/12/education/12college.html?_r=2&hpw.
141
Id.
142
Policy Matters Ohio, Wendy Patton and Kiel Albrecht, College Bound at 1, August 2005, available at
http://www.policymattersohio.org/pdf/College_Bound_2005.pdf
29. Updating the Social Contract
www.policymattersohio.org29
median Ohio family would need to contribute 39 percent of its income to support a child attending a
four-year public institution.143
Summary of tax deductions and credits: Who benefits?
Since 1950, the number of tax deductions has grown tremendously, from 12.2 percent of Americans’
adjusted gross income in 1950 to 23.9 percent in 2008.144
All tax expenditures combined cost more
than Social Security, for example, or than Medicare and Medicaid combined as Figure 5 shows.
Unfortunately, tax deductions are skewed in favor of wealthy Americans. As one commentator notes,
“The richest one percentile is 3.25 percent richer from itemized deductions, while the bottom quintile
gains just a .02 percent increase in income as a result of itemized deductions.”145
The home mortgage
deduction is one illustration of this: While those earning under $40,000 a year benefit very little from
the deduction, those earning between $100,000 to $200,000 make up only 8.2 percent of returns, but
claim more than 28 percent of all home mortgage interest spending.146
Two large tax credits—the Earned Income Credit and the Child Tax Credit—are progressive and
“increase[d] the bottom two quartiles’ income levels by 5.35 and 3.99 percent, respectively.”147
On
the other hand, non-refundable tax credits (such as the Hope Credit and the Child Care Tax Credit)
favor middle-class families, but even these credits “are dwarfed in comparison to the deductions,
exclusions, and refundable credits.”148
In the end, tax expenditures that assist working families are
overshadowed by the extensive deductions and exclusions that favor higher earners.
143
NCHEMS Information Center for National Higher Education Policymaking and Analysis, Affordability: Percent of
Family Income Needed to Pay for College - by Type of Institution, 2008- Ohio, http://bit.ly/JkfurD. (visited July 6, 2011).
144
Damme, New America Foundation, supra note 180 at 3.
145
Id.
146
Id.
147
Id.
148
Id.
Figure 5
Federal spending, Fiscal Year 2010 ($billions)
Source: Center for American Progress
30. Updating the Social Contract
www.policymattersohio.org30
VI. Conclusion
Ohio families are struggling. Many can’t find work and many have left the workforce. Even those
who are working often can’t meet their families’ needs through work. Although much of what we
hear about the economy raises fears, the truth is that our economy is larger than ever and is generally
productive and profitable. Yet workers are not sharing in these profits.
The public sector does much to help those in poverty. Social Security, Medicare, Medicaid, Food
Assistance and unemployment insurance do an enormous amount to stabilize communities, meet
medical needs, assist middle class families and raise people out of poverty. Other programs also help,
although more sporadically. But these programs are too restrictive in eligibility and too many are left
behind.
Americans show tremendous support for work, both in what they say and in what they do. But work
is falling short for too many of us. The social contract must be updated – either by increasing our
demands on what employers provide for their employees, or by increasing what the public sector
offers to fill the gap. Without such change, we will continue to see high levels of poverty, staggering
levels of inequality, and insecurity around food, housing, retirement income and health coverage.
Such insecurity is not acceptable in what remains, credit ratings and stock fluctuations aside, the
wealthiest country on the planet and throughout history.