SlideShare uma empresa Scribd logo
1 de 7
Baixar para ler offline
While growth assets are widely accepted in asset allocation decisions during the
accumulation phase, many investors overlook the benefit allocating to shares can
provide in the way of growing tax-effective income in the post-retirement phase.
This paper discusses the differences between pre- and post-retirement asset allocation
and how investors can use an equity income strategy to improve income and returns
with less risk.
This paper finds that utilising a simple hedging strategy over the retirement equities
allocation can improve the length of time the equities allocation can support a given
amount of inflation adjusted retirement spending by over 34% in situations where the
sequence of market returns are poor. This hedging strategy allows investors to safely
increase their allocation to equities in a retirement context. When this is combined with
non-index aware investment process that seeks out companies with high sustainable free
cash flow, retirees stand to benefit from higher and faster growing income with lower risk.
During our working lives, investment strategies are typically
aimed at accumulating wealth and are less concerned with
year-to-year return fluctuations. During this accumulation
phase – it usually makes sense to skew portfolios towards
growth assets such as shares in order to maximise the final
value of the portfolio. While annual returns from such
strategies can be quite volatile, over longer time periods
the volatility is less pronounced, particularly when
inflation is taken into account.
Chart 1: Illustrative accumulation asset allocation
Bank deposits
and bonds
Shares
30%
70%
Needs of retirees compared to workers
Accumulation investors generally do not need to rely on
their portfolio returns or withdrawals of capital to support
their lifestyle and are purely investing to maximise their
wealth, subject to their risk tolerance.
In retirement, investors have a very different risk profile and
appetite and should think about risk and return differently.
According to National Seniors Australia1
, over 90 percent of
seniors rate the following factors as very important when
addressing retirement spending (in order of importance):
1. Meeting the rising cost of healthcare
2. Ensuring their money lasts a lifetime
3. Having regular income to cover the essentials
4. Income that adjusts for inflation
5. Ensuring their savings are not adversely impacted by
market falls
6. Having access to their savings instantly when needed
Thus, for retirees cash-flow matters and the pathway of returns
matters. Retirees will be reliant on the income from their
portfolio to live on. The higher the income, the higher the
cash available to fund day-to-day expenses without the
need to sell the capital assets that produce the income.
Furthermore, the month-to-month fluctuations in returns –
both capital and income – of those assets matter. Investors in
the accumulation phase can endure market declines because
they have time to recover their losses and also can contribute
more funds to buy assets at lower prices.
1 National Seniors Australia / Challenger, “Retirees’ Needs and Their (In)Tolerance for Risk” March 2013.
Rethinking post-retirement
asset allocation
2
The two key investment considerations
for retirees
1. Sequencing risk
Retirees do not have the luxuries afforded to accumulation
investors. Not only do they not have a steady income
from their workplace skills – their human capital – to
supplement their financial capital, but if they have to sell
their financial capital to fund their living expenses during
periods of lower prices, their retirement savings are not
likely to last as long.
This is known as sequencing risk, because it is higher at the
early stages of retirement when the retirement portfolio is
largest but needs to last the longest – hence the sequence
of either good or bad returns is very important. Retirees
can mitigate sequencing risk by investing in low-risk assets
that have less capital value volatility, but this comes with
another trade-off, known as longevity risk.
2. Longevity risk
Longevity risk is essentially the risk of outliving one’s money.
Investing in low risk assets minimises sequencing risk,
but it comes with the trade-off of potentially not
generating sufficient returns to meet desired spending
over the retirement timeframe. In the current low-yield
environment, traditional retirement asset allocations heavy
on fixed income, term deposits and cash simply do not
provide the same future expected returns that they used to.
A key component of longevity risk is inflation – which erodes
the purchasing power of savings. This is why it is important
to ensure both your income and your capital value
keeps up with the rising cost of living. Whilst inflation
has moderated in recent years, the fact remains that the cost
of living for retirees is actually rising faster than the broader
population, largely in part due to healthcare costs.
Chart 2: Annualised Inflation Rate by expenditure category
since June 2005
Source: Reserve Bank of Australia, Merlon Capital Partners
Objectives of retiree investors
Investors face a number of competing objectives and are
thus seeking:
•	Less risk than accumulation strategies to provide a
greater sense of certainty that assets will continue to
support a comfortable retirement
•	Growing income from their investments to support
their ongoing living expenses and keep pace with
inflation
•	Some capital appreciation over time, to ensure that
the capital value and income streams keep pace with
the rising cost of living
•	Liquidity to meet lumpy and unexpected
retirement expenses.
Such objectives can be conflicting, with higher levels of
income typically associated with higher risk and/or lower
levels of capital return.
Why traditional thinking on asset
allocation in retirement needs to change
Traditional retirement allocations are heavy on fixed
income…
In making this trade-off, a typical retiree portfolio would
skew them away from growth assets such as shares,
towards less volatile assets, such as bonds and cash.
Chart 3: Illustrative retirement asset allocation
Bank deposits
and bonds
Shares
30%
70%
As illustrated above, the traditional way of dealing with
some of the risks in retirement portfolios is through asset
allocation – shifting the mix of assets into less volatile asset
classes such a bonds and cash. This is generally a conscious
decision to trade more longevity risk for less sequencing
risk: a higher risk portfolio has higher future return
potential – reducing longevity risk – but at the expense of
sequencing risk if a large market crash takes place early.
3
This traditional allocation towards fixed income has been
supported by a favourable return environment for fixed
income securities over the last 30 years as long-term
interest rates have fallen, which coincides with much of
the development of the retirement savings and funds
management industry.
Chart 4: SP500 (US) vs US 10yr Government bond yields
Source: Stock market data used in “Irrational Exuberance” Princeton
University Press, 2000, 2005, 2015, updated
….yet fixed income may not be able to deliver the
same absolute returns going forward
Fixed income still remains an effective portfolio
diversification tool as its returns are generally negatively
correlated to equities over the cycle. However, future
returns are likely to be lower and more volatile. In addition,
fixed-rate bonds (which comprise the majority of traditional
benchmark fixed income allocations) are a poor inflation
hedge – interest by definition is fixed and does not grow,
nor do investors benefit from tax-effective franking credits.
Whilst falling interest rates have supported historical fixed
income returns, it means that current yields – the ‘price of
safety’– are at record lows.
Chart 5: Current yields are at record lows
Yield%p.a.
Source: Reserve Bank of Australia
For retirees with capital within account based pension
structures, with minimum annual draw-downs exceeding
4% and rising to over 7% during the peak spending
periods of retirement, current yields on the fixed income
asset classes in Chart 5 mean that they must spend capital
to meet their minimum drawdown requirements.
If investors need to draw down capital to meet spending,
this means that the capital remaining is less likely to last
as long. It is unlikely that the yields on the above
instruments will go back to the levels that existed before
the GFC in the foreseeable future given global macro-
economic headwinds.
Retirees face more inflation risk, yet returns above
inflation are hard to predict
Many investors fail to appreciate that whilst the absolute level
of inflation is low (albeit rising) at present, the level of inflation
in comparison to the returns on so called safe investments like
term deposits is very hard to predict. Chart 6 shows historical
1-year term deposit rates every quarter over the last 10 years
(shaded) and the percentage of the return of that term deposit
rate absorbed by inflation over the next 12 months.
Chart 6: Historical 1-year term deposit rates vs average
TD returns absorbed by inflation
Source: Reserve Bank of Australia, Merlon Capital Partners
As you can see, this varies significantly, with some years seeing
nearly 90% of average term deposit returns absorbed by
inflation, and this was in periods where interest rates were
much higher than they are now.
This highlights just how unpredictable real returns over and
above inflation can be on low yielding investments like term
deposits, making it more important to find investments with
a greater cushion above inflation, otherwise known as a
real return, to prevent erosion of the purchasing power of
retirement savings.
4
How equity income strategies address
the two key investment considerations
for retirees
Investment in equities has the potential to add considerable
value to the issues detailed above. Equity income strategies
attempt to build upon the inherent income production
strengths of equities whilst reducing the risk of capital loss.
Use of equity income strategies to lower longevity risk
Australian equity yields have remained attractive compared
with pre-GFC levels. Unlike foreign equities, which often
have yields below 3% and no franking credits (plus extra
volatility on this income stream by virtue of foreign exchange
risk), Australian equities deliver cash-flows to end investors
that are the envy of the world.
Chart 7: The steadying power of dividends
 ASX200 Dividend Return
 ASX Price Risk
 ASX Dividend Risk
 ASX200 Franking Return
 ASX200 Price return
4.4%
3.9%
4.5%
0.5%
4.6%
6.3%
1.5% 1.5% 1.1%
Source: Bloomberg, Merlon Capital Partners. Returns as at 30 September
2016, inclusive of franking credits.
Importantly, dividend income streams are much less risky
than many investors would assume. Over the past five years
from October 2011, the return on the ASX200 price-only
index has averaged 6.3% p.a. with risk of 12.6% p.a.
Yet the same index, but with dividends and franking credits
included and reinvested, has returned 12.9% p.a. with risk
of 12.1% p.a. – much more return with slightly less risk.
The returns from dividends inclusive of franking credits on the
ASX200 have been consistently around 6% p.a. over the past
15 years with around 1.5% annual volatility – a testament to
the steadying influence of dividends on overall returns.
Furthermore, within an Australian context, retirees also benefit
from the tax treatment of fully franked dividends relative to
bank deposits and bonds. For retirees, franking credits are as
valuable as cash dividends or interest received, and can reliably
add an extra 1.5% to 2.0% in annual returns.
In short, shares can provide rates of return from dividends
alone that can exceed minimum drawdown amounts on
pension accounts.
Shares also deliver capital returns that ensure portfolio
values keep up with inflation. Companies with good
competitive positioning within their respective industries
have what is called ‘pricing power’, meaning that they
are able to pass on increases in the cost of their inputs to
their end customers, or they benefit from economies of
scale that enable them to grow revenue whilst keeping
their costs relatively static. Both of these factors mean that
investments in well run, strongly positioned companies
should benefit from cash flow streams that comfortably
exceed inflation over time.
Furthermore, as we have seen, the average dividend yields
on the market have remained very consistent through time,
yet the capital value on the share market has increased.
This means that the actual cash flows received from the
stock market have increased in line with the capital value
appreciation, growing at a much faster rate than inflation.
So shares have the potential to deliver a rising capital value
and a rising cash flow stream that protect against losses of
purchasing power.
Use of equity income strategies to lower sequencing risk
Despite the income advantages of Australian shares,
retirees are left with higher price risk then other asset
classes. A way to reduce this risk is to use derivatives that
remove a large part of the price risk associated with a
traditional share portfolio, while at the same time retaining
the significant tax benefits – the access to franking credits.
This approach partially hedges share exposures by selling call
options and using proceeds to purchase put options. The call
options reduce returns in stronger markets but, importantly,
the put options protect capital in weaker markets.
The net effect is that volatility is reduced, leading to less
sequencing risk. Because hedged share portfolios are less
risky than traditional share portfolios, a greater allocation is
justifiable for a given level of overall risk, lowering longevity
risk whilst ensuring that the contribution of the share
allocation to sequencing risk remains flat or declines.
To illustrate this, we have modelled two hypothetical
portfolios. Both have an initial investment of $100,000, a
$10,000 per annum spending rate that is adjusted upwards
at an inflation rate of 2.5% per annum and a consistent
annualised dividend yield of 4.5% per annum that is 100%
franked. To model returns, we have assumed the same
5
level of monthly risk and average monthly returns that have
prevailed over the past 10 years (which includes the global
financial crisis). As this is a simulation, the modelling takes
these variables and generates a random series of monthly
returns within certain parameters called a normal distribution.
In this case, this means that, roughly 66% of the time, the
monthly price return on the hypothetical portfolio will vary
between 4.3% and -4.0% (and 33% of the time it will be more
volatile than that), but will likely be more clustered around the
average monthly return over the 10 year period of 0.13%.
The only difference between the two portfolios is that one
includes hedging that reduces 30% of the price volatility of
the portfolio (reducing sequencing risk) and the other doesn’t.
The output is measured by how long the portfolio is able
to support the inflation adjusted retirement spending
before the portfolio is depleted (longevity risk). A larger
number means that the portfolio is able to generate more
retirement spending capacity, or in simple terms, it lasts
longer.
Running the simulation 50,000 times gives the following result.
Chart 8: Range of outcomes from simulation
(worst to best case)
As you can see, the best possible outcome is the same for
both portfolios, with the $100,000 portfolio supporting
aggregate retirement spending for approximately 27 years
before it is fully depleted. On average, both portfolios last
about 15 years before they are fully depleted. Where the
volatility protection provides the most value, however, is on
the downside protection. With the standard portfolio, the
worst possible outcome across the 50,000 simulations
is that the portfolio only lasts 4.9 years.
However, with the hedged portfolio, the worst possible
outcome is that the portfolio supports the desired level of
spending for 6.6 years, an improvement of over 34%.
To illustrate the difference in outcomes using some more
assumptions about active management, we can add a 0.9%
p.a. management fee for the hedged actively managed
portfolio, 0.15% p.a. management fee for the passively run
standard indexed portfolio, and assume that the portfolio
manager for the actively managed portfolio is able to deliver
an additional 1.5% p.a. in dividend yield alpha through finding
companies with higher levels of sustainable free cash flow then
the market and 2.5% p.a. in capital gain alpha from investing
in undervalued firms rather than just following benchmark
allocations (all pre fees) – thus covering their management fees
and delivering additional value to the investor.
The difference in retirement spending longevity is
more pronounced with the additional value add from
active management.
Chart 9: Retirement spending longevity
Whilst the best possible outcomes are 27 years for both
portfolios, the hypothetical actively managed product
supports retirement spending for over 19 years versus
14 years and the worst possible outcome is around
51% better than the passively managed investment.
Putting it all together – higher
retirement income and longer lasting
savings with less risk by using Merlon
Most managed funds in Australia construct portfolios with
reference to an index which typically weights shares by
their market values.
Hedging an Australian index-based portfolio makes little
sense for retirees. This is because a large part of the market
– most notably the resource sector – offers only limited fully
franked dividends. Whilst hedging an index-based portfolio
achieves a lower level of aggregate risk than a traditional
share portfolio, it does not take full advantage of the
available tax benefits associated with fully franked dividends.
6
An alternative is to hedge a portfolio of companies with high
and sustainable underlying free cash-flows from their core
businesses. This ensures that the companies in the portfolio
are delivering dividends which are backed by the earnings
from their core businesses, not manufactured using excessive
leverage or short-term unsustainable changes in their capital
investment programs or working capital usage.
Following on from income sustainability, a key component
of capital preservation, it follows any investment should
first-and-foremost be assessed on total return but taking
risk into account. Chart 10 plots total return on the vertical
axis and risk on the horizontal axis. Over a five year period,
income is merely a component of total return and does not
change the position of ‘the dot’.
Chart 10: Merlon risk vs return
Returns for the Fund and ASX200 grossed up for accrued franking credits
and the Fund return is stated after fees as at 31 August 2016. % of
ASX200 Risk represents the Fund’s statistical beta relative to the ASX200
Investors should be able to recreate any point on the line
through a combination of cash and index investing, so
active managers need to be ‘above-the-line.’ Merlon has
achieved this over all time periods as a result of:
•	 Investing in undervalued companies and not starting
with index positions – this improves the total return (see
Merlon share portfolio above).
•	 The hedge overlay which reduces risk to 70% of the
market.
Furthermore, Merlon’s hedging strategy and active
management has reduced downside risk by approximately
60% over the past five years2
.
Chart 11: A simple option strategy provides downside protection
The combination of less risk for a given level of returns
means that retirees can implement an alternative asset
allocation approach and lift their allocation to shares as well
as reduce their allocation to fixed interest, with the aim of
achieving a higher overall return with the same or less risk.
Chart 12: Alternative retirement asset allocation
Bank deposits
and bonds
Merlon
40%
60%
Undertaking the revised allocation would have resulted in
a material increase in annual total returns for slightly less
overall risk than the traditional 70% bonds / 30% equities
allocation, particularly over the past five years and since the
introduction of monthly distributions in July 2012.
Chart 13: Return Comparison (% p.a.)
2 Average drawdown of fund v market over 5 years for drawdown events over 5%. Merlon Fund return based on daily unit price after fees and assuming
reinvestment of distributions.
7
Chart 14: Risk Comparison (% p.a.)
Source: Bloomberg, Merlon Capital Partners
The comparison of total returns above reinforces the
merits of employing a volatility reduction strategy over
an investment strategy that delivers higher returns than
the market.
So on a total return basis, a higher allocation to the Merlon
Wholesale Australian Share Income Fund results in a much
better risk and return outcome than simply investing in an
index fund. Furthermore, the Fund is structured to return a
higher proportion of the total return as income, resulting in
substantially more income to the end client in excess of the
minimum pension drawdown requirements.
In order to assess this, we have used actual unit price and
distribution data from the two largest and lowest cost
index funds that track the broad Australian share market
and bond market indices3
.
Chart 15: Cumulative Income Paid on $100,000
investment over 5 years
Source: Merlon Capital Partners, Vanguard
As you can see, not only does a higher allocation to the
Merlon Wholesale Australian Share Income Fund than the
traditional equity allocation outlined above deliver higher
risk adjusted total returns, but the income that investors
receive outstrips the traditional allocation.
Conclusion
Unlike accumulation investors, retirees face different
challenges to maintaining an income stream sufficient to
deliver the lifestyle they have been saving all their working
lives for.
Investing in shares allows retirees to access the strong
fundamental cash flow generating capabilities of well-run
companies which have the potential to generate dividend
streams and capital returns which can maintain a portfolio’s
spending power.
Equity income strategies such as Merlon’s can then overlay
a volatility reduction strategy that can substantially lower
the risk of the portfolio running out of money early.
Combined with a fundamental research process that invests
in companies that are undervalued and likely to generate
sustainable cash-flows creates an equity solution perfectly
suited for retirees.
3 Vanguard Australian Fixed Interest Index Fund (Wholesale) and Vanguard
Australian Shares Index Fund (Wholesale).
The information contained in this publication is current as at 9 January 2017 unless otherwise specified and is provided by Fidante Partners Limited, ABN 94 002 835 592, AFSL 234668 (Fidante Partners)
the responsible entity and issuer of interests in the Merlon Wholesale Australian Share Income Fund ARSN 090 578 171 (the ‘Fund’). The information in this document is up to date as at the time of
preparation and is intended for adviser use only. Merlon Capital Partners Pty Ltd ABN 94 140 833 683 AFSL 343753 (Merlon) is the investment manager of the Fund. This information is intended as general
information only and not as financial product advice and has been prepared without taking into account any person’s objectives, financial situation or needs. Because of this each person should, before
acting on any such information, consider its appropriateness, having regard to their objectives, financial situation and needs. Each person should also obtain a copy of the product disclosure statement (PDS)
and any additional information brochure (AIB) and consider the information in those documents (including the information about risks) before making any investment decisions. If you acquire or hold an
investment in the Fund we will receive the fees and other benefits disclosed in the PDS and any AIB for the Fund. We and our employees do not receive any specific remuneration for any advice provided
to you. However, financial advisers may receive fees or commissions if they provide advice to you or arrange for you to invest in the Fund. Some or all of the Fidante Partners related companies and their
directors may benefit taxation consequence of investing. Past performance is not a reliable indicator of future performance. A copy of the PDS and any AIB can be obtained from the Fidante website:
www.fidante.com.au. or by calling the Adviser Services Team on 1800 195 853.
24771/0117
By Sam Morris, CFA
Investment Specialist, Fidante Partners

Mais conteúdo relacionado

Mais procurados

Investment Portfolio
Investment PortfolioInvestment Portfolio
Investment Portfolioazarazua
 
HIGHWATER CAPITAL FUND TEAR SHEET
HIGHWATER CAPITAL FUND TEAR SHEETHIGHWATER CAPITAL FUND TEAR SHEET
HIGHWATER CAPITAL FUND TEAR SHEETtrustgod999
 
Asset allocation-guide
Asset allocation-guideAsset allocation-guide
Asset allocation-guideSuvarna Joshi
 
Income Matching Using Bonds NorCal 2011
Income Matching Using Bonds NorCal 2011Income Matching Using Bonds NorCal 2011
Income Matching Using Bonds NorCal 2011Brent Burns
 
Introduction to investments
Introduction to investmentsIntroduction to investments
Introduction to investmentsMohammed Umair
 
Investment Analysis & Portfolio Management: Chapter 03
Investment Analysis & Portfolio Management: Chapter 03Investment Analysis & Portfolio Management: Chapter 03
Investment Analysis & Portfolio Management: Chapter 03jeffmgilmore
 
Understanding savings and investment
Understanding savings and investmentUnderstanding savings and investment
Understanding savings and investmentSmitha Raman
 
What is Liability Driven Investing - FPA NY 2011
What is Liability Driven Investing - FPA NY 2011What is Liability Driven Investing - FPA NY 2011
What is Liability Driven Investing - FPA NY 2011Brent Burns
 
1. introduction basics of investments.ppt
1. introduction   basics of investments.ppt1. introduction   basics of investments.ppt
1. introduction basics of investments.pptNavneet Jingar
 
Asset Classes and Market Segments
Asset Classes and Market SegmentsAsset Classes and Market Segments
Asset Classes and Market Segments1990prabhjot
 
Presentation on Fundamentals of Investment
Presentation on Fundamentals of InvestmentPresentation on Fundamentals of Investment
Presentation on Fundamentals of InvestmentSajal Agarwal
 
Investors life cycle
Investors life cycleInvestors life cycle
Investors life cycleVinay Kenkere
 
Asset Allocation for Beginners
Asset Allocation for BeginnersAsset Allocation for Beginners
Asset Allocation for BeginnersRaakesh Thayyil
 
Harvard Management Company Investment Analysis
Harvard Management Company Investment AnalysisHarvard Management Company Investment Analysis
Harvard Management Company Investment Analysisbensigler
 
Investment portfolio presentation
Investment portfolio presentationInvestment portfolio presentation
Investment portfolio presentationneelimatadikonda
 

Mais procurados (20)

Investment Portfolio
Investment PortfolioInvestment Portfolio
Investment Portfolio
 
HIGHWATER CAPITAL FUND TEAR SHEET
HIGHWATER CAPITAL FUND TEAR SHEETHIGHWATER CAPITAL FUND TEAR SHEET
HIGHWATER CAPITAL FUND TEAR SHEET
 
Asset allocation-guide
Asset allocation-guideAsset allocation-guide
Asset allocation-guide
 
Asset allocation ppt
Asset allocation pptAsset allocation ppt
Asset allocation ppt
 
Income Matching Using Bonds NorCal 2011
Income Matching Using Bonds NorCal 2011Income Matching Using Bonds NorCal 2011
Income Matching Using Bonds NorCal 2011
 
Ideal Asset Allocation
Ideal Asset AllocationIdeal Asset Allocation
Ideal Asset Allocation
 
Introduction to investments
Introduction to investmentsIntroduction to investments
Introduction to investments
 
Investment Analysis & Portfolio Management: Chapter 03
Investment Analysis & Portfolio Management: Chapter 03Investment Analysis & Portfolio Management: Chapter 03
Investment Analysis & Portfolio Management: Chapter 03
 
Understanding savings and investment
Understanding savings and investmentUnderstanding savings and investment
Understanding savings and investment
 
Fundamentals of asset class investing
Fundamentals of asset class investingFundamentals of asset class investing
Fundamentals of asset class investing
 
What is Liability Driven Investing - FPA NY 2011
What is Liability Driven Investing - FPA NY 2011What is Liability Driven Investing - FPA NY 2011
What is Liability Driven Investing - FPA NY 2011
 
1. introduction basics of investments.ppt
1. introduction   basics of investments.ppt1. introduction   basics of investments.ppt
1. introduction basics of investments.ppt
 
IPM
IPMIPM
IPM
 
Investment Fundamentals
Investment FundamentalsInvestment Fundamentals
Investment Fundamentals
 
Asset Classes and Market Segments
Asset Classes and Market SegmentsAsset Classes and Market Segments
Asset Classes and Market Segments
 
Presentation on Fundamentals of Investment
Presentation on Fundamentals of InvestmentPresentation on Fundamentals of Investment
Presentation on Fundamentals of Investment
 
Investors life cycle
Investors life cycleInvestors life cycle
Investors life cycle
 
Asset Allocation for Beginners
Asset Allocation for BeginnersAsset Allocation for Beginners
Asset Allocation for Beginners
 
Harvard Management Company Investment Analysis
Harvard Management Company Investment AnalysisHarvard Management Company Investment Analysis
Harvard Management Company Investment Analysis
 
Investment portfolio presentation
Investment portfolio presentationInvestment portfolio presentation
Investment portfolio presentation
 

Destaque (12)

Anovulación crónica
Anovulación crónicaAnovulación crónica
Anovulación crónica
 
Apresentacao Clic Biz 2017
Apresentacao Clic Biz 2017Apresentacao Clic Biz 2017
Apresentacao Clic Biz 2017
 
Certificate Course in Technical Writing
Certificate Course in Technical WritingCertificate Course in Technical Writing
Certificate Course in Technical Writing
 
MADMike presentation - Master
MADMike presentation - MasterMADMike presentation - Master
MADMike presentation - Master
 
lengua
lengua lengua
lengua
 
Jashpal CV
Jashpal CVJashpal CV
Jashpal CV
 
Priti - ETL Engineer
Priti - ETL EngineerPriti - ETL Engineer
Priti - ETL Engineer
 
2017 Career Partner Media Kit
2017 Career Partner Media Kit2017 Career Partner Media Kit
2017 Career Partner Media Kit
 
New CF DX NACF Presentation
New CF DX NACF PresentationNew CF DX NACF Presentation
New CF DX NACF Presentation
 
Riesgos ocupacionales
Riesgos ocupacionalesRiesgos ocupacionales
Riesgos ocupacionales
 
Sociología Jurídica I
Sociología Jurídica ISociología Jurídica I
Sociología Jurídica I
 
Inglês
InglêsInglês
Inglês
 

Semelhante a 24771 Merlon Retirement Papers_FINAL

CONFIDENT_RETIREMENT_WHITE_PAPER
CONFIDENT_RETIREMENT_WHITE_PAPERCONFIDENT_RETIREMENT_WHITE_PAPER
CONFIDENT_RETIREMENT_WHITE_PAPERKye Bounds, CRPC
 
June Monthly Report.pdf
June Monthly Report.pdfJune Monthly Report.pdf
June Monthly Report.pdfJesseLudenyo1
 
Leveragepaper
LeveragepaperLeveragepaper
LeveragepaperLW B
 
Market Perspectives - April 2018
Market Perspectives  - April 2018Market Perspectives  - April 2018
Market Perspectives - April 2018Mark Biegel
 
FS_Advice_-_Leverage-_Where_Advisers_Fear_to_Tread_-_Julie_Mckay
FS_Advice_-_Leverage-_Where_Advisers_Fear_to_Tread_-_Julie_MckayFS_Advice_-_Leverage-_Where_Advisers_Fear_to_Tread_-_Julie_Mckay
FS_Advice_-_Leverage-_Where_Advisers_Fear_to_Tread_-_Julie_MckayClaire Starr MBA
 
Building a portfolio for income
Building a portfolio for incomeBuilding a portfolio for income
Building a portfolio for incomevilord
 
Building a better retirement nest egg.
Building a better retirement nest egg.Building a better retirement nest egg.
Building a better retirement nest egg.Steve Flegg
 
Portfolio perspectives greatest_lesson_part3_0913
Portfolio perspectives greatest_lesson_part3_0913Portfolio perspectives greatest_lesson_part3_0913
Portfolio perspectives greatest_lesson_part3_0913Better Financial Education
 
Investors Need Purchasing Power
Investors Need Purchasing Power Investors Need Purchasing Power
Investors Need Purchasing Power John M Olson, CLTC
 
What is your retirement GAP?
What is your retirement GAP?What is your retirement GAP?
What is your retirement GAP?streeterg
 
49571 building investment portfolios
49571   building investment portfolios49571   building investment portfolios
49571 building investment portfoliosavatenna
 
Investment diversification a 2013/14
Investment diversification a  2013/14Investment diversification a  2013/14
Investment diversification a 2013/14Oliver Taylor
 
Common Factors Affecting Retirement Income
Common Factors Affecting Retirement IncomeCommon Factors Affecting Retirement Income
Common Factors Affecting Retirement IncomeDolf Dunn
 
rathbones_charity_white_paper_absolute_vs_relative_return_investing
rathbones_charity_white_paper_absolute_vs_relative_return_investingrathbones_charity_white_paper_absolute_vs_relative_return_investing
rathbones_charity_white_paper_absolute_vs_relative_return_investingAndrew Pitt
 
MASECO Approach Jan15v2
MASECO Approach Jan15v2MASECO Approach Jan15v2
MASECO Approach Jan15v2Josh Matthews
 

Semelhante a 24771 Merlon Retirement Papers_FINAL (20)

CONFIDENT_RETIREMENT_WHITE_PAPER
CONFIDENT_RETIREMENT_WHITE_PAPERCONFIDENT_RETIREMENT_WHITE_PAPER
CONFIDENT_RETIREMENT_WHITE_PAPER
 
June Monthly Report.pdf
June Monthly Report.pdfJune Monthly Report.pdf
June Monthly Report.pdf
 
Leveragepaper
LeveragepaperLeveragepaper
Leveragepaper
 
Market Perspectives - April 2018
Market Perspectives  - April 2018Market Perspectives  - April 2018
Market Perspectives - April 2018
 
FS_Advice_-_Leverage-_Where_Advisers_Fear_to_Tread_-_Julie_Mckay
FS_Advice_-_Leverage-_Where_Advisers_Fear_to_Tread_-_Julie_MckayFS_Advice_-_Leverage-_Where_Advisers_Fear_to_Tread_-_Julie_Mckay
FS_Advice_-_Leverage-_Where_Advisers_Fear_to_Tread_-_Julie_Mckay
 
Elmwood quarterly insights
Elmwood quarterly insightsElmwood quarterly insights
Elmwood quarterly insights
 
Building a portfolio for income
Building a portfolio for incomeBuilding a portfolio for income
Building a portfolio for income
 
Building a better retirement nest egg.
Building a better retirement nest egg.Building a better retirement nest egg.
Building a better retirement nest egg.
 
Portfolio perspectives greatest_lesson_part3_0913
Portfolio perspectives greatest_lesson_part3_0913Portfolio perspectives greatest_lesson_part3_0913
Portfolio perspectives greatest_lesson_part3_0913
 
Wealth Creation
Wealth CreationWealth Creation
Wealth Creation
 
Investors Need Purchasing Power
Investors Need Purchasing Power Investors Need Purchasing Power
Investors Need Purchasing Power
 
Q2 2015 Newsletter
Q2 2015 NewsletterQ2 2015 Newsletter
Q2 2015 Newsletter
 
EQUITY MUTUAL FUND
EQUITY MUTUAL FUNDEQUITY MUTUAL FUND
EQUITY MUTUAL FUND
 
What is your retirement GAP?
What is your retirement GAP?What is your retirement GAP?
What is your retirement GAP?
 
49571 building investment portfolios
49571   building investment portfolios49571   building investment portfolios
49571 building investment portfolios
 
Mutual Funds
Mutual FundsMutual Funds
Mutual Funds
 
Investment diversification a 2013/14
Investment diversification a  2013/14Investment diversification a  2013/14
Investment diversification a 2013/14
 
Common Factors Affecting Retirement Income
Common Factors Affecting Retirement IncomeCommon Factors Affecting Retirement Income
Common Factors Affecting Retirement Income
 
rathbones_charity_white_paper_absolute_vs_relative_return_investing
rathbones_charity_white_paper_absolute_vs_relative_return_investingrathbones_charity_white_paper_absolute_vs_relative_return_investing
rathbones_charity_white_paper_absolute_vs_relative_return_investing
 
MASECO Approach Jan15v2
MASECO Approach Jan15v2MASECO Approach Jan15v2
MASECO Approach Jan15v2
 

24771 Merlon Retirement Papers_FINAL

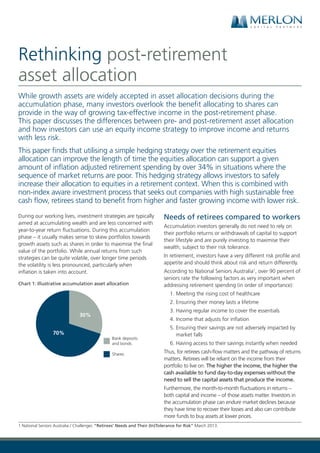
  • 1. While growth assets are widely accepted in asset allocation decisions during the accumulation phase, many investors overlook the benefit allocating to shares can provide in the way of growing tax-effective income in the post-retirement phase. This paper discusses the differences between pre- and post-retirement asset allocation and how investors can use an equity income strategy to improve income and returns with less risk. This paper finds that utilising a simple hedging strategy over the retirement equities allocation can improve the length of time the equities allocation can support a given amount of inflation adjusted retirement spending by over 34% in situations where the sequence of market returns are poor. This hedging strategy allows investors to safely increase their allocation to equities in a retirement context. When this is combined with non-index aware investment process that seeks out companies with high sustainable free cash flow, retirees stand to benefit from higher and faster growing income with lower risk. During our working lives, investment strategies are typically aimed at accumulating wealth and are less concerned with year-to-year return fluctuations. During this accumulation phase – it usually makes sense to skew portfolios towards growth assets such as shares in order to maximise the final value of the portfolio. While annual returns from such strategies can be quite volatile, over longer time periods the volatility is less pronounced, particularly when inflation is taken into account. Chart 1: Illustrative accumulation asset allocation Bank deposits and bonds Shares 30% 70% Needs of retirees compared to workers Accumulation investors generally do not need to rely on their portfolio returns or withdrawals of capital to support their lifestyle and are purely investing to maximise their wealth, subject to their risk tolerance. In retirement, investors have a very different risk profile and appetite and should think about risk and return differently. According to National Seniors Australia1 , over 90 percent of seniors rate the following factors as very important when addressing retirement spending (in order of importance): 1. Meeting the rising cost of healthcare 2. Ensuring their money lasts a lifetime 3. Having regular income to cover the essentials 4. Income that adjusts for inflation 5. Ensuring their savings are not adversely impacted by market falls 6. Having access to their savings instantly when needed Thus, for retirees cash-flow matters and the pathway of returns matters. Retirees will be reliant on the income from their portfolio to live on. The higher the income, the higher the cash available to fund day-to-day expenses without the need to sell the capital assets that produce the income. Furthermore, the month-to-month fluctuations in returns – both capital and income – of those assets matter. Investors in the accumulation phase can endure market declines because they have time to recover their losses and also can contribute more funds to buy assets at lower prices. 1 National Seniors Australia / Challenger, “Retirees’ Needs and Their (In)Tolerance for Risk” March 2013. Rethinking post-retirement asset allocation
  • 2. 2 The two key investment considerations for retirees 1. Sequencing risk Retirees do not have the luxuries afforded to accumulation investors. Not only do they not have a steady income from their workplace skills – their human capital – to supplement their financial capital, but if they have to sell their financial capital to fund their living expenses during periods of lower prices, their retirement savings are not likely to last as long. This is known as sequencing risk, because it is higher at the early stages of retirement when the retirement portfolio is largest but needs to last the longest – hence the sequence of either good or bad returns is very important. Retirees can mitigate sequencing risk by investing in low-risk assets that have less capital value volatility, but this comes with another trade-off, known as longevity risk. 2. Longevity risk Longevity risk is essentially the risk of outliving one’s money. Investing in low risk assets minimises sequencing risk, but it comes with the trade-off of potentially not generating sufficient returns to meet desired spending over the retirement timeframe. In the current low-yield environment, traditional retirement asset allocations heavy on fixed income, term deposits and cash simply do not provide the same future expected returns that they used to. A key component of longevity risk is inflation – which erodes the purchasing power of savings. This is why it is important to ensure both your income and your capital value keeps up with the rising cost of living. Whilst inflation has moderated in recent years, the fact remains that the cost of living for retirees is actually rising faster than the broader population, largely in part due to healthcare costs. Chart 2: Annualised Inflation Rate by expenditure category since June 2005 Source: Reserve Bank of Australia, Merlon Capital Partners Objectives of retiree investors Investors face a number of competing objectives and are thus seeking: • Less risk than accumulation strategies to provide a greater sense of certainty that assets will continue to support a comfortable retirement • Growing income from their investments to support their ongoing living expenses and keep pace with inflation • Some capital appreciation over time, to ensure that the capital value and income streams keep pace with the rising cost of living • Liquidity to meet lumpy and unexpected retirement expenses. Such objectives can be conflicting, with higher levels of income typically associated with higher risk and/or lower levels of capital return. Why traditional thinking on asset allocation in retirement needs to change Traditional retirement allocations are heavy on fixed income… In making this trade-off, a typical retiree portfolio would skew them away from growth assets such as shares, towards less volatile assets, such as bonds and cash. Chart 3: Illustrative retirement asset allocation Bank deposits and bonds Shares 30% 70% As illustrated above, the traditional way of dealing with some of the risks in retirement portfolios is through asset allocation – shifting the mix of assets into less volatile asset classes such a bonds and cash. This is generally a conscious decision to trade more longevity risk for less sequencing risk: a higher risk portfolio has higher future return potential – reducing longevity risk – but at the expense of sequencing risk if a large market crash takes place early.
  • 3. 3 This traditional allocation towards fixed income has been supported by a favourable return environment for fixed income securities over the last 30 years as long-term interest rates have fallen, which coincides with much of the development of the retirement savings and funds management industry. Chart 4: SP500 (US) vs US 10yr Government bond yields Source: Stock market data used in “Irrational Exuberance” Princeton University Press, 2000, 2005, 2015, updated ….yet fixed income may not be able to deliver the same absolute returns going forward Fixed income still remains an effective portfolio diversification tool as its returns are generally negatively correlated to equities over the cycle. However, future returns are likely to be lower and more volatile. In addition, fixed-rate bonds (which comprise the majority of traditional benchmark fixed income allocations) are a poor inflation hedge – interest by definition is fixed and does not grow, nor do investors benefit from tax-effective franking credits. Whilst falling interest rates have supported historical fixed income returns, it means that current yields – the ‘price of safety’– are at record lows. Chart 5: Current yields are at record lows Yield%p.a. Source: Reserve Bank of Australia For retirees with capital within account based pension structures, with minimum annual draw-downs exceeding 4% and rising to over 7% during the peak spending periods of retirement, current yields on the fixed income asset classes in Chart 5 mean that they must spend capital to meet their minimum drawdown requirements. If investors need to draw down capital to meet spending, this means that the capital remaining is less likely to last as long. It is unlikely that the yields on the above instruments will go back to the levels that existed before the GFC in the foreseeable future given global macro- economic headwinds. Retirees face more inflation risk, yet returns above inflation are hard to predict Many investors fail to appreciate that whilst the absolute level of inflation is low (albeit rising) at present, the level of inflation in comparison to the returns on so called safe investments like term deposits is very hard to predict. Chart 6 shows historical 1-year term deposit rates every quarter over the last 10 years (shaded) and the percentage of the return of that term deposit rate absorbed by inflation over the next 12 months. Chart 6: Historical 1-year term deposit rates vs average TD returns absorbed by inflation Source: Reserve Bank of Australia, Merlon Capital Partners As you can see, this varies significantly, with some years seeing nearly 90% of average term deposit returns absorbed by inflation, and this was in periods where interest rates were much higher than they are now. This highlights just how unpredictable real returns over and above inflation can be on low yielding investments like term deposits, making it more important to find investments with a greater cushion above inflation, otherwise known as a real return, to prevent erosion of the purchasing power of retirement savings.
  • 4. 4 How equity income strategies address the two key investment considerations for retirees Investment in equities has the potential to add considerable value to the issues detailed above. Equity income strategies attempt to build upon the inherent income production strengths of equities whilst reducing the risk of capital loss. Use of equity income strategies to lower longevity risk Australian equity yields have remained attractive compared with pre-GFC levels. Unlike foreign equities, which often have yields below 3% and no franking credits (plus extra volatility on this income stream by virtue of foreign exchange risk), Australian equities deliver cash-flows to end investors that are the envy of the world. Chart 7: The steadying power of dividends  ASX200 Dividend Return  ASX Price Risk  ASX Dividend Risk  ASX200 Franking Return  ASX200 Price return 4.4% 3.9% 4.5% 0.5% 4.6% 6.3% 1.5% 1.5% 1.1% Source: Bloomberg, Merlon Capital Partners. Returns as at 30 September 2016, inclusive of franking credits. Importantly, dividend income streams are much less risky than many investors would assume. Over the past five years from October 2011, the return on the ASX200 price-only index has averaged 6.3% p.a. with risk of 12.6% p.a. Yet the same index, but with dividends and franking credits included and reinvested, has returned 12.9% p.a. with risk of 12.1% p.a. – much more return with slightly less risk. The returns from dividends inclusive of franking credits on the ASX200 have been consistently around 6% p.a. over the past 15 years with around 1.5% annual volatility – a testament to the steadying influence of dividends on overall returns. Furthermore, within an Australian context, retirees also benefit from the tax treatment of fully franked dividends relative to bank deposits and bonds. For retirees, franking credits are as valuable as cash dividends or interest received, and can reliably add an extra 1.5% to 2.0% in annual returns. In short, shares can provide rates of return from dividends alone that can exceed minimum drawdown amounts on pension accounts. Shares also deliver capital returns that ensure portfolio values keep up with inflation. Companies with good competitive positioning within their respective industries have what is called ‘pricing power’, meaning that they are able to pass on increases in the cost of their inputs to their end customers, or they benefit from economies of scale that enable them to grow revenue whilst keeping their costs relatively static. Both of these factors mean that investments in well run, strongly positioned companies should benefit from cash flow streams that comfortably exceed inflation over time. Furthermore, as we have seen, the average dividend yields on the market have remained very consistent through time, yet the capital value on the share market has increased. This means that the actual cash flows received from the stock market have increased in line with the capital value appreciation, growing at a much faster rate than inflation. So shares have the potential to deliver a rising capital value and a rising cash flow stream that protect against losses of purchasing power. Use of equity income strategies to lower sequencing risk Despite the income advantages of Australian shares, retirees are left with higher price risk then other asset classes. A way to reduce this risk is to use derivatives that remove a large part of the price risk associated with a traditional share portfolio, while at the same time retaining the significant tax benefits – the access to franking credits. This approach partially hedges share exposures by selling call options and using proceeds to purchase put options. The call options reduce returns in stronger markets but, importantly, the put options protect capital in weaker markets. The net effect is that volatility is reduced, leading to less sequencing risk. Because hedged share portfolios are less risky than traditional share portfolios, a greater allocation is justifiable for a given level of overall risk, lowering longevity risk whilst ensuring that the contribution of the share allocation to sequencing risk remains flat or declines. To illustrate this, we have modelled two hypothetical portfolios. Both have an initial investment of $100,000, a $10,000 per annum spending rate that is adjusted upwards at an inflation rate of 2.5% per annum and a consistent annualised dividend yield of 4.5% per annum that is 100% franked. To model returns, we have assumed the same
  • 5. 5 level of monthly risk and average monthly returns that have prevailed over the past 10 years (which includes the global financial crisis). As this is a simulation, the modelling takes these variables and generates a random series of monthly returns within certain parameters called a normal distribution. In this case, this means that, roughly 66% of the time, the monthly price return on the hypothetical portfolio will vary between 4.3% and -4.0% (and 33% of the time it will be more volatile than that), but will likely be more clustered around the average monthly return over the 10 year period of 0.13%. The only difference between the two portfolios is that one includes hedging that reduces 30% of the price volatility of the portfolio (reducing sequencing risk) and the other doesn’t. The output is measured by how long the portfolio is able to support the inflation adjusted retirement spending before the portfolio is depleted (longevity risk). A larger number means that the portfolio is able to generate more retirement spending capacity, or in simple terms, it lasts longer. Running the simulation 50,000 times gives the following result. Chart 8: Range of outcomes from simulation (worst to best case) As you can see, the best possible outcome is the same for both portfolios, with the $100,000 portfolio supporting aggregate retirement spending for approximately 27 years before it is fully depleted. On average, both portfolios last about 15 years before they are fully depleted. Where the volatility protection provides the most value, however, is on the downside protection. With the standard portfolio, the worst possible outcome across the 50,000 simulations is that the portfolio only lasts 4.9 years. However, with the hedged portfolio, the worst possible outcome is that the portfolio supports the desired level of spending for 6.6 years, an improvement of over 34%. To illustrate the difference in outcomes using some more assumptions about active management, we can add a 0.9% p.a. management fee for the hedged actively managed portfolio, 0.15% p.a. management fee for the passively run standard indexed portfolio, and assume that the portfolio manager for the actively managed portfolio is able to deliver an additional 1.5% p.a. in dividend yield alpha through finding companies with higher levels of sustainable free cash flow then the market and 2.5% p.a. in capital gain alpha from investing in undervalued firms rather than just following benchmark allocations (all pre fees) – thus covering their management fees and delivering additional value to the investor. The difference in retirement spending longevity is more pronounced with the additional value add from active management. Chart 9: Retirement spending longevity Whilst the best possible outcomes are 27 years for both portfolios, the hypothetical actively managed product supports retirement spending for over 19 years versus 14 years and the worst possible outcome is around 51% better than the passively managed investment. Putting it all together – higher retirement income and longer lasting savings with less risk by using Merlon Most managed funds in Australia construct portfolios with reference to an index which typically weights shares by their market values. Hedging an Australian index-based portfolio makes little sense for retirees. This is because a large part of the market – most notably the resource sector – offers only limited fully franked dividends. Whilst hedging an index-based portfolio achieves a lower level of aggregate risk than a traditional share portfolio, it does not take full advantage of the available tax benefits associated with fully franked dividends.
  • 6. 6 An alternative is to hedge a portfolio of companies with high and sustainable underlying free cash-flows from their core businesses. This ensures that the companies in the portfolio are delivering dividends which are backed by the earnings from their core businesses, not manufactured using excessive leverage or short-term unsustainable changes in their capital investment programs or working capital usage. Following on from income sustainability, a key component of capital preservation, it follows any investment should first-and-foremost be assessed on total return but taking risk into account. Chart 10 plots total return on the vertical axis and risk on the horizontal axis. Over a five year period, income is merely a component of total return and does not change the position of ‘the dot’. Chart 10: Merlon risk vs return Returns for the Fund and ASX200 grossed up for accrued franking credits and the Fund return is stated after fees as at 31 August 2016. % of ASX200 Risk represents the Fund’s statistical beta relative to the ASX200 Investors should be able to recreate any point on the line through a combination of cash and index investing, so active managers need to be ‘above-the-line.’ Merlon has achieved this over all time periods as a result of: • Investing in undervalued companies and not starting with index positions – this improves the total return (see Merlon share portfolio above). • The hedge overlay which reduces risk to 70% of the market. Furthermore, Merlon’s hedging strategy and active management has reduced downside risk by approximately 60% over the past five years2 . Chart 11: A simple option strategy provides downside protection The combination of less risk for a given level of returns means that retirees can implement an alternative asset allocation approach and lift their allocation to shares as well as reduce their allocation to fixed interest, with the aim of achieving a higher overall return with the same or less risk. Chart 12: Alternative retirement asset allocation Bank deposits and bonds Merlon 40% 60% Undertaking the revised allocation would have resulted in a material increase in annual total returns for slightly less overall risk than the traditional 70% bonds / 30% equities allocation, particularly over the past five years and since the introduction of monthly distributions in July 2012. Chart 13: Return Comparison (% p.a.) 2 Average drawdown of fund v market over 5 years for drawdown events over 5%. Merlon Fund return based on daily unit price after fees and assuming reinvestment of distributions.
  • 7. 7 Chart 14: Risk Comparison (% p.a.) Source: Bloomberg, Merlon Capital Partners The comparison of total returns above reinforces the merits of employing a volatility reduction strategy over an investment strategy that delivers higher returns than the market. So on a total return basis, a higher allocation to the Merlon Wholesale Australian Share Income Fund results in a much better risk and return outcome than simply investing in an index fund. Furthermore, the Fund is structured to return a higher proportion of the total return as income, resulting in substantially more income to the end client in excess of the minimum pension drawdown requirements. In order to assess this, we have used actual unit price and distribution data from the two largest and lowest cost index funds that track the broad Australian share market and bond market indices3 . Chart 15: Cumulative Income Paid on $100,000 investment over 5 years Source: Merlon Capital Partners, Vanguard As you can see, not only does a higher allocation to the Merlon Wholesale Australian Share Income Fund than the traditional equity allocation outlined above deliver higher risk adjusted total returns, but the income that investors receive outstrips the traditional allocation. Conclusion Unlike accumulation investors, retirees face different challenges to maintaining an income stream sufficient to deliver the lifestyle they have been saving all their working lives for. Investing in shares allows retirees to access the strong fundamental cash flow generating capabilities of well-run companies which have the potential to generate dividend streams and capital returns which can maintain a portfolio’s spending power. Equity income strategies such as Merlon’s can then overlay a volatility reduction strategy that can substantially lower the risk of the portfolio running out of money early. Combined with a fundamental research process that invests in companies that are undervalued and likely to generate sustainable cash-flows creates an equity solution perfectly suited for retirees. 3 Vanguard Australian Fixed Interest Index Fund (Wholesale) and Vanguard Australian Shares Index Fund (Wholesale). The information contained in this publication is current as at 9 January 2017 unless otherwise specified and is provided by Fidante Partners Limited, ABN 94 002 835 592, AFSL 234668 (Fidante Partners) the responsible entity and issuer of interests in the Merlon Wholesale Australian Share Income Fund ARSN 090 578 171 (the ‘Fund’). The information in this document is up to date as at the time of preparation and is intended for adviser use only. Merlon Capital Partners Pty Ltd ABN 94 140 833 683 AFSL 343753 (Merlon) is the investment manager of the Fund. This information is intended as general information only and not as financial product advice and has been prepared without taking into account any person’s objectives, financial situation or needs. Because of this each person should, before acting on any such information, consider its appropriateness, having regard to their objectives, financial situation and needs. Each person should also obtain a copy of the product disclosure statement (PDS) and any additional information brochure (AIB) and consider the information in those documents (including the information about risks) before making any investment decisions. If you acquire or hold an investment in the Fund we will receive the fees and other benefits disclosed in the PDS and any AIB for the Fund. We and our employees do not receive any specific remuneration for any advice provided to you. However, financial advisers may receive fees or commissions if they provide advice to you or arrange for you to invest in the Fund. Some or all of the Fidante Partners related companies and their directors may benefit taxation consequence of investing. Past performance is not a reliable indicator of future performance. A copy of the PDS and any AIB can be obtained from the Fidante website: www.fidante.com.au. or by calling the Adviser Services Team on 1800 195 853. 24771/0117 By Sam Morris, CFA Investment Specialist, Fidante Partners