The ROBO-STOX Global Robotics and Automation UCITIS Index has been rebalanced
•
1 gostou•291 visualizações

ROBOSTOX has just completed another quarterly re-balance of our UCITS compliant index (ROBOT). There are now 80 index constituents with the following new additions: Teradyne Inc, SLM Solutions AG, Daifuku Company Limited, Parrot SA and Yushin Precision Equipment. Full details can be found in the attached Index Fact Sheet. Thank you.

Recomendados
Mais conteúdo relacionado
Destaque
Destaque (8)
Último
Último (20)
The ROBO-STOX Global Robotics and Automation UCITIS Index has been rebalanced
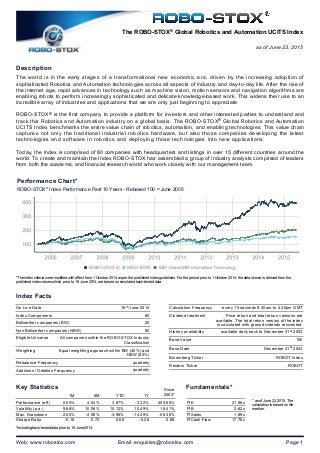
- 1. The ROBO-STOX® Global Robotics and Automation UCITS Index as of June 23, 2015 Index Facts Description The world is in the early stages of a transformational new economic era, driven by the increasing adoption of sophisticated Robotics and Automation technologies across all aspects of industry and day-to-day life. After the rise of the internet age, rapid advances in technology such as machine vision, motion sensors and navigation algorithms are enabling robots to perform increasingly sophisticated and delicate knowledge-based work. This widens their use to an incredible array of industries and applications that we are only just beginning to appreciate. ROBO-STOX® is the first company to provide a platform for investors and other interested parties to understand and track this Robotics and Automation industry on a global basis. The ROBO-STOX® Global Robotics and Automation UCITS Index benchmarks the entire value chain of robotics, automation, and enabling technologies. This value chain captures not only the traditional industrial robotics hardware, but also those companies developing the latest technologies and software in robotics and deploying those technologies into new applications. Today, the Index is comprised of 80 companies with headquarters and listings in over 15 different countries around the world. To create and maintain the Index ROBO-STOX has assembled a group of industry analysts comprised of leaders from both the academic and financial research world who work closely with our management team. Performance Chart* Additions / Deletion Frequency Non Bellwether companies (NBW) ROBOT Index Base Value Equal weighting approach within BW (40%) and NBW (60%) .ROBOT Bellwether companies (BW) Price return and total return versions are available. The total return version of the index is calculated with gross dividends reinvested. every 15 seconds 9.30am to 4.30pm GMT Bloomberg Ticker Reuters Ticker Rebalance Frequency 16th June 2014Go Live Date Weighting available daily back to December 31st 2003 Index Components Calculation Frequency All companies within the ROBO-STOX Industry Classification History availability Eligible Universe quarterly 100 Dividend treatment quarterly 1Y Since 2003*6M Performance (eff.) YTD Key Statistics 1M Volatility (p.a.) Sharpe Ratio Max. Drawdown Fundamentals* Base Date December 31st 2003 P/E P/Cash Flow P/B P/Sales 80 20 60 -0.18 0.05% 9.88% -2.52% 10.12% -3.98% -58.36% 0.68 400.68% -14.49% 4.04% 0.72 -4.98% 10.06% -3.32% 0.66 18.41% 3.67% -0.28 10.49% ROBO-STOX® Index Performance Past 10 Years - Rebased 100 = June 2005 *The index criteria were modified with effect from 1 October 2014 as per the published index guidelines. For the period prior to 1 October 2014, the data shown is derived from the published index values which, prior to 16 June 2014, are based on simulated back-tested data. *Including back-tested data prior to 16 June 2014. 21.96x 2.82x 1.89x 17.76x * as of June 22, 2015. The calculation is based on the median. Web: www.robostox.com Email: enquiries@robostox.com Page 1
- 2. The ROBO-STOX® Global Robotics and Automation UCITS Index as of June 23, 2015 Technology and Applications Classification* Index Classification In the absence of a benchmark industry classification system for identifying companies engaged in the global Robotics and Automation industry, the ROBO-STOX® Industry Classification was created in consultation with leading academic and industry experts. The ROBO-STOX® Industry Classification provides an industry analysis framework for investment research, portfolio management and asset allocation. Technology - captures all index companies that manufacture or provide services related to any machinery, equipment, devices or sensors supporting a robot performing its task. It also includes those companies that provide key- enabling software and processing technologies used to advance the conversion to autonomous systems. Essentially, we are looking at the companies that enable robots to sense, process and act. Applications - highlights all index companies that incorporate multiple robotic and automation technologies into their product or manufacturing process to improve efficiency in traditional business lines as well as the development of entirely new business propositions. Geographic Breakdown* Index Methodology The ROBO-STOX® Global Robotics and Automation UCITS Index is maintained by a team of financial and robotics experts to ensure that it remains a leading indicator of the industry. The Index is global, deliberately broad and built for the long term which reflects the early stages of the Robotics and Automation industry. Including all players in a proportionate and equally weighted fashion ensures that we capture the overall growth trend while minimizing company-specific risk. Mid-Cap (USD2bn to USD10bn) 40% Small-Cap (less than USD2bn) 38% Large-Cap (greater than USD10bn) 22% United States 36% Japan 28% Germany 8% Taiwan 7% Switzerland 4% France 3% Israel 2% Canada 2% United Kingdom 2% Others 8% Application 52% Manufacturing & Ind. Automation 19% Healthcare 10% Energy 5% Logistics Automation 5% Security 5% 3D Printing 4% Consumer Products 3% Agriculture 1% Technology 48% Actuation 15% Processing 12% Computing 8% Sensing 7% Integration 6% Market Capitalization Breakdown* The Index is made up of “bellwether” (40%) and “non-bellwether” (60%) companies. Bellwether companies (BWs) are well established leading players, whose core business is directly related to Robotics and Automation. Non-bellwether companies (NBWs) have a distinct portion of their business and revenue in Robotics and Automation and have the potential to grow through innovation and/or market adoption of their products and/or services. Within BW and NBW each constituent is equally weighted. This approach avoids the large capitalisation and “buy high, sell low” biases of market capitalisation indices and ensures that the Index provides exposure to companies in the early stages of new innovation and technologiesas well as the more established players. The 40/60 weighting results in each BW having roughly twice the weight of each NBW. Index constituents are initially selected from the ROBO-STOX® Industry Classification in accordance with predetermined rules and objective criteria including minimum market capitalisation and average daily value traded. At each quarterly rebalance the Index constituents are reweighted and any additions or deletions are made as determined by the Advisory Index Committee at ROBO- STOX® . Companies included are publicly listed on bourses around the world, and derive a substantial portion of revenues from Robotics and Automation related activities. ROBO-STOX® is responsible for the classification of companies within the ROBO-STOX® Industry Classification and maintenance of the database. Within the ROBO-STOX® Industry Classification, companies are classified as either BW or NBW and then further organised into sub-sectors which are expected to increase in number as the industry continues to evolve. Currently, the Classification Committee at ROBO-STOX® has identified 13 sub-sectors which fall under either Technology or Applications. *Charts are presented based on number of companies in each category. Web: www.robostox.com Email: enquiries@robostox.com Page 2
- 3. The ROBO-STOX® Global Robotics and Automation UCITS Index as of June 23, 2015 Securities Monthly Performance Feb MayAprMar Aug YTDJul NovJan DecOctSepJun 2015 -2.95% 5.16% 0.95% 0.48% -0.18% 0.32% 3.67% 2014 6.93% -3.90% 0.71% -3.98% -0.69% 1.35% -1.32% -1.31% Performance Sub-Sector 6M* 12M* HIWIN TECHNOLOGIES Actuation -19.4% -31.5% CYBERDYNE INC Healthcare 11.9% - KUKA Manufacturing & Ind. Automation 28.4% 68.7% KRONES Manufacturing & Ind. Automation 16.6% 26.9% OCEANEERING INTL INC Energy -20.5% -38.9% ROCKWELL AUTOMATION INC Integration 10.9% -0.7% LINCOLN ELECTRIC HOLDINGS Actuation -9.4% -8.4% YASKAWA ELECTRIC CORP ORD Manufacturing & Ind. Automation 3.6% 35.2% OMRON CORP ORD Sensing 7.2% 33.3% IROBOT CORP Consumer Products -5.1% -15.8% INTUITIVE SURGICAL INC Healthcare -5.6% 23.2% AEROVIRONMENT INC Security -0.6% -14.1% FANUC CORP Manufacturing & Ind. Automation 31.5% 46.0% NABTESCO CORP ORD Actuation 7.0% 34.5% ABB LTD-REG Integration -2.2% 0.8% ACCURAY INC Healthcare -3.8% -23.2% KEYENCE CORP ORD Sensing 26.1% 53.0% FARO TECHNOLOGIES INC Processing -25.6% -2.5% COGNEX CORP Processing 18.0% 25.6% YUSHIN PRECISION EQUIPMENT Manufacturing & Ind. Automation - - Sensing 41.6% 11.4%IMMERSION CORPORATION Computing 18.5% 25.2%YOKOGAWA ELECTRIC CORP ORD Actuation -15.6% -25.6%TECO ELECTRIC & MACHINERY CO LTD Actuation 6.7% -8.3%JENOPTIK AG 3D Printing -51.9% -64.2%STRATASYS LTD 3D Printing -30.5% -62.2%3D SYSTEMS CORP Logistics Automation 38.4% 21.8%CARGOTEC OYJ-B SHARE Actuation -5.9% -JOHNSON ELECTRIC HOLDINGS LTD ORD Processing 20.4% 1.2%LEONI Integration 7.5% -6.2%SCHNEIDER ELECTRIC SA Manufacturing & Ind. Automation 13.0% 37.1%DAIHEN CORP Consumer Products - -PARROT SA Actuation 51.8% -HARMONIC DRIVE SYSTEMS INC 3D Printing 1.0% -26.9%ARCAM AB Integration 2.1% -2.0%SIEMENS Computing 16.7% 30.1%TOPCON CORP Actuation -12.4% -20.5%DELTA ELECTRONICS INC Logistics Automation 5.5% 27.0%SFA ENGINEERING CORP Actuation 20.6% 39.8%SMC CORP ORD Security 29.9% 39.1%ELBIT SYSTEMS LTD ORD Performance Sub-Sector 6M* 12M* Processing 23.3% -MOBILEYE NV Energy -35.1% -46.0%HELIX ENERGY SOLUTIONS GROUP Healthcare 15.7% 24.7%QIAGEN NV Actuation 25.9% -IPG PHOTONICS CORP Manufacturing & Ind. Automation 11.0% 28.5%DENSO CORP ORD Manufacturing & Ind. Automation 26.7% 32.6%AIDA ENGINEERING LTD Energy -10.9% -FMC TECHNOLOGIES INC Agriculture 3.1% 2.5%DEERE & CO Manufacturing & Ind. Automation -4.2% 23.0%BROOKS AUTOMATION INC Logistics Automation 15.3% 25.6%JOHN BEAN TECHNOLOGIES CORP Computing 9.6% 1.5%MICROCHIP TECHNOLOGY INC Manufacturing & Ind. Automation 5.8% 3.8%ATS AUTOMATION TOOLING SYSTEMS Actuation -4.8% 10.8%THK CO LTD ORD Processing -0.9% -1.1%NATIONAL INSTRUMENTS CORP Processing 36.3% -28.5%DASSAULT SYSTEMES SA Computing -3.2% -ADVANTECH CO LTD ORD Security -1.9% 6.8%MACDONALD DETTWILER & ASSOC COM Computing 23.7% 10.9%ATMEL CORP Manufacturing & Ind. Automation 22.9% 24.5%TOSHIBA MACHINE CO LTD Processing -13.2% -37.2%TRIMBLE NAVIGATION LTD Manufacturing & Ind. Automation 3.2% -2.3%NACHI-FUJIKOSHI CORP ORD Computing 13.3% 28.4%MITSUBISHI ELECTRIC CORP Processing 48.3% -E2V TECHNOLOGIES PLC Sensing 5.0% 11.3%TELEDYNE TECHNOLOGIES INC Sensing 18.0% 44.1%RENISHAW PLC Logistics Automation 20.2% -KARDEX AG-REG Computing 42.0% -ADLINK TECHNOLOGY INC Processing 25.7% -6.8%NUANCE COMMUNICATIONS INC Manufacturing & Ind. Automation 1.6% -1.0%NORDSON CORP Actuation -33.5% -38.8%AIRTAC INTERNATIONAL GROUP Security 8.6% 34.1%NORTHROP GRUMMAN CORP Healthcare 6.5% 16.1%TECAN GROUP AG-REG Healthcare -0.5% 3.3%VARIAN MED.SYS. Energy 21.3% -KONGSBERG GRUPPEN ASA 3D Printing - -SLM SOLUTIONS GROUP AG Processing -7.0% -12.0%FLIR SYSTEMS INC Manufacturing & Ind. Automation - -TERADYNE INC Computing 2.3% 4.1%HOLLYSYS AUTOMATION TECHNOLO Healthcare -34.7% -39.5%ELEKTA AB Logistics Automation - -DAIFUKU CO LTD (BOLDED companies are BW's) *Performance of the components based on net price data. Web: www.robostox.com Email: enquiries@robostox.com Page 3
- 4. The ROBO-STOX® Global Robotics and Automation UCITS Index as of June 23, 2015 Copyright © 2014 by ROBO-STOX Partners Ltd (“ROBO-STOX”). All rights reserved. ROBO-STOX® is a registered trademark of ROBO-STOX LLC, a Texas (USA) limited liability company and a trademark of ROBO-STOX. ROBO-STOX is a company incorporated in the Cayman Islands, whose registered office is at Trident Trust Company (Cayman) Limited, Fourth Floor, One Capital Place, PO Box 847, Grand Cayman, KY1-1103, Cayman Islands. The ROBO-STOX® Global Robotics and Automation UCITS Index and ROBO-STOX® Global Robotics and Automation UCITS Price Return Index (each an "Index" and together the “Indices”) are the property of ROBO-STOX, which has contracted with Solactive AG to calculate and maintain the Indices. Redistribution, reproduction and/or photocopying of these materials in whole or in part are prohibited without written permission. Nothing on this website shall constitute an offer of services in jurisdictions where ROBO-STOX does not have the necessary licences. All information provided by ROBO-STOX is impersonal and not tailored to the needs of any person, entity or group of persons. The Global Industry Classification Standard (GICS® ) was developed by and is the exclusive property and a trademark of Standard & Poor’s and MSCI. * Past performance of an index is not a guarantee of future results. The value of investments may go down as well as up and potential investors may not get back the amount originally invested. It is not possible to invest directly in an index. Exposure to an asset class represented by an index is available through investable instruments based on that index ("Investment Funds"). ROBO-STOX makes no assurance that such Investment Funds or other investment vehicles will accurately track Index performance or provide positive investment returns. A decision to invest in any such Investment Fund or other investment vehicle should not be made in reliance on any of the statements set forth in this document. ROBO-STOX is not in a position to give advice on the suitability of any investments for potential investors. Prospective investors are advised to make an investment in any such Investment Fund or other vehicle only after carefully considering the risks associated with investing in such funds, as detailed in an offering memorandum or similar document that is prepared by or on behalf of the issuer of the Investment Fund or other vehicle and after taking specialist independent tax and financial advice. Inclusion of a security within an Index is based on the views of ROBO-STOX at the time of publication, which are subject to change, and is not a recommendation by ROBO-STOX to buy, sell, or hold such security, nor is it considered to be investment advice. Historical performance illustrations in the Indices are based on a backcast calculation. A backcast calculation can be materially different from a backtest analysis. No Investment Fund or other investment vehicle based on the Indices is sponsored, promoted, sold or supported in any other manner by ROBO-STOX or Solactive AG (the “Index Parties”) nor do the Index Parties offer any express or implicit guarantee or assurance either with regard to the results of using the Indices and/or an Index trademark or an Index price at any time or in any other respect. The Indices are calculated and published by Solactive AG. The Index Parties use their best efforts to ensure that the Indices are calculated correctly. Irrespective of their obligations towards the Company, the Index Parties have no obligation to point out errors in the Indices to third parties including but not limited to investors in, and/or financial intermediaries of, any Investment Funds or other investment vehicles. Neither publication of the Index by Solactive AG nor the licensing of the Indices or an Index trademark by ROBO- STOX for the purpose of use in connection with any Investment Fund or other investment vehicle based on the Indices constitutes a recommendation by the Index Parties to invest capital in any such fund or investment vehicle nor does it in any way represent an assurance or opinion of the Index Parties with regard to any investment in such fund or investment vehicle. It is not intended that anything stated in this website should be construed as an offer or invitation to buy or sell any investment in any Investment Fund or other investment vehicle referred to in this website, or for potential investors to engage in any investment activity. These materials have been prepared solely for informational purposes based upon information generally available to the public from sources believed to be reliable. No content contained in these materials (including index data, ratings, credit-related analyses and data, model, software or other application or output therefrom) or any part there of (the "Content") may be modified, reverse- engineered, reproduced or distributed in any form by any means, or stored in a database or retrieval system, without the prior written permission of ROBO-STOX. The Content shall not be used for any unlawful or unauthorized purposes. ROBO-STOX and its third- party data providers and licensors (collectively “ROBO-STOX Parties”) do not guarantee the accuracy, completeness, timeliness or availability of the Content. ROBO-STOX Parties are not responsible for any errors or omissions, regardless of the cause, for the results obtained from the use of the Content. The Content is provided on an “as is” basis. ROBO-STOX Parties, to the extent permitted by applicable law, disclaim any and all express or implied warranties, including, but not limited to, any warranties of merchantability or fitness for a particular purpose or use, freedom from bugs, software errors or defects, that the functioning of the Content will be uninterrupted or that the Content will operate with any software or hardware configuration. In no event shall ROBO-STOX Parties be liable to any party for any direct, indirect, incidental, exemplary, compensatory, punitive, special or consequential damages, costs, expenses, legal fees, or losses (including, without limitation, lost income or lost profits and opportunity costs) in connection with any use of the Content even if advised of the possibility of such damages. ROBO-STOX Parties and their respective employees, affiliates and partners hereby exclude, to the extent permitted by applicable law, all liability in connection with the use of this website. ROBO-STOX Partners Ltd and third parties from whom ROBO-STOX Partners Ltd receives information assume no liability for the correctness, completeness, timeliness, accuracy or availability of this information. ROBO-STOX Partners Ltd has not independently verified the information presented and assumes no liabilitty for losses caused by the use of this information. This information does not constitute investment advice. Use this information at your own risk. General Disclaimer Web: www.robostox.com Email: enquiries@robostox.com Page 4