SlideShare uma empresa Scribd logo
1 de 17
Baixar para ler offline
Student Investment Management, Analyst Report
Alex Osterhage, Initiating Coverage
Osterhage.8@osu.edu, (937)545-5740
Electronic Arts Inc.
Investment Concers
 EA’s most popular franchises could lose popularity
and cause large decreases in revenues.
 Proprietary and licensed IP are keys to game
popularity and must be continually developed or
acquired.
 Management must continue to commit the
workforce to core strategies
 Discretionary income and leisure time are major
drivers of EAs revenue growth. Discretionary
income has steadily increased since the recent
recession and is expected to decrease through
2020.
 The interactive gaming industry is constantly
evolving. Game developers must constantly
release new games with new features and
experiences to maintain market share. This causes
significant R&D expenses.
EA develops, produces and distributes software for interactive
video games to be used on a variety of platforms including Xbox,
PlayStation, Wii, mobile devices and PCs. EA is responsible for
some of the most successful game franchises of all time including
Madden, FIFA and Star Wars: Battlefront. The company operates
through three divisions: EA Studios, EA Mobile and Maxis.
Investment Thesis
 Initiating coverage with a BUY rating from a weighted
average combination of a DCF and relative valuation
models at a target price of $68.23 (7.8% upside)
 EA is well positioned in the Video Game Software
Publishing Industry with a 9.4% market share. This
industry is expecting 7.5% average growth to 2020
 EPS is forecasted to grow from $2.69 in 2015 to $3.75
(71% increase) in 2018 on the following value drivers:
o EAs commitment to the shift from packaged
goods to digital downloads
o A focused product portfolio consisting of the most
popular franchises
o The continued expansion and development of
these popular franchises
o Maintained relationships with critical channel and
intellectual property partners
March 8th
, 2016 Fisher College of Business Electronic Arts (EA)
2 | P a g e
Analyst: Alex Osterhage
Table of Contents
Company Overview....................................................................................3
Profile ..............................................................................................3
Revenue Breakdown .......................................................................3
Company Strategies........................................................................5
Global Operations............................................................................5
Operating Structure .........................................................................6
Intellectual Property (IP) ..................................................................6
Leadership.......................................................................................6
Competition .....................................................................................6
Sustained Competitive Advantage and Value Drivers .....................7
Recent News ...................................................................................8
Investment Thesis ......................................................................................9
Economic Factors............................................................................9
Financials ......................................................................................10
DCF Valuation ...............................................................................12
Key Assumptions...........................................................................12
Sensitivity Analysis ........................................................................12
Multiples ........................................................................................13
Price Triangulation.........................................................................13
Concerns to Recommendation.................................................................14
Competition ...................................................................................14
Game Franchise Value-Add ..........................................................14
Developing and Acquiring IP .........................................................14
Commitment to Core Strategies. ...................................................15
Changing the Interactive Gaming Landscape................................15
Conclusion ...............................................................................................16
References...............................................................................................17
March 8th
, 2016 Fisher College of Business Electronic Arts (EA)
3 | P a g e
Analyst: Alex Osterhage
Company Overview
Electronic Arts (hereafter “EA” or “The Company”) was founded in 1982 by Trip Hawkins
on the premise that interactive media would one day be more important than traditional
media such as TV and movies. Since then, video games and other interactive media
have surpassed traditional media in annual revenue and revenue per unit. Video game
development has become a world-renowned and influential art taught at top universities
across the globe. EA is one of a select few companies leading the interactive
entertainment industry into the future through their company strategies, brands and
platforms, global operations, operating structure, intellectual property and leadership.
Profile
EA currently enjoys a 9.4% market share of the video game software publishing industry
(IBIS). They are second only to Activision Blizzard, maker of Guitar Hero and Call of
Duty, at 9.8%. Top grossing games for EA include all of the FIFA, Madden, Star Wars:
Battlefront, Sims and Need for Speed franchises. Every product offered by EA can be
played on consoles like the Xbox One, PlayStation 4 and platforms like computers and
mobile devices. The company relies on continued popularity of these franchises,
consoles and platforms among the gaming community through yearly redesigns and
releases.
Revenue Breakdown
EA operates on a fiscal year that begins on April 1st and runs to March 31st. The
company breaks GAAP compliant revenue down into two segments, Product and
Service and Other. Product revenues include the sale of software games or related
content (either digitally downloaded or physically purchased) and the licensing of
software to third-parties. Service and Other revenues are made up of subscriptions and
games or related content that requires EA to provide hosting services. Games or related
content that require hosting services require an internet connection and include micro-
transactions for social network and free-to-download games like the hugely popular
2,568
1,947
2015 Revenue by
Segment
($ in mm)
Product Service and Other
1,5401,546
2015 Operating Profit by
Segment
($ in mm)
Product Service and Other
March 8th
, 2016 Fisher College of Business Electronic Arts (EA)
4 | P a g e
Analyst: Alex Osterhage
Plants vs Zombies. Product revenues were $2,568mm in 2015 compared to Service and
Other revenues at $1,947mm. Product segment operating profit was $1,546mm in 2015
compared to $1,540mm operating profit in the Service and Other segment. Product
costs as a percentage of Product sales were 60% in 2015 compared to Service and
Other costs at 79% of Service and Other sales. In total, EA recognized $4,515mm in
GAAP revenue in 2015 compared to $3,575mm in 2015 and expects $4,250mm in 2016
on the releases of the latest versions of Madden, FIFA and Need for Speed.
EA also breaks revenue down into two, non-GAAP segments, Packaged Goods and
Digital. This breakdown is used internally as a way for management to more accurately
analyze operating performance as well as plan and forecast better for the future.
Packaged Goods revenue is comprised primarily of software with a physical delivery
through traditional channels like the retailers GameStop and BestBuy. Driven by sales
of FIFA 15 and Madden NFL 15, Packaged Goods revenue was $2,809mm in 2015
compared to $2,228mm in 2015. This decrease was caused not only by the slowdown
in sales and decrease in popularity of Battlefield and Need for Speed in addition to the
loss of the NCAA Football franchise, but the increase in popularity of Digital sales.
Digital sales increased from $1,793mm to $2,230mm 2014 to 2015 due primarily to a
shift in the video game industry from physical software to digital downloads. EA
distributes digital software through direct downloads from the internet including full-
game downloads to consoles, extra content, subscriptions and mobile games. The
increase in Digital sales, like Packaged Goods, was driven by FIFA 15 in addition to
Dragon Age: Inquisition and The Sims 4. The differentiator for EA when it comes to
Digital sales was a 40% increase in subscription sales driven by Battlefield 4 Premium,
FIFA 15 Online and the releases of the new FIFA 15 Ultimate Team and Madden
Ultimate Team. The Ultimate Team release is a new way for EA to engage players for
longer by offering the ability to buy and sell “cards” representing different players and
71%
56% 55% 53% 55%
29%
44% 45%
47% 45%
$0
$500
$1,000
$1,500
$2,000
$2,500
$3,000
$3,500
2012 2013 2014 2015 2016
Non-GAAP Segment Revenue
($ in millions and % of total revenue)
Packaged Digital
March 8th
, 2016 Fisher College of Business Electronic Arts (EA)
5 | P a g e
Analyst: Alex Osterhage
coaches. Management believes this new feature emulates managing a team and gives
players a sense of ownership which drives prolonged game use.
Company Strategies
EA is committed to three core strategies including Players First, Commitment to Digital
and One EA. The company desires to build deep relationships with players by creating
games with “long-lasting fun and enduring value”. Management believes this
commitment has led to over 165mm active users on mobile titles and a leading position
among publishers for Xbox One and PlayStation 4. The gaming industry is shifting from
disc-based games to digital downloads that include full-game downloads and additional
content and service downloads. EA has taken this shift as an opportunity to expand
relationships with consumers who are increasingly engaging in game play for longer
periods of time due to ease of use with digital downloads. Consumers are able to
download games and additional content directly to consoles instead of traveling to
retailers like GameStop and BestBuy. Digital revenue is higher-margin than Packaged
Goods and management believes this margin will increase into 2016. To increase
operational speed with improved fiscal discipline, EA management has undertaken a
cultural shift towards a more flexible and feedback focused organization. Engaging
consumers with alpha’s and beta’s (pre-market released games) has helped the
company to release games and content that is “truly consumer focused”.
Global Operations
Due to the massive global popularity of EA game franchises, the company had
international revenues (countries other than the U.S. and Canada) of $2,559mm,
representing 57% of total revenue for 2015. This was a 24% increase from 2014
primarily driven by sales of FIFA 15 and Madden which represented 15% and 13.3% of
total global revenue in 2015, respectively.
15.0%
7.9%
13.3%
Revenue by Game Title
FIFA Madden Other
1,701
1,510
1,956
2,096 2,065
2,559
-$400
$100
$600
$1,100
$1,600
$2,100
$2,600
2013 2014 2015
Revenue by Region
U.S. and Canada International
March 8th
, 2016 Fisher College of Business Electronic Arts (EA)
6 | P a g e
Analyst: Alex Osterhage
Operating Structure
EA is broken down operationally into three divisions, EA Studios, EA Mobile and Maxis.
EA Studios is the largest of the three and is responsible for the development of the most
popular game franchises such as FIFA and Madden. EA Studios is a collaborative
organization with all team members working closely through shared technologies to
enhance idea sharing. This division also works with external game developers like
Respawn Entertainment to create collaborations like Titalfall and share publishing and
distribution relationships. EA Mobile is responsible for the creation and improvement of
games like Plants vs Zombies and others to be played on mobile phones and tablets.
The Sims franchise was developed by Maxis, a wholly-owned subsidiary responsible for
creating games intended to spawn player creativity.
Intellectual Property (IP)
The success of EA is based heavily on the “creation, acquisition, exploitation and
protection” of IP. A portion of EA IP is developed in-house or acquired and a portion is
obtained from third-parties that allow EA to license their IP. These licenses included
sports leagues and players associations and film and music companies. The company
is very engaged in protecting these IP’s through copyrights, trademarks and other copy
protection technologies.
Leadership
Andrew Wilson has held the seat of CEO and Director since 2013. He has been with the
company since 2000 in many roles and was ranked as #3 on Fortune Magazine’s
Business Person of the Year list in 2015 behind Mark Zukerberg and Mark Parker.
Aiding Wilson is CFO Blake Jorgensen who has been with EA since 2012 after a stint
with Yahoo! The two have worked together to align the company around their three core
strategies, Players First, One EA and the Commitment to Digital. They also have set
and met a goal for non-GAAP operating margin of over 20%.
Competition
EA competes with many companies in the video game and entertainment industries.
The majority of competition is for consumer discretionary income and leisure time. Not
only does the company compete directly for customers business but it competes for
licensing agreements from different third-parties for IP as well. EA uses these IP’s in
their products to make them more appealing and exciting to customers. The failure to
secure different third-party IP is a major risk for EA. Some major areas of competition
for the company include “game quality and ease of use, compatibility of products with
certain platforms, online capability, price and quality of customer service” (10k).
March 8th
, 2016 Fisher College of Business Electronic Arts (EA)
7 | P a g e
Analyst: Alex Osterhage
Competition For Games in:
Console Devices
and PC's
Mobile
Devices
PC Free-to-
Download
Sony Supercell Tencent
Microsoft KING Nexon
Activision Blizzard
GungHo
Online Valve
Take-Two
Interactive
Activision
Blizzard
Ubisoft
The toughest competitive landscape for EA is in console devices and PC’s due to the
resources of competition like Activision Blizzard, Take-Two Interactive and Ubisoft. Like
EA, these companies develop games to be played on consoles created by Sony and
Microsoft who also create software to be used on their consoles. Mobile device
competition is a rapidly expanding and changing marketplace that requires EA to
constantly develop new games. The environment is filled with many small competitors
who specialize in developing or acquiring games with a popular life of a few weeks.
Management expects this competition to continue to intensify as new developers enter
the marketplace. Similar to mobile device is PC Free-to-Download competition where
many competitors are frequently introducing new online gaming services. Management
expects intensified competition for similar reasons.
Sustained Competitive Advantage and Value Drivers
For EA, significant relationships with channel partners and third-party IP providers, the
continued commitment to digital downloads, a more focused product portfolio and the
continuation of game franchises are keys to success.
Sony and Microsoft authorize EA to develop games for their consoles. Without these
relationships, EA would have lost almost 50% of their Digital revenue in 2015 from the
loss of Xbox One (MSFT), PlayStation 4 (SNE) and some mobile game platforms.
719 673 638
581 668
1,068
363 452
524
-$200
$300
$800
$1,300
$1,800
$2,300
2013 2014 2015
Digital Revenue by Platform
($ in mm)
PC and Other Console Mobile
March 8th
, 2016 Fisher College of Business Electronic Arts (EA)
8 | P a g e
Analyst: Alex Osterhage
EA must maintain relationships with third-party IP providers for a continued competitive
advantage. For example, if the NFL Players Association decided that EA could no
longer use the license for professional football players’ likeness or the NFL logo and
copyrights, EA would have lost 7.9% of revenue in 2015 from the loss of the Madden
franchise. Historically, the NFL has enjoyed its relationship with EA due to the increase
in brand recognition from the franchises popularity among American consumers. EA has
similar relationships with other third-party IP providers and must maintain them into the
future.
Like mentioned earlier, EA is one of the video game development companies leading
the industry into the future with their commitment to digital downloads. Consumers enjoy
the ease of use with these products and would lose interest in EA games if the
development of digitally available games and content wasn’t available.
In the past, EA has release a broad range of products and has recently narrowed the
scope of their portfolio to focus on the most successful game franchises. These
franchises represent a majority of revenues for the company through their continued
popularity. This popularity is driven by the company’s ability to constantly add value
through new game elements like the Ultimate Team function in sporting games such as
FIFA and Madden. For EA to maintain this competitive advantage, they must continue
providing an improved gaming experience. This explains why R&D expenses have been
so extensive historically.
Recent News
In May of 2015, EA reported a new stock repurchase program where up to $1b of
common stock will be purchased. In the old repurchase plan, 8.3mm shares were
repurchased for $337mm in the open market and through private transactions.
$1,153
$1,125
$1,094
$1,196
$1,178
$1,217
$1,022
$1,042
$1,062
$1,082
$1,102
$1,122
$1,142
$1,162
$1,182
$1,202
$1,222
2013 2014 2015 2016E 2017E 2018E
R&D Expenses
($ in mm)
March 8th
, 2016 Fisher College of Business Electronic Arts (EA)
9 | P a g e
Analyst: Alex Osterhage
According to management, game releases
for 2016 will follow the schedule to the left. It
is easy to see that game franchises are a
majority of EA’s releaes. FIFA, Madden,
NBA Live and NHL are examples of
franchises that are redesigned and released
every year with improved game play, new
features and new content. Consumers have
come to expect new versions of these
franchises each year and EA has to live up
to expectiations or risk losing business to
other companies like Activision or Ubisoft.
Investment Thesis
Coverage is being initiated on EA with a BUY rating at a target price of $68.23 (7.8%
upside potential) from a weighted average combination of a DCF and relative
valuations. These valuations are driven primarily by EA’s sustained competitive
advantages, favorable market positioning and management’s commitment to their core
strategies.
Economic Factors
According to IBIS World, the video game software
publishing industry experienced a 10.3% growth rate
from 2010 to 2015. They predict this growth rate to
slow to 7.5% for 2015 to 2020. EA is well positioned
with a market share of 9.4% and expects market
share to increase with new product releases, an
essential to maintaining market share according to
IBIS World. Thanks to increases in mobile phone
ownership from 35% to 64% (2010 to 2015), video
games can now reach a much broader audience. EA is
once again well positioned to realize a portion of that
growth thanks to their commitment to digital downloads
and the EA Mobile organization which publishes or
acquires interactive games for mobile phones and
tablets.
Leisure time and disposable income are major
determinants of consumer’s ability to pay for and play
video games. Disposable income has been steadily
March 8th
, 2016 Fisher College of Business Electronic Arts (EA)
10 | P a g e
Analyst: Alex Osterhage
increasing since the recent recession and is expected to decrease slightly through
2020. Leisure time has historically been flat with a growth rate of .3% from 2010 to
2015. This rate is expected to decrease to .2% for 2015 to 2020. Even at this low
growth rate, consumes are still estimated to spend an average of 5.28 hours a day on
leisure. These factors pose both an opportunity and a threat for EA seeing as how they
can take advantage of recent increases in disposable income but must be wary of flat
leisure growth.
Financials
In Millions 2011A 2012A 2013A 2014A 2015A 2016E 2017E 2018E
Net revenue:
Product $3,181 $3,415 $2,738 $2,134 $2,568 $2,722 $2,913 $3,146
Growth 7% -20% -22% 20% 6% 7% 8%
% of Total Rev 89% 82% 72% 60% 57% 57% 57% 57%
Service and other 408 728 1,059 1,441 1,947 2,064 2,208 2,385
Growth 78% 45% 36% 35% 6% 7% 8%
% of Total Rev 11% 18% 28% 40% 43% 43% 43% 43%
Total net revenue 3,589 4,143 3,797 3,575 4,515 4,786 5,121 5,531
Growth 15% -8% -6% 26% 6% 7% 8%
Cost of revenue:
Product 1,407 1,374 1,085 1,032 1,028 1,196 1,178 1,272
Service and other 92 224 303 315 401 431 410 442
Total cost of revenue 1,499 1,598 1,388 1,347 1,429 1,627 1,587 1,714
Gross profit 2,090 2,545 2,409 2,228 3,086 $3,159 $3,533 $3,816
% of Total Rev 58% 61% 63% 62% 68% 66% 69% 69%
Operating expenses:
R&D 1,153 1,212 1,153 1,125 1,094 1,196 1,178 1,217
Marketing and sales 474 853 788 680 647 670 666 719
G&A 301 375 354 410 386 431 461 498
Acquisition Expense -17 11 -64 -35 -3 -48 -51 -55
Amortization 57 43 30 16 14 24 26 28
Restructuring 161 16 27 -1 0 48 51 0
Operating expenses 2,402 2,510 2,288 2,195 2,138 2,321 2,330 2,406
Operating income -312 35 121 33 948 838 1203 1410
% of Total Rev -9% 1% 3% 1% 21% 18% 24% 26%
Investments 23 0 39 0 0 0 0 0
Interest 10 -17 -21 -26 -23 -48 0 -55
Income before taxes -279 18 139 7 925 790 1,203 1,355
Taxes -3 -58 41 -1 50 47 120 136
Net income -276 76 $98 $8 $875 742 1,083 1,219
% of Total Rev -8% 2% 3% 0% 19% 16% 21% 22%
March 8th
, 2016 Fisher College of Business Electronic Arts (EA)
11 | P a g e
Analyst: Alex Osterhage
Like mentioned earlier, EA breaks GAAP compliant revenue down into Product and
Service and Other. The Product segment recognized an average of -4% revenue growth
at an average of 68% of total revenue from 2011 to 2015. I forecast a 7% growth rate
and 57% of total revenue for this segment from 2016 to 2018 based on EA’s ability to
take advantage of increased discretionary income through new product offerings and
the continued improvement of current franchise games like FIFA and Madden. The
Service and Other segment grew at an average of 49% from 2011 to 2015 at 32% of
total revenue. For 2015 to 2018, I forecast 7% growth and an increase to 43% of total
revenue for this segment primarily on the 30mm game sessions of Battlefield Hardline
played, 200mm hours of Dragon Age: Inquisition played and 16mm average monthly
players for The Simpson: Tapped Out, among others. The preceding represent
subscriptions that EA has introduced recently and that have helped boost the Service
and Other segment to be a major contributor to total company revenue.
I expect total company revenue to grow from $4,786 in
2016 to $5,531 in 2018 which is just outside of
consensus estimates of $4,527 in 2016 and $5,205 in
2018. In terms of earnings per share, my estimates are
also slightly more optimistic than consensus due to the
implementation of the second share repurchase program
that was announced in May of 2015. Further, I assume
that management will maintain competitive advantages
like a focused product portfolio and expanded market
share in the mobile segment.
As can be seen by the chart on the
right, the Product segment is
responsible for a majority of
revenue costs even as the Service
and Other segment is increasing in
terms of percentage of total
revenue. This is due to the high-
margin nature of Product revenues.
Producing physical software for
game consoles is far more
expensive per unit than providing
subscription and hosting services in
the Service and Other Segment.
RevenueComparison($inmillions)
Year 2016E 2017E 2018E
Analyst 4,786 5,121 5,531
Consensus 4,527 4,835 5,205
EPSComparison
Year 2016E 2017E 2018E
Analyst 2.28 3.33 3.75
Consensus 2.28 3.26 3.56
$1,085 $1,032 $1,028
$1,196 $1,178 $1,272
$303 $315 $401
$431 $410
$442
$0
$200
$400
$600
$800
$1,000
$1,200
$1,400
$1,600
$1,800
2013 2014 2015 2016E 2017E 2018E
Cost of Revenue by Segment
($ in mm)
Product Service and other
March 8th
, 2016 Fisher College of Business Electronic Arts (EA)
12 | P a g e
Analyst: Alex Osterhage
DCF Valuation
Key Assumptions
Discount Rate – A terminal discount factor of 10% was chosen for the DCF model. This
factor is reflective of the relatively stable nature of EA’s business. A discount factor of
12% is used for risky companies while 8% is used for extremely stable companies. EA
is currently in the middle of a growth trend but faces some macro risks that will slow
growth to a stable rate in the near future.
Terminal FCF Growth Factor – A terminal factor of 5% was appropriate for this
valuation. While 5% is an inflated terminal factor, EA will continue to grow and expand
into the future. The company has only just recently increased operating margin above
20%. This was a major goal for CEO Andrew Wilson that will be maintained if the
company is able to stay committed to core strategies.
Sensitivity Analysis is appropriate to
analyze what happens to the implied price
if assumptions change. We see a range of
$50 to $112 due to the broad growth rate
range. As the growth and discount rate
increase, price increases as well.
Terminal Discount Rate = 10.0%
Electronic Arts (EA) Terminal FCF Growth = 5.0%
Year 2013A 2014A 2015A 2016E 2017E 2018E 2019E 2020E 2021E 2022E 2023E 2024E 2025E
Revenue 3,797 3,575 4,515 4,786 5,121 5,531 6,028 6,511 6,966 7,384 7,754 8,141 8,548
% Grow th -5.8% 26.3% 6.0% 7.0% 8.0% 9.0% 8.0% 7.0% 6.0% 5.0% 5.0% 5.0%
Operating Income 121 33 948 838 1,203 1,410 1,326 1,432 1,533 1,625 1,706 1,791 1,881
Operating Margin 3.2% 0.9% 21.0% 17.5% 23.5% 25.5% 22.0% 22.0% 22.0% 22.0% 22.0% 22.0% 22.0%
Interest and Other (21) (26) (23) (24) (26) (28) (30) (33) (35) (37) (39) (41) (43)
Interest % of Sales -0.6% -0.7% -0.5% -0.5% -0.5% -0.5% -0.5% -0.5% -0.5% -0.5% -0.5% -0.5% -0.5%
Taxes 41 (1) 50 49 118 138 117 126 135 143 150 158 165
Tax Rate 29.5% -14.3% 5.4% 6.0% 10.0% 10.0% 9.0% 9.0% 9.0% 9.0% 9.0% 9.0% 9.0%
Net Income 98 8 875 765 1,060 1,244 1,179 1,274 1,363 1,445 1,517 1,593 1,672
% Grow th -91.8% 10837.5% -12.6% 38.6% 17.4% -5.2% 8.0% 7.0% 6.0% 5.0% 5.0% 5.0%
Add
Depreciation/A 264 227 220 239 307 277 301 326 348 369 388 407 427
% of Sales 7.0% 6.3% 4.9% 5.0% 6.0% 5.0% 5.0% 5.0% 5.0% 5.0% 5.0% 5.0% 5.0%
Plus/(minus)
Changes WC (8) (46) (66) (29) (102) (37) (40) (43) (46) (49) (52) (54) (57)
% of Sales -0.2% -1.3% -1.5% -0.6% -2.0% -0.7% -0.7% -0.7% -0.7% -0.7% -0.7% -0.7% -0.7%
Subtract Cap Ex 106 97 95 144 102 111 151 195 244 295 349 407 427
Capex % of sales 2.8% 2.7% 2.1% 3.0% 2.0% 2.0% 2.5% 3.0% 3.5% 4.0% 4.5% 5.0% 5.0%
Free Cash Flow 248 92 934 832 1,163 1,373 1,290 1,361 1,421 1,469 1,504 1,539 1,615
% Grow th -62.9% 915.2% -11.0% 39.8% 18.1% -6.1% 5.5% 4.4% 3.4% 2.4% 2.3% 5.0%
: 4.4% 4.6% 4.8% 5.0% 5.2% 5.4% 5.6%
8.5% 86.72 89.86 93.33 97.21 101.55 106.46 112.04
9.0% 77.30 79.67 82.28 85.15 88.31 91.83 95.77
9.5% 69.72 71.57 73.57 75.76 78.15 80.77 83.66
10.0% 63.49 64.96 66.54 68.24 70.09 72.10 74.29
10.5% 58.29 59.47 60.73 62.09 63.55 65.13 66.83
11.0% 53.87 54.83 55.86 56.96 58.14 59.40 60.75
11.5% 50.07 50.87 51.72 52.62 53.58 54.60 55.69
Terminal FCF Growth
TerminalDiscount
Factor
March 8th
, 2016 Fisher College of Business Electronic Arts (EA)
13 | P a g e
Analyst: Alex Osterhage
Multiples
As can be seen from the chart below, EA is currently trading at a premium to all of its
peers in terms of earnings per share, EBITDA and book value per share. A P/E
multiplier of 20.7x was used to determine a fair value based on what investors are
willing to pay for peers earnings. The 10.9x EV/EBITDA multiplier is also a median
value for peers. I used slightly inflated multipliers of 12.9x, 3.5x and 7.3x for EV/EBIT,
EV/Rev and P/B, respectively. The median values were returning a moderately low
price and were skewing EA’s implied equity value too far to the downside.
Price Triangulation
Valuation
Market
Cap
P/E EV/EBITDA
NTM
EV/EBIT
NTM
EV/Rev
P/B
DCF
Valuation
ELECTRONIC
ARTS INC
19.65B 32.5x 18.1x 11.4x 3.5x 6.5x
SONY 29.06B -- 5.2x 6.3x 0.4x 1.2x
MICROSOFT 403.45B 17.5x 12.3x 11.8x 3.6x 5.3x
ACTIVISION
BLIZZARD INC
22.85B 32.3x 16.9x 11.8x 3.9x 2.8x
UBISOFT 3.26B 21.2x 4.2x 14.5x 1.9x 3.3x
TAKE-TWO
INTERACTIVE
2.97B -- -- 7.2x 1.3x 5.8x
Multiplier Used 20.7x 10.9x 12.9x 3.5x 7.3x
Implied Equity
Value / Share
$72.35 $66.75 $70.26 $63.55 $70.74 $68.24
Weighting 15% 10% 5% 15% 5% 50%
A target price of $68.23 was calculated using a weighted average combination of a DCF
and relative valuations. These methods were used due to EAs diverse operations and
competitive landscape. The price to earnings (P/E), enterprise value to EBITDA
(EV/EBITDA), next twelve months enterprise to EBIT (NTM EV/EBIT), next twelve
months enterprise value to revenue (NTM EV/Rev) and price to book (P/B) ratios were
determined for EAs most relevant competitors: Sony, Microsoft, Activision Blizzard,
Ubisoft and Take-Two Interactive. These competitor’s relevance to EA was discussed in
Competition above. The P/E ratio is the most critical ratio to use for EA due to the
importance that investors place on earnings and therefore deserves a 15% weighting.
Just as important is the EV/Rev ratio because of investors desire to know how
March 8th
, 2016 Fisher College of Business Electronic Arts (EA)
14 | P a g e
Analyst: Alex Osterhage
expensive it would be to buy a dollar of EA’s sales. The EV/EBITDA ratio is used
because it gives the best picture of a company’s operations without the screw from
interest, taxes, depreciation and amortization. This multiple was given a 10% weighting.
EV/EBIT and P/B ratios are not as critical but still are excellent determinants of
operations and value and received a 5% weighting each. Most critical to this valuation is
the DCF model which received a 50% weighting due to its accuracy in determining
future values.
Concerns to Recommendation
Certain factors must be considered while analyzing EA’s businesses and future
performance. The following factors represent the greatest risks to EA’s stock price,
revenues and customer base. These factors include, but are not limited to, the intensity
of competition, the failure to add value to current game franchises, the failure to develop
or acquire IP, the failure to stay committed to core strategies and the risk that the
interactive gaming landscape will change.
Competition
A majority of the segments that EA operates in have low barriers to entry and therefore
have many players. Further, to remain a competitive entity in the segment, a company
must continually develop and release new games with new features and experiences.
Consumers in the interactive gaming industry are constantly looking for, and willing to
buy, the latest releases and most popular “hits”. EA has historically been a leader in
new “hit” releases but must remain diligent in R&D to stay among the leaders.
Game Franchise Value-Add
As mentioned previously, a majority of EA revenues come from the most popular
franchises like FIFA and Madden. Yearly releases of these games have become
normal and expected for consumers. A disruption to this cycle would cause a significant
loss in revenue for EA not only from loss of unit sales, but from the loss of consumer
interest in the franchise as well. EA must also continue to add new features to
franchises (like the Ultimate Team experience) yearly to maintain consumer interest.
Without new features, consumers will spend their discretionary income and leisure time
on other, “newer” products and experiences.
Developing and Acquiring IP
IP is a huge driver of game success. EA must use their vast resources and R&D
expenses wisely when developing IP or acquiring it through licenses. The company runs
the risk of third-party IP owners refusing to sell licenses. For example, if FIFA (a
regulatory entity for European soccer) decided EA was no longer allowed to use the
FIFA logo or player likenesses, the company would lose a huge portion of revenue
March 8th
, 2016 Fisher College of Business Electronic Arts (EA)
15 | P a g e
Analyst: Alex Osterhage
(15% in 2015). This may seem unlikely due to the revenue that FIFA receives from the
partnership and the brand recognition gained from game popularity, but new committee
members are voted onto the FIFA board occasionally and could have an impact on the
relationship.
Commitment to Core Strategies
EA’s core strategies of Players First, Commitment to Digital and One EA are key to
company culture and business success. Relationships with players are a major focus for
CEO Andrew Wilson as he believes players can provide key insights into what makes a
game better. EA cannot risk losing these key relationships. As the interactive gaming
industry shifts from packaged goods to digital downloads, EA must stay committed to
leading the way. As was mentioned earlier, EA has been quickly growing revenues in
the Digital segment while Packaged Goods are slowly declining. The company must
continue to grow Digital revenues to make up for the loss in Packaged Goods. One EA
is the company’s way to bring all three core strategies full circle through a shift in
company culture to a more feedback focused team. A disruption in this cultural shift
could have seriously negative ramifications like the loss of key leaders from a cultural
misalignment.
Changing the Interactive Gaming Landscape
In the gaming world, new trends gain popularity rapidly, rendering old
trends almost useless. Whenever a new game is released, the older
version instantly drops in value significantly. As you can see from the
chart, prices for FIFA for PlayStation 4 on Amazon.com drop by over
50% after a new version is released. This reinforces management’s
strategy to maintain relationships with consumers to continue to develop newer games
with newer features and experiences each year. Further, EA is faced with the risk that
the interactive gaming industry could stagnate or even deflate. Just as quickly as video
games came to be popular, they could be diminished to an old fad. EA has been
successful as continuing to grow the industry but any decrease in the popularity of
interactive games will hurt company revenue and market share.
FIFA for PS4
FIFA 16 $40.25
FIFA 15 $19.99
FIFA 14 $13.14
March 8th
, 2016 Fisher College of Business Electronic Arts (EA)
16 | P a g e
Analyst: Alex Osterhage
Conclusion
A BUY rating on EA with a target price of $68.23 represents a 7.8% upside to the
current price of $63.59. I am initiating coverage on the company with this rating and
target price due to several factors. First, EA is well positioned within the Video Game
Software Publishing industry, at a 9.4% market share, to take advantage of an average
expected industry growth of 7.5% through 2020. Second, I forecast EPS will grow by
71% from 2015 to 2018 ($2.69 to $3.75) on such value drivers as EA’s commitment to a
focused product portfolio and the shifting from Packaged Goods to Digital Downloads.
This EPS estimate is also backed by the recent stock repurchase plan which will yield
positive results for price per share. Further, my target price is supported by a continued
expansion and development of popular game franchises like Madden, Star Wars
Battlefront and FIFA. Finally, critical channel and IP partner relationships must be
maintained for EA to continue to grow revenues through new games, new features in
existing franchises and a new focus on mobile gaming.
March 8th
, 2016 Fisher College of Business Electronic Arts (EA)
17 | P a g e
Analyst: Alex Osterhage
Resources
 Capital IQ Data – Accessed on Ohio State Campus
 Bloomberg Data – Accessed on Ohio State Campus
 Credit Suisse Equity Research Report. Ju, Ford, Yang and Yadgaran. 1/29/16
 Capital IQ Equity Research Report. Kessler. 2/27/16
 IBIS World Industry Reports (iExpert Industry Summary 51121e)
 EA Investor Relations
o EA FY 2014 Earnings Presentation
o EA FY 2014 10-K Filing
o EA FY 2015 Earnings Presentation
o EA FY 2015 Earnings Call Transcript
o EA FY 2015 10-K Filing
 Amazon.com
 TD Ameritrade.com
 Yahoo! Finance

Mais conteúdo relacionado

Mais procurados

Sony - Corporate Social Responsibity
Sony - Corporate Social ResponsibitySony - Corporate Social Responsibity
Sony - Corporate Social ResponsibityAshley Ellaine Rivero
 
Are schools ready to be hubs of social and emotional learning? New findings o...
Are schools ready to be hubs of social and emotional learning? New findings o...Are schools ready to be hubs of social and emotional learning? New findings o...
Are schools ready to be hubs of social and emotional learning? New findings o...EduSkills OECD
 
Zynga Inc. Strategic Audit
Zynga Inc. Strategic AuditZynga Inc. Strategic Audit
Zynga Inc. Strategic AuditTarek El Kholy
 
Electronic Arts
Electronic ArtsElectronic Arts
Electronic Arts1197sana
 
Strategic analysis on sony assignment sample
Strategic analysis on sony assignment sampleStrategic analysis on sony assignment sample
Strategic analysis on sony assignment sampleAssignment Desk
 
Sony VAIO case study
Sony VAIO case studySony VAIO case study
Sony VAIO case studyKevin Huang
 
Sony Playstation Market Analysis
Sony Playstation Market AnalysisSony Playstation Market Analysis
Sony Playstation Market AnalysisAvik Shoutay
 
Nintendo Strategic Recommendation
Nintendo Strategic RecommendationNintendo Strategic Recommendation
Nintendo Strategic RecommendationBasim Al-Baker
 
Growth of gaming_industy_in_India
Growth of gaming_industy_in_IndiaGrowth of gaming_industy_in_India
Growth of gaming_industy_in_IndiaSusovita Subudhi
 
Yahoo Media Kit
Yahoo Media KitYahoo Media Kit
Yahoo Media KitYahoo
 
Valve Company Presentation
Valve Company PresentationValve Company Presentation
Valve Company Presentationotto_katta
 
LEGO Case Study ( Vahit Eren Özer - Riinvest College )
LEGO Case Study ( Vahit Eren Özer - Riinvest College ) LEGO Case Study ( Vahit Eren Özer - Riinvest College )
LEGO Case Study ( Vahit Eren Özer - Riinvest College ) Vahit Eren Özer
 

Mais procurados (20)

Sony - Corporate Social Responsibity
Sony - Corporate Social ResponsibitySony - Corporate Social Responsibity
Sony - Corporate Social Responsibity
 
Gaming industry
Gaming industryGaming industry
Gaming industry
 
Industria Gaming 2023
Industria Gaming 2023Industria Gaming 2023
Industria Gaming 2023
 
Global digital gaming market 2017-2022
Global digital gaming market 2017-2022 Global digital gaming market 2017-2022
Global digital gaming market 2017-2022
 
Ubisoft Strategy
Ubisoft StrategyUbisoft Strategy
Ubisoft Strategy
 
Zynga presentation-Corporate Strategy
Zynga presentation-Corporate StrategyZynga presentation-Corporate Strategy
Zynga presentation-Corporate Strategy
 
Strategic management (sony)
Strategic management (sony)Strategic management (sony)
Strategic management (sony)
 
Are schools ready to be hubs of social and emotional learning? New findings o...
Are schools ready to be hubs of social and emotional learning? New findings o...Are schools ready to be hubs of social and emotional learning? New findings o...
Are schools ready to be hubs of social and emotional learning? New findings o...
 
Zynga Inc. Strategic Audit
Zynga Inc. Strategic AuditZynga Inc. Strategic Audit
Zynga Inc. Strategic Audit
 
(6)sony ppt (1)
(6)sony ppt (1)(6)sony ppt (1)
(6)sony ppt (1)
 
Electronic Arts
Electronic ArtsElectronic Arts
Electronic Arts
 
Strategic analysis on sony assignment sample
Strategic analysis on sony assignment sampleStrategic analysis on sony assignment sample
Strategic analysis on sony assignment sample
 
Sony VAIO case study
Sony VAIO case studySony VAIO case study
Sony VAIO case study
 
Sony Playstation Market Analysis
Sony Playstation Market AnalysisSony Playstation Market Analysis
Sony Playstation Market Analysis
 
Nintendo Strategic Recommendation
Nintendo Strategic RecommendationNintendo Strategic Recommendation
Nintendo Strategic Recommendation
 
Growth of gaming_industy_in_India
Growth of gaming_industy_in_IndiaGrowth of gaming_industy_in_India
Growth of gaming_industy_in_India
 
LEGO-Case
LEGO-CaseLEGO-Case
LEGO-Case
 
Yahoo Media Kit
Yahoo Media KitYahoo Media Kit
Yahoo Media Kit
 
Valve Company Presentation
Valve Company PresentationValve Company Presentation
Valve Company Presentation
 
LEGO Case Study ( Vahit Eren Özer - Riinvest College )
LEGO Case Study ( Vahit Eren Özer - Riinvest College ) LEGO Case Study ( Vahit Eren Özer - Riinvest College )
LEGO Case Study ( Vahit Eren Özer - Riinvest College )
 

Semelhante a EA Equity Research Report - Alex Osterhage

Carat @E3 2019 Wrap Up Report
Carat @E3 2019 Wrap Up ReportCarat @E3 2019 Wrap Up Report
Carat @E3 2019 Wrap Up ReportCarat USA
 
Electronic arts vs. activision blizzard
Electronic arts vs. activision blizzardElectronic arts vs. activision blizzard
Electronic arts vs. activision blizzardSakib Hussain
 
SERIOUS GAMES-A Sizeable Market
SERIOUS GAMES-A Sizeable MarketSERIOUS GAMES-A Sizeable Market
SERIOUS GAMES-A Sizeable MarketEliane Alhadeff
 
Activision Blizzard, ATVI fin1
Activision Blizzard, ATVI fin1Activision Blizzard, ATVI fin1
Activision Blizzard, ATVI fin1Ashutosh Kumar Jha
 
Activision Blizzard, Inc. (ATVI) Initiating Coverage Report
Activision Blizzard, Inc. (ATVI) Initiating Coverage ReportActivision Blizzard, Inc. (ATVI) Initiating Coverage Report
Activision Blizzard, Inc. (ATVI) Initiating Coverage ReportAustinKane8
 
Game Analytics: A Practitioner’s Perspective
Game Analytics: A Practitioner’s PerspectiveGame Analytics: A Practitioner’s Perspective
Game Analytics: A Practitioner’s PerspectiveDecimus
 
Pitch Deck Teardown: SuperScale's $5.4M Series A deck
Pitch Deck Teardown: SuperScale's $5.4M Series A deckPitch Deck Teardown: SuperScale's $5.4M Series A deck
Pitch Deck Teardown: SuperScale's $5.4M Series A deckHajeJanKamps
 
The Ultimate Gaming & eSports Career Guide: Discover the opportunities and sk...
The Ultimate Gaming & eSports Career Guide: Discover the opportunities and sk...The Ultimate Gaming & eSports Career Guide: Discover the opportunities and sk...
The Ultimate Gaming & eSports Career Guide: Discover the opportunities and sk...Rob Kingyens
 
Pesquisa: 2024 NewzooPC & Console Gaming Report
Pesquisa: 2024 NewzooPC & Console Gaming ReportPesquisa: 2024 NewzooPC & Console Gaming Report
Pesquisa: 2024 NewzooPC & Console Gaming ReportPedro Zambarda de Araújo
 
2015_03_24 Final Research Report - Zynga (FINAL COPY) PDF
2015_03_24 Final Research Report - Zynga (FINAL COPY) PDF2015_03_24 Final Research Report - Zynga (FINAL COPY) PDF
2015_03_24 Final Research Report - Zynga (FINAL COPY) PDFCourtney Fenwick
 
Bitspawn Esports Software Investment Deck
Bitspawn Esports Software Investment Deck Bitspawn Esports Software Investment Deck
Bitspawn Esports Software Investment Deck Eric Godwin
 
Data & trends 2014 the digital games industry in review joost van dreunen
Data & trends 2014 the digital games industry in review   joost van dreunenData & trends 2014 the digital games industry in review   joost van dreunen
Data & trends 2014 the digital games industry in review joost van dreunenMary Chan
 
Investorppt V 1 3 7 17 2009
Investorppt V 1 3 7 17 2009Investorppt V 1 3 7 17 2009
Investorppt V 1 3 7 17 2009guest306b881
 

Semelhante a EA Equity Research Report - Alex Osterhage (20)

24485
2448524485
24485
 
Carat @E3 2019 Wrap Up Report
Carat @E3 2019 Wrap Up ReportCarat @E3 2019 Wrap Up Report
Carat @E3 2019 Wrap Up Report
 
Electronic arts vs. activision blizzard
Electronic arts vs. activision blizzardElectronic arts vs. activision blizzard
Electronic arts vs. activision blizzard
 
SERIOUS GAMES-A Sizeable Market
SERIOUS GAMES-A Sizeable MarketSERIOUS GAMES-A Sizeable Market
SERIOUS GAMES-A Sizeable Market
 
Activision Blizzard, ATVI fin1
Activision Blizzard, ATVI fin1Activision Blizzard, ATVI fin1
Activision Blizzard, ATVI fin1
 
Activision Blizzard, Inc. (ATVI) Initiating Coverage Report
Activision Blizzard, Inc. (ATVI) Initiating Coverage ReportActivision Blizzard, Inc. (ATVI) Initiating Coverage Report
Activision Blizzard, Inc. (ATVI) Initiating Coverage Report
 
Rio olympics 2016
Rio olympics 2016Rio olympics 2016
Rio olympics 2016
 
Game Analytics: A Practitioner’s Perspective
Game Analytics: A Practitioner’s PerspectiveGame Analytics: A Practitioner’s Perspective
Game Analytics: A Practitioner’s Perspective
 
Pitch Deck Teardown: SuperScale's $5.4M Series A deck
Pitch Deck Teardown: SuperScale's $5.4M Series A deckPitch Deck Teardown: SuperScale's $5.4M Series A deck
Pitch Deck Teardown: SuperScale's $5.4M Series A deck
 
The Ultimate Gaming & eSports Career Guide: Discover the opportunities and sk...
The Ultimate Gaming & eSports Career Guide: Discover the opportunities and sk...The Ultimate Gaming & eSports Career Guide: Discover the opportunities and sk...
The Ultimate Gaming & eSports Career Guide: Discover the opportunities and sk...
 
Pesquisa: 2024 NewzooPC & Console Gaming Report
Pesquisa: 2024 NewzooPC & Console Gaming ReportPesquisa: 2024 NewzooPC & Console Gaming Report
Pesquisa: 2024 NewzooPC & Console Gaming Report
 
2015_03_24 Final Research Report - Zynga (FINAL COPY) PDF
2015_03_24 Final Research Report - Zynga (FINAL COPY) PDF2015_03_24 Final Research Report - Zynga (FINAL COPY) PDF
2015_03_24 Final Research Report - Zynga (FINAL COPY) PDF
 
Sigaud environmental
Sigaud environmentalSigaud environmental
Sigaud environmental
 
Bitspawn Esports Software Investment Deck
Bitspawn Esports Software Investment Deck Bitspawn Esports Software Investment Deck
Bitspawn Esports Software Investment Deck
 
Data & trends 2014 the digital games industry in review joost van dreunen
Data & trends 2014 the digital games industry in review   joost van dreunenData & trends 2014 the digital games industry in review   joost van dreunen
Data & trends 2014 the digital games industry in review joost van dreunen
 
Global game industry outlook 2012-2016
Global game industry outlook 2012-2016Global game industry outlook 2012-2016
Global game industry outlook 2012-2016
 
Short Gamestop
Short Gamestop Short Gamestop
Short Gamestop
 
Ie express mgm_h
Ie express mgm_hIe express mgm_h
Ie express mgm_h
 
Investorppt V 1 3 7 17 2009
Investorppt V 1 3 7 17 2009Investorppt V 1 3 7 17 2009
Investorppt V 1 3 7 17 2009
 
Report
ReportReport
Report
 

EA Equity Research Report - Alex Osterhage

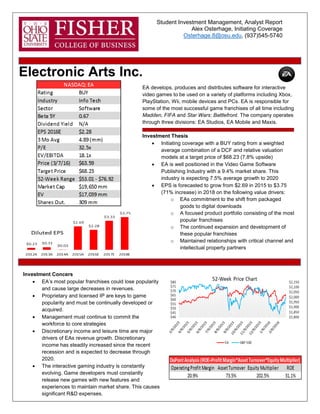
  • 1. Student Investment Management, Analyst Report Alex Osterhage, Initiating Coverage Osterhage.8@osu.edu, (937)545-5740 Electronic Arts Inc. Investment Concers  EA’s most popular franchises could lose popularity and cause large decreases in revenues.  Proprietary and licensed IP are keys to game popularity and must be continually developed or acquired.  Management must continue to commit the workforce to core strategies  Discretionary income and leisure time are major drivers of EAs revenue growth. Discretionary income has steadily increased since the recent recession and is expected to decrease through 2020.  The interactive gaming industry is constantly evolving. Game developers must constantly release new games with new features and experiences to maintain market share. This causes significant R&D expenses. EA develops, produces and distributes software for interactive video games to be used on a variety of platforms including Xbox, PlayStation, Wii, mobile devices and PCs. EA is responsible for some of the most successful game franchises of all time including Madden, FIFA and Star Wars: Battlefront. The company operates through three divisions: EA Studios, EA Mobile and Maxis. Investment Thesis  Initiating coverage with a BUY rating from a weighted average combination of a DCF and relative valuation models at a target price of $68.23 (7.8% upside)  EA is well positioned in the Video Game Software Publishing Industry with a 9.4% market share. This industry is expecting 7.5% average growth to 2020  EPS is forecasted to grow from $2.69 in 2015 to $3.75 (71% increase) in 2018 on the following value drivers: o EAs commitment to the shift from packaged goods to digital downloads o A focused product portfolio consisting of the most popular franchises o The continued expansion and development of these popular franchises o Maintained relationships with critical channel and intellectual property partners
  • 2. March 8th , 2016 Fisher College of Business Electronic Arts (EA) 2 | P a g e Analyst: Alex Osterhage Table of Contents Company Overview....................................................................................3 Profile ..............................................................................................3 Revenue Breakdown .......................................................................3 Company Strategies........................................................................5 Global Operations............................................................................5 Operating Structure .........................................................................6 Intellectual Property (IP) ..................................................................6 Leadership.......................................................................................6 Competition .....................................................................................6 Sustained Competitive Advantage and Value Drivers .....................7 Recent News ...................................................................................8 Investment Thesis ......................................................................................9 Economic Factors............................................................................9 Financials ......................................................................................10 DCF Valuation ...............................................................................12 Key Assumptions...........................................................................12 Sensitivity Analysis ........................................................................12 Multiples ........................................................................................13 Price Triangulation.........................................................................13 Concerns to Recommendation.................................................................14 Competition ...................................................................................14 Game Franchise Value-Add ..........................................................14 Developing and Acquiring IP .........................................................14 Commitment to Core Strategies. ...................................................15 Changing the Interactive Gaming Landscape................................15 Conclusion ...............................................................................................16 References...............................................................................................17
  • 3. March 8th , 2016 Fisher College of Business Electronic Arts (EA) 3 | P a g e Analyst: Alex Osterhage Company Overview Electronic Arts (hereafter “EA” or “The Company”) was founded in 1982 by Trip Hawkins on the premise that interactive media would one day be more important than traditional media such as TV and movies. Since then, video games and other interactive media have surpassed traditional media in annual revenue and revenue per unit. Video game development has become a world-renowned and influential art taught at top universities across the globe. EA is one of a select few companies leading the interactive entertainment industry into the future through their company strategies, brands and platforms, global operations, operating structure, intellectual property and leadership. Profile EA currently enjoys a 9.4% market share of the video game software publishing industry (IBIS). They are second only to Activision Blizzard, maker of Guitar Hero and Call of Duty, at 9.8%. Top grossing games for EA include all of the FIFA, Madden, Star Wars: Battlefront, Sims and Need for Speed franchises. Every product offered by EA can be played on consoles like the Xbox One, PlayStation 4 and platforms like computers and mobile devices. The company relies on continued popularity of these franchises, consoles and platforms among the gaming community through yearly redesigns and releases. Revenue Breakdown EA operates on a fiscal year that begins on April 1st and runs to March 31st. The company breaks GAAP compliant revenue down into two segments, Product and Service and Other. Product revenues include the sale of software games or related content (either digitally downloaded or physically purchased) and the licensing of software to third-parties. Service and Other revenues are made up of subscriptions and games or related content that requires EA to provide hosting services. Games or related content that require hosting services require an internet connection and include micro- transactions for social network and free-to-download games like the hugely popular 2,568 1,947 2015 Revenue by Segment ($ in mm) Product Service and Other 1,5401,546 2015 Operating Profit by Segment ($ in mm) Product Service and Other
  • 4. March 8th , 2016 Fisher College of Business Electronic Arts (EA) 4 | P a g e Analyst: Alex Osterhage Plants vs Zombies. Product revenues were $2,568mm in 2015 compared to Service and Other revenues at $1,947mm. Product segment operating profit was $1,546mm in 2015 compared to $1,540mm operating profit in the Service and Other segment. Product costs as a percentage of Product sales were 60% in 2015 compared to Service and Other costs at 79% of Service and Other sales. In total, EA recognized $4,515mm in GAAP revenue in 2015 compared to $3,575mm in 2015 and expects $4,250mm in 2016 on the releases of the latest versions of Madden, FIFA and Need for Speed. EA also breaks revenue down into two, non-GAAP segments, Packaged Goods and Digital. This breakdown is used internally as a way for management to more accurately analyze operating performance as well as plan and forecast better for the future. Packaged Goods revenue is comprised primarily of software with a physical delivery through traditional channels like the retailers GameStop and BestBuy. Driven by sales of FIFA 15 and Madden NFL 15, Packaged Goods revenue was $2,809mm in 2015 compared to $2,228mm in 2015. This decrease was caused not only by the slowdown in sales and decrease in popularity of Battlefield and Need for Speed in addition to the loss of the NCAA Football franchise, but the increase in popularity of Digital sales. Digital sales increased from $1,793mm to $2,230mm 2014 to 2015 due primarily to a shift in the video game industry from physical software to digital downloads. EA distributes digital software through direct downloads from the internet including full- game downloads to consoles, extra content, subscriptions and mobile games. The increase in Digital sales, like Packaged Goods, was driven by FIFA 15 in addition to Dragon Age: Inquisition and The Sims 4. The differentiator for EA when it comes to Digital sales was a 40% increase in subscription sales driven by Battlefield 4 Premium, FIFA 15 Online and the releases of the new FIFA 15 Ultimate Team and Madden Ultimate Team. The Ultimate Team release is a new way for EA to engage players for longer by offering the ability to buy and sell “cards” representing different players and 71% 56% 55% 53% 55% 29% 44% 45% 47% 45% $0 $500 $1,000 $1,500 $2,000 $2,500 $3,000 $3,500 2012 2013 2014 2015 2016 Non-GAAP Segment Revenue ($ in millions and % of total revenue) Packaged Digital
  • 5. March 8th , 2016 Fisher College of Business Electronic Arts (EA) 5 | P a g e Analyst: Alex Osterhage coaches. Management believes this new feature emulates managing a team and gives players a sense of ownership which drives prolonged game use. Company Strategies EA is committed to three core strategies including Players First, Commitment to Digital and One EA. The company desires to build deep relationships with players by creating games with “long-lasting fun and enduring value”. Management believes this commitment has led to over 165mm active users on mobile titles and a leading position among publishers for Xbox One and PlayStation 4. The gaming industry is shifting from disc-based games to digital downloads that include full-game downloads and additional content and service downloads. EA has taken this shift as an opportunity to expand relationships with consumers who are increasingly engaging in game play for longer periods of time due to ease of use with digital downloads. Consumers are able to download games and additional content directly to consoles instead of traveling to retailers like GameStop and BestBuy. Digital revenue is higher-margin than Packaged Goods and management believes this margin will increase into 2016. To increase operational speed with improved fiscal discipline, EA management has undertaken a cultural shift towards a more flexible and feedback focused organization. Engaging consumers with alpha’s and beta’s (pre-market released games) has helped the company to release games and content that is “truly consumer focused”. Global Operations Due to the massive global popularity of EA game franchises, the company had international revenues (countries other than the U.S. and Canada) of $2,559mm, representing 57% of total revenue for 2015. This was a 24% increase from 2014 primarily driven by sales of FIFA 15 and Madden which represented 15% and 13.3% of total global revenue in 2015, respectively. 15.0% 7.9% 13.3% Revenue by Game Title FIFA Madden Other 1,701 1,510 1,956 2,096 2,065 2,559 -$400 $100 $600 $1,100 $1,600 $2,100 $2,600 2013 2014 2015 Revenue by Region U.S. and Canada International
  • 6. March 8th , 2016 Fisher College of Business Electronic Arts (EA) 6 | P a g e Analyst: Alex Osterhage Operating Structure EA is broken down operationally into three divisions, EA Studios, EA Mobile and Maxis. EA Studios is the largest of the three and is responsible for the development of the most popular game franchises such as FIFA and Madden. EA Studios is a collaborative organization with all team members working closely through shared technologies to enhance idea sharing. This division also works with external game developers like Respawn Entertainment to create collaborations like Titalfall and share publishing and distribution relationships. EA Mobile is responsible for the creation and improvement of games like Plants vs Zombies and others to be played on mobile phones and tablets. The Sims franchise was developed by Maxis, a wholly-owned subsidiary responsible for creating games intended to spawn player creativity. Intellectual Property (IP) The success of EA is based heavily on the “creation, acquisition, exploitation and protection” of IP. A portion of EA IP is developed in-house or acquired and a portion is obtained from third-parties that allow EA to license their IP. These licenses included sports leagues and players associations and film and music companies. The company is very engaged in protecting these IP’s through copyrights, trademarks and other copy protection technologies. Leadership Andrew Wilson has held the seat of CEO and Director since 2013. He has been with the company since 2000 in many roles and was ranked as #3 on Fortune Magazine’s Business Person of the Year list in 2015 behind Mark Zukerberg and Mark Parker. Aiding Wilson is CFO Blake Jorgensen who has been with EA since 2012 after a stint with Yahoo! The two have worked together to align the company around their three core strategies, Players First, One EA and the Commitment to Digital. They also have set and met a goal for non-GAAP operating margin of over 20%. Competition EA competes with many companies in the video game and entertainment industries. The majority of competition is for consumer discretionary income and leisure time. Not only does the company compete directly for customers business but it competes for licensing agreements from different third-parties for IP as well. EA uses these IP’s in their products to make them more appealing and exciting to customers. The failure to secure different third-party IP is a major risk for EA. Some major areas of competition for the company include “game quality and ease of use, compatibility of products with certain platforms, online capability, price and quality of customer service” (10k).
  • 7. March 8th , 2016 Fisher College of Business Electronic Arts (EA) 7 | P a g e Analyst: Alex Osterhage Competition For Games in: Console Devices and PC's Mobile Devices PC Free-to- Download Sony Supercell Tencent Microsoft KING Nexon Activision Blizzard GungHo Online Valve Take-Two Interactive Activision Blizzard Ubisoft The toughest competitive landscape for EA is in console devices and PC’s due to the resources of competition like Activision Blizzard, Take-Two Interactive and Ubisoft. Like EA, these companies develop games to be played on consoles created by Sony and Microsoft who also create software to be used on their consoles. Mobile device competition is a rapidly expanding and changing marketplace that requires EA to constantly develop new games. The environment is filled with many small competitors who specialize in developing or acquiring games with a popular life of a few weeks. Management expects this competition to continue to intensify as new developers enter the marketplace. Similar to mobile device is PC Free-to-Download competition where many competitors are frequently introducing new online gaming services. Management expects intensified competition for similar reasons. Sustained Competitive Advantage and Value Drivers For EA, significant relationships with channel partners and third-party IP providers, the continued commitment to digital downloads, a more focused product portfolio and the continuation of game franchises are keys to success. Sony and Microsoft authorize EA to develop games for their consoles. Without these relationships, EA would have lost almost 50% of their Digital revenue in 2015 from the loss of Xbox One (MSFT), PlayStation 4 (SNE) and some mobile game platforms. 719 673 638 581 668 1,068 363 452 524 -$200 $300 $800 $1,300 $1,800 $2,300 2013 2014 2015 Digital Revenue by Platform ($ in mm) PC and Other Console Mobile
  • 8. March 8th , 2016 Fisher College of Business Electronic Arts (EA) 8 | P a g e Analyst: Alex Osterhage EA must maintain relationships with third-party IP providers for a continued competitive advantage. For example, if the NFL Players Association decided that EA could no longer use the license for professional football players’ likeness or the NFL logo and copyrights, EA would have lost 7.9% of revenue in 2015 from the loss of the Madden franchise. Historically, the NFL has enjoyed its relationship with EA due to the increase in brand recognition from the franchises popularity among American consumers. EA has similar relationships with other third-party IP providers and must maintain them into the future. Like mentioned earlier, EA is one of the video game development companies leading the industry into the future with their commitment to digital downloads. Consumers enjoy the ease of use with these products and would lose interest in EA games if the development of digitally available games and content wasn’t available. In the past, EA has release a broad range of products and has recently narrowed the scope of their portfolio to focus on the most successful game franchises. These franchises represent a majority of revenues for the company through their continued popularity. This popularity is driven by the company’s ability to constantly add value through new game elements like the Ultimate Team function in sporting games such as FIFA and Madden. For EA to maintain this competitive advantage, they must continue providing an improved gaming experience. This explains why R&D expenses have been so extensive historically. Recent News In May of 2015, EA reported a new stock repurchase program where up to $1b of common stock will be purchased. In the old repurchase plan, 8.3mm shares were repurchased for $337mm in the open market and through private transactions. $1,153 $1,125 $1,094 $1,196 $1,178 $1,217 $1,022 $1,042 $1,062 $1,082 $1,102 $1,122 $1,142 $1,162 $1,182 $1,202 $1,222 2013 2014 2015 2016E 2017E 2018E R&D Expenses ($ in mm)
  • 9. March 8th , 2016 Fisher College of Business Electronic Arts (EA) 9 | P a g e Analyst: Alex Osterhage According to management, game releases for 2016 will follow the schedule to the left. It is easy to see that game franchises are a majority of EA’s releaes. FIFA, Madden, NBA Live and NHL are examples of franchises that are redesigned and released every year with improved game play, new features and new content. Consumers have come to expect new versions of these franchises each year and EA has to live up to expectiations or risk losing business to other companies like Activision or Ubisoft. Investment Thesis Coverage is being initiated on EA with a BUY rating at a target price of $68.23 (7.8% upside potential) from a weighted average combination of a DCF and relative valuations. These valuations are driven primarily by EA’s sustained competitive advantages, favorable market positioning and management’s commitment to their core strategies. Economic Factors According to IBIS World, the video game software publishing industry experienced a 10.3% growth rate from 2010 to 2015. They predict this growth rate to slow to 7.5% for 2015 to 2020. EA is well positioned with a market share of 9.4% and expects market share to increase with new product releases, an essential to maintaining market share according to IBIS World. Thanks to increases in mobile phone ownership from 35% to 64% (2010 to 2015), video games can now reach a much broader audience. EA is once again well positioned to realize a portion of that growth thanks to their commitment to digital downloads and the EA Mobile organization which publishes or acquires interactive games for mobile phones and tablets. Leisure time and disposable income are major determinants of consumer’s ability to pay for and play video games. Disposable income has been steadily
  • 10. March 8th , 2016 Fisher College of Business Electronic Arts (EA) 10 | P a g e Analyst: Alex Osterhage increasing since the recent recession and is expected to decrease slightly through 2020. Leisure time has historically been flat with a growth rate of .3% from 2010 to 2015. This rate is expected to decrease to .2% for 2015 to 2020. Even at this low growth rate, consumes are still estimated to spend an average of 5.28 hours a day on leisure. These factors pose both an opportunity and a threat for EA seeing as how they can take advantage of recent increases in disposable income but must be wary of flat leisure growth. Financials In Millions 2011A 2012A 2013A 2014A 2015A 2016E 2017E 2018E Net revenue: Product $3,181 $3,415 $2,738 $2,134 $2,568 $2,722 $2,913 $3,146 Growth 7% -20% -22% 20% 6% 7% 8% % of Total Rev 89% 82% 72% 60% 57% 57% 57% 57% Service and other 408 728 1,059 1,441 1,947 2,064 2,208 2,385 Growth 78% 45% 36% 35% 6% 7% 8% % of Total Rev 11% 18% 28% 40% 43% 43% 43% 43% Total net revenue 3,589 4,143 3,797 3,575 4,515 4,786 5,121 5,531 Growth 15% -8% -6% 26% 6% 7% 8% Cost of revenue: Product 1,407 1,374 1,085 1,032 1,028 1,196 1,178 1,272 Service and other 92 224 303 315 401 431 410 442 Total cost of revenue 1,499 1,598 1,388 1,347 1,429 1,627 1,587 1,714 Gross profit 2,090 2,545 2,409 2,228 3,086 $3,159 $3,533 $3,816 % of Total Rev 58% 61% 63% 62% 68% 66% 69% 69% Operating expenses: R&D 1,153 1,212 1,153 1,125 1,094 1,196 1,178 1,217 Marketing and sales 474 853 788 680 647 670 666 719 G&A 301 375 354 410 386 431 461 498 Acquisition Expense -17 11 -64 -35 -3 -48 -51 -55 Amortization 57 43 30 16 14 24 26 28 Restructuring 161 16 27 -1 0 48 51 0 Operating expenses 2,402 2,510 2,288 2,195 2,138 2,321 2,330 2,406 Operating income -312 35 121 33 948 838 1203 1410 % of Total Rev -9% 1% 3% 1% 21% 18% 24% 26% Investments 23 0 39 0 0 0 0 0 Interest 10 -17 -21 -26 -23 -48 0 -55 Income before taxes -279 18 139 7 925 790 1,203 1,355 Taxes -3 -58 41 -1 50 47 120 136 Net income -276 76 $98 $8 $875 742 1,083 1,219 % of Total Rev -8% 2% 3% 0% 19% 16% 21% 22%
  • 11. March 8th , 2016 Fisher College of Business Electronic Arts (EA) 11 | P a g e Analyst: Alex Osterhage Like mentioned earlier, EA breaks GAAP compliant revenue down into Product and Service and Other. The Product segment recognized an average of -4% revenue growth at an average of 68% of total revenue from 2011 to 2015. I forecast a 7% growth rate and 57% of total revenue for this segment from 2016 to 2018 based on EA’s ability to take advantage of increased discretionary income through new product offerings and the continued improvement of current franchise games like FIFA and Madden. The Service and Other segment grew at an average of 49% from 2011 to 2015 at 32% of total revenue. For 2015 to 2018, I forecast 7% growth and an increase to 43% of total revenue for this segment primarily on the 30mm game sessions of Battlefield Hardline played, 200mm hours of Dragon Age: Inquisition played and 16mm average monthly players for The Simpson: Tapped Out, among others. The preceding represent subscriptions that EA has introduced recently and that have helped boost the Service and Other segment to be a major contributor to total company revenue. I expect total company revenue to grow from $4,786 in 2016 to $5,531 in 2018 which is just outside of consensus estimates of $4,527 in 2016 and $5,205 in 2018. In terms of earnings per share, my estimates are also slightly more optimistic than consensus due to the implementation of the second share repurchase program that was announced in May of 2015. Further, I assume that management will maintain competitive advantages like a focused product portfolio and expanded market share in the mobile segment. As can be seen by the chart on the right, the Product segment is responsible for a majority of revenue costs even as the Service and Other segment is increasing in terms of percentage of total revenue. This is due to the high- margin nature of Product revenues. Producing physical software for game consoles is far more expensive per unit than providing subscription and hosting services in the Service and Other Segment. RevenueComparison($inmillions) Year 2016E 2017E 2018E Analyst 4,786 5,121 5,531 Consensus 4,527 4,835 5,205 EPSComparison Year 2016E 2017E 2018E Analyst 2.28 3.33 3.75 Consensus 2.28 3.26 3.56 $1,085 $1,032 $1,028 $1,196 $1,178 $1,272 $303 $315 $401 $431 $410 $442 $0 $200 $400 $600 $800 $1,000 $1,200 $1,400 $1,600 $1,800 2013 2014 2015 2016E 2017E 2018E Cost of Revenue by Segment ($ in mm) Product Service and other
  • 12. March 8th , 2016 Fisher College of Business Electronic Arts (EA) 12 | P a g e Analyst: Alex Osterhage DCF Valuation Key Assumptions Discount Rate – A terminal discount factor of 10% was chosen for the DCF model. This factor is reflective of the relatively stable nature of EA’s business. A discount factor of 12% is used for risky companies while 8% is used for extremely stable companies. EA is currently in the middle of a growth trend but faces some macro risks that will slow growth to a stable rate in the near future. Terminal FCF Growth Factor – A terminal factor of 5% was appropriate for this valuation. While 5% is an inflated terminal factor, EA will continue to grow and expand into the future. The company has only just recently increased operating margin above 20%. This was a major goal for CEO Andrew Wilson that will be maintained if the company is able to stay committed to core strategies. Sensitivity Analysis is appropriate to analyze what happens to the implied price if assumptions change. We see a range of $50 to $112 due to the broad growth rate range. As the growth and discount rate increase, price increases as well. Terminal Discount Rate = 10.0% Electronic Arts (EA) Terminal FCF Growth = 5.0% Year 2013A 2014A 2015A 2016E 2017E 2018E 2019E 2020E 2021E 2022E 2023E 2024E 2025E Revenue 3,797 3,575 4,515 4,786 5,121 5,531 6,028 6,511 6,966 7,384 7,754 8,141 8,548 % Grow th -5.8% 26.3% 6.0% 7.0% 8.0% 9.0% 8.0% 7.0% 6.0% 5.0% 5.0% 5.0% Operating Income 121 33 948 838 1,203 1,410 1,326 1,432 1,533 1,625 1,706 1,791 1,881 Operating Margin 3.2% 0.9% 21.0% 17.5% 23.5% 25.5% 22.0% 22.0% 22.0% 22.0% 22.0% 22.0% 22.0% Interest and Other (21) (26) (23) (24) (26) (28) (30) (33) (35) (37) (39) (41) (43) Interest % of Sales -0.6% -0.7% -0.5% -0.5% -0.5% -0.5% -0.5% -0.5% -0.5% -0.5% -0.5% -0.5% -0.5% Taxes 41 (1) 50 49 118 138 117 126 135 143 150 158 165 Tax Rate 29.5% -14.3% 5.4% 6.0% 10.0% 10.0% 9.0% 9.0% 9.0% 9.0% 9.0% 9.0% 9.0% Net Income 98 8 875 765 1,060 1,244 1,179 1,274 1,363 1,445 1,517 1,593 1,672 % Grow th -91.8% 10837.5% -12.6% 38.6% 17.4% -5.2% 8.0% 7.0% 6.0% 5.0% 5.0% 5.0% Add Depreciation/A 264 227 220 239 307 277 301 326 348 369 388 407 427 % of Sales 7.0% 6.3% 4.9% 5.0% 6.0% 5.0% 5.0% 5.0% 5.0% 5.0% 5.0% 5.0% 5.0% Plus/(minus) Changes WC (8) (46) (66) (29) (102) (37) (40) (43) (46) (49) (52) (54) (57) % of Sales -0.2% -1.3% -1.5% -0.6% -2.0% -0.7% -0.7% -0.7% -0.7% -0.7% -0.7% -0.7% -0.7% Subtract Cap Ex 106 97 95 144 102 111 151 195 244 295 349 407 427 Capex % of sales 2.8% 2.7% 2.1% 3.0% 2.0% 2.0% 2.5% 3.0% 3.5% 4.0% 4.5% 5.0% 5.0% Free Cash Flow 248 92 934 832 1,163 1,373 1,290 1,361 1,421 1,469 1,504 1,539 1,615 % Grow th -62.9% 915.2% -11.0% 39.8% 18.1% -6.1% 5.5% 4.4% 3.4% 2.4% 2.3% 5.0% : 4.4% 4.6% 4.8% 5.0% 5.2% 5.4% 5.6% 8.5% 86.72 89.86 93.33 97.21 101.55 106.46 112.04 9.0% 77.30 79.67 82.28 85.15 88.31 91.83 95.77 9.5% 69.72 71.57 73.57 75.76 78.15 80.77 83.66 10.0% 63.49 64.96 66.54 68.24 70.09 72.10 74.29 10.5% 58.29 59.47 60.73 62.09 63.55 65.13 66.83 11.0% 53.87 54.83 55.86 56.96 58.14 59.40 60.75 11.5% 50.07 50.87 51.72 52.62 53.58 54.60 55.69 Terminal FCF Growth TerminalDiscount Factor
  • 13. March 8th , 2016 Fisher College of Business Electronic Arts (EA) 13 | P a g e Analyst: Alex Osterhage Multiples As can be seen from the chart below, EA is currently trading at a premium to all of its peers in terms of earnings per share, EBITDA and book value per share. A P/E multiplier of 20.7x was used to determine a fair value based on what investors are willing to pay for peers earnings. The 10.9x EV/EBITDA multiplier is also a median value for peers. I used slightly inflated multipliers of 12.9x, 3.5x and 7.3x for EV/EBIT, EV/Rev and P/B, respectively. The median values were returning a moderately low price and were skewing EA’s implied equity value too far to the downside. Price Triangulation Valuation Market Cap P/E EV/EBITDA NTM EV/EBIT NTM EV/Rev P/B DCF Valuation ELECTRONIC ARTS INC 19.65B 32.5x 18.1x 11.4x 3.5x 6.5x SONY 29.06B -- 5.2x 6.3x 0.4x 1.2x MICROSOFT 403.45B 17.5x 12.3x 11.8x 3.6x 5.3x ACTIVISION BLIZZARD INC 22.85B 32.3x 16.9x 11.8x 3.9x 2.8x UBISOFT 3.26B 21.2x 4.2x 14.5x 1.9x 3.3x TAKE-TWO INTERACTIVE 2.97B -- -- 7.2x 1.3x 5.8x Multiplier Used 20.7x 10.9x 12.9x 3.5x 7.3x Implied Equity Value / Share $72.35 $66.75 $70.26 $63.55 $70.74 $68.24 Weighting 15% 10% 5% 15% 5% 50% A target price of $68.23 was calculated using a weighted average combination of a DCF and relative valuations. These methods were used due to EAs diverse operations and competitive landscape. The price to earnings (P/E), enterprise value to EBITDA (EV/EBITDA), next twelve months enterprise to EBIT (NTM EV/EBIT), next twelve months enterprise value to revenue (NTM EV/Rev) and price to book (P/B) ratios were determined for EAs most relevant competitors: Sony, Microsoft, Activision Blizzard, Ubisoft and Take-Two Interactive. These competitor’s relevance to EA was discussed in Competition above. The P/E ratio is the most critical ratio to use for EA due to the importance that investors place on earnings and therefore deserves a 15% weighting. Just as important is the EV/Rev ratio because of investors desire to know how
  • 14. March 8th , 2016 Fisher College of Business Electronic Arts (EA) 14 | P a g e Analyst: Alex Osterhage expensive it would be to buy a dollar of EA’s sales. The EV/EBITDA ratio is used because it gives the best picture of a company’s operations without the screw from interest, taxes, depreciation and amortization. This multiple was given a 10% weighting. EV/EBIT and P/B ratios are not as critical but still are excellent determinants of operations and value and received a 5% weighting each. Most critical to this valuation is the DCF model which received a 50% weighting due to its accuracy in determining future values. Concerns to Recommendation Certain factors must be considered while analyzing EA’s businesses and future performance. The following factors represent the greatest risks to EA’s stock price, revenues and customer base. These factors include, but are not limited to, the intensity of competition, the failure to add value to current game franchises, the failure to develop or acquire IP, the failure to stay committed to core strategies and the risk that the interactive gaming landscape will change. Competition A majority of the segments that EA operates in have low barriers to entry and therefore have many players. Further, to remain a competitive entity in the segment, a company must continually develop and release new games with new features and experiences. Consumers in the interactive gaming industry are constantly looking for, and willing to buy, the latest releases and most popular “hits”. EA has historically been a leader in new “hit” releases but must remain diligent in R&D to stay among the leaders. Game Franchise Value-Add As mentioned previously, a majority of EA revenues come from the most popular franchises like FIFA and Madden. Yearly releases of these games have become normal and expected for consumers. A disruption to this cycle would cause a significant loss in revenue for EA not only from loss of unit sales, but from the loss of consumer interest in the franchise as well. EA must also continue to add new features to franchises (like the Ultimate Team experience) yearly to maintain consumer interest. Without new features, consumers will spend their discretionary income and leisure time on other, “newer” products and experiences. Developing and Acquiring IP IP is a huge driver of game success. EA must use their vast resources and R&D expenses wisely when developing IP or acquiring it through licenses. The company runs the risk of third-party IP owners refusing to sell licenses. For example, if FIFA (a regulatory entity for European soccer) decided EA was no longer allowed to use the FIFA logo or player likenesses, the company would lose a huge portion of revenue
  • 15. March 8th , 2016 Fisher College of Business Electronic Arts (EA) 15 | P a g e Analyst: Alex Osterhage (15% in 2015). This may seem unlikely due to the revenue that FIFA receives from the partnership and the brand recognition gained from game popularity, but new committee members are voted onto the FIFA board occasionally and could have an impact on the relationship. Commitment to Core Strategies EA’s core strategies of Players First, Commitment to Digital and One EA are key to company culture and business success. Relationships with players are a major focus for CEO Andrew Wilson as he believes players can provide key insights into what makes a game better. EA cannot risk losing these key relationships. As the interactive gaming industry shifts from packaged goods to digital downloads, EA must stay committed to leading the way. As was mentioned earlier, EA has been quickly growing revenues in the Digital segment while Packaged Goods are slowly declining. The company must continue to grow Digital revenues to make up for the loss in Packaged Goods. One EA is the company’s way to bring all three core strategies full circle through a shift in company culture to a more feedback focused team. A disruption in this cultural shift could have seriously negative ramifications like the loss of key leaders from a cultural misalignment. Changing the Interactive Gaming Landscape In the gaming world, new trends gain popularity rapidly, rendering old trends almost useless. Whenever a new game is released, the older version instantly drops in value significantly. As you can see from the chart, prices for FIFA for PlayStation 4 on Amazon.com drop by over 50% after a new version is released. This reinforces management’s strategy to maintain relationships with consumers to continue to develop newer games with newer features and experiences each year. Further, EA is faced with the risk that the interactive gaming industry could stagnate or even deflate. Just as quickly as video games came to be popular, they could be diminished to an old fad. EA has been successful as continuing to grow the industry but any decrease in the popularity of interactive games will hurt company revenue and market share. FIFA for PS4 FIFA 16 $40.25 FIFA 15 $19.99 FIFA 14 $13.14
  • 16. March 8th , 2016 Fisher College of Business Electronic Arts (EA) 16 | P a g e Analyst: Alex Osterhage Conclusion A BUY rating on EA with a target price of $68.23 represents a 7.8% upside to the current price of $63.59. I am initiating coverage on the company with this rating and target price due to several factors. First, EA is well positioned within the Video Game Software Publishing industry, at a 9.4% market share, to take advantage of an average expected industry growth of 7.5% through 2020. Second, I forecast EPS will grow by 71% from 2015 to 2018 ($2.69 to $3.75) on such value drivers as EA’s commitment to a focused product portfolio and the shifting from Packaged Goods to Digital Downloads. This EPS estimate is also backed by the recent stock repurchase plan which will yield positive results for price per share. Further, my target price is supported by a continued expansion and development of popular game franchises like Madden, Star Wars Battlefront and FIFA. Finally, critical channel and IP partner relationships must be maintained for EA to continue to grow revenues through new games, new features in existing franchises and a new focus on mobile gaming.
  • 17. March 8th , 2016 Fisher College of Business Electronic Arts (EA) 17 | P a g e Analyst: Alex Osterhage Resources  Capital IQ Data – Accessed on Ohio State Campus  Bloomberg Data – Accessed on Ohio State Campus  Credit Suisse Equity Research Report. Ju, Ford, Yang and Yadgaran. 1/29/16  Capital IQ Equity Research Report. Kessler. 2/27/16  IBIS World Industry Reports (iExpert Industry Summary 51121e)  EA Investor Relations o EA FY 2014 Earnings Presentation o EA FY 2014 10-K Filing o EA FY 2015 Earnings Presentation o EA FY 2015 Earnings Call Transcript o EA FY 2015 10-K Filing  Amazon.com  TD Ameritrade.com  Yahoo! Finance