The document provides financial performance summaries for 2016-2019 for the overall group, international projects, and European operations. It shows income, non-pay costs, pay costs, and EBITDA. Additionally, it provides more detailed breakdowns of income sources, pay costs and staffing, non-pay costs, key financial ratios, and performance of international project locations. Overall, it analyzes the financial performance and operations of the company across different business units and geographies over a four year period.
1. SUMMARY FINANCIAL PERFORMANCE
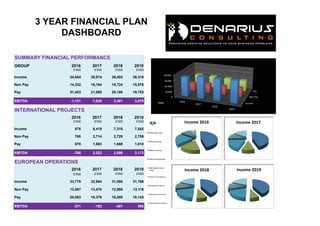
GROUP 2016 2017 2018 2019
£'000 £'000 £'000 £'000
Income 34,654 39,074 38,403 39,310
Non Pay 14,332 16,184 15,724 15,878
Pay 21,453 21,060 20,188 19,753
EBITDA -1,131 1,830 2,491 3,679
INTERNATIONAL PROJECTS
2016 2017 2018 2019
£'000 £'000 £'000 £'000
Income 875 6,419 7,315 7,542
Non Pay 765 2,714 2,729 2,759
Pay 870 1,683 1,688 1,610
EBITDA -760 2,022 2,898 3,173
EUROPEAN OPERATIONS
2016 2017 2018 2019
£'000 £'000 £'000 £'000
Income 33,779 32,654 31,088 31,768
Non Pay 13,567 13,470 12,995 13,119
Pay 20,583 19,376 18,500 18,143
EBITDA -371 -192 -407 506
3 YEAR FINANCIAL PLAN
DASHBOARD
Income
Non Pay
Pay
0
10,000
20,000
30,000
40,000
2016
2017
2018
2019
Income 2019
Income 2017
Metal Spinning
Metal Pressing
Metal Finishing
Metal Hemispheres
Metal Ballustrade
Plates
Project Consultancy
Be-Spoke Products
EducaJon Contracts
InternaJonal Projects
Income 2018
'000s
Income 2016
2. 75
INCOME
2016 2017 2018 2019
£'000 £'000 £'000 £'000
Metal Spinning 15,985 17,474 16,213 16,581
Metal Pressing 6,051 4,298 3,439 3,157
Metal Finishing 7,385 7,385 7,685 8,035
Metal Hemispheres 872 1,094 1,179 1,251
Metal Ballustrade Plates 720 800 900 1,000
Project Consultancy 971 622 670 720
Be-Spoke Products 725 600 621 643
Education Contracts 1,070 380 380 380
International Projects 875 6,419 7,315 7,542
TOTAL 34,654 39,074 38,403 39,310
3 YEAR FINANCIAL PLAN
DASHBOARD
£-
£5,000
£10,000
£15,000
£20,000
2016 2017 2018 2019
Spinning v Pressing v Finishing
Metal Spinning Metal Pressing Metal Finishing
£0
£500
£1,000
£1,500
2016 2017 2018 2019
Hemispheres v Ballustrades
Metal Hemispheres Metal Ballustrade Plates
'000s
£0
£200
£400
£600
£800
£1,000
£1,200
2016 2017 2018 2019
Projects v Be-Spoke Products v Contracts
Project Consultancy Be-Spoke Products EducaJon Contracts
'000s
£0 £1,000 £2,000 £3,000 £4,000 £5,000
£6,000
£7,000
£8,000
2016
2017
2018
2019
Interna=onal Projects
InternaJonal Projects
3. 75
1000
INCOME
2016 2017 2018 2019 TOTAL
£'000 £'000 £'000 £'000 £'000
Dubai Free-Zone 875 2,884 2,705 2,644 9,108
Kolkata Salt Lake, India 0 1,310 1,277 1,477 4,064
Al Qatif, KSA 0 1,148 1,667 1,688 4,503
Hangzhou, China 0 1,077 1,667 1,733 4,477
TOTAL 875 6,419 7,315 7,542 22,151
The Company has successfully secured additional business at its
new base in Dubai: one is related to the provision of metal finishing
for Emirates airline whilst the supply of ballustrade caps to the port
in Jebel Ali is also showing pleasing demand. The investment in
Kolkata Salt Lake is also proving money well spent as companies
based in the port are ordering a variety of services including metal
spinning as well furnishing. Over in Saudi Arabia the new business
unit based Al Qatif has been well received with two separate
contracts secture for metal pressing. The operation in China is also
proving popular with demand across the board including metal
hemispheres.
MAJOR INTERNATIONAL GROWTH
3 YEAR FINANCIAL PLAN
DASHBOARD
0
500
1,000
1,500
2,000
2,500
3,000
2017
2018
2019
Interna'onal Projects
Dubai Free-Zone Kolkata Salt Lake, India Al QaAf, KSA Hangzhou, China
'000s
4. 75
1000
PAY
2016 2017 2018 2019
£'000 £'000 £'000 £'000
Management 2,431 1,973 2,007 1,957
Technicians 9,049 8,708 8,239 8,097
Sales Team 3,391 3,271 3,288 3,190
Business Support 4,177 4,008 3,988 3,911
Consultancy Projects 1,534 1,417 978 988
International Projects 153 1,683 1,688 1,610
TOTAL 20,735 21,060 20,188 19,753
ESTABLISHMENT
2016 2017 2018 2019
FTEs FTEs FTEs FTEs
Management 37 29 29 28
Technicians 219 210 195 188
Sales Team 125 117 117 117
Business Support 157 147 147 147
Consultancy Projects 33 32 28 28
International Projects 6 28 28 28
TOTAL 576 563 544 536
3 YEAR FINANCIAL PLAN
DASHBOARD
£0
£1,000 £2,000 £3,000 £4,000
£5,000
£6,000
£7,000
£8,000
£9,000
£10,000
2016
2017
2018
2019
Pay Costs
Interna4onal Projects Consultancy Projects Business Support Sales Team Technicians Management
0
50
100
150
200
250
2016
2017
2018
2019
FTEs Movement
Management Technicians Sales Team Business Support Interna4onal Projects Consultancy Projects
'000s
FTEs
5. 75
1000
NON PAY
2016 2017 2018 2019
£'000 £'000 £'000 £'000
Raw Materials 1,822 1,903 1,910 1,944
Metal Spinning 3,197 3,495 3,243 3,316
Metal Pressing 1,210 860 688 631
Metal Finishing 1,477 1,477 1,537 1,607
Metal Hemispheres 174 219 236 250
Metal Ballustrade Plates 144 160 180 200
Project Consultancy 728 467 503 540
Professional Fees 570 588 499 465
IT and Telephony 277 288 280 270
Business Support 877 899 866 824
Marketing and Sales 908 975 890 875
Factory Overheads 1,766 1,720 1,754 1,789
Waste Disposal & Recycling 416 420 410 407
International Projects 765 2,714 2,729 2,759
Depreciation and Interest 2,820 3,214 3,214 3,214
TOTAL 17,152 19,398 18,938 19,092
3 YEAR FINANCIAL PLAN
DASHBOARD
£-
£1,000
£2,000
£3,000
£4,000
2016 2017 2018 2019
Department Spend Movement
Raw Materials Metal Spinning Metal Pressing
Metal Finishing Metal Hemispheres Metal Ballustrade Plates
0%
20%
40%
60%
80%
100%
2016
2017
2018
2019
Other Spend Share
Project Consultancy Professional Fees IT and Telephony Business Support
MarkeNng and Sales Factory Overheads InternaNonal Projects DepreciaNon and Interest
'000s
6. 75
3 YEAR FINANCIAL PLAN
DASHBOARD
£29,500
£30,000
£30,500
£31,000
£31,500
£32,000
£32,500
£33,000
£33,500
£34,000
£34,500
537 503 488 480
Income v Cost Yield
Income Per FTE Cost per FTE europe only
'000s
-10.00%
0.00%
10.00%
20.00%
30.00%
40.00%
50.00%
60.00%
70.00%
2016 2017 2018 2019
Key Ra4os
Pay as a % of income OperaFng Profit as a % of income
Factory Overheads as % of non pay Professional Fees as a % of non pay
Business Units as a % non pay Project Consultancy as a % of non pay
0%
20%
40%
60%
80%
100%
2016
2017
2018
2019
12%
10%
11%
11%
44%
45%
44%
44%
16%
17%
18%
18%
20%
21% 22%
22%
7%
7% 5%
5%
Pay Composi4on
Management Technicians Sales Team Business Support Consultancy Projects
0
1,000
2,000
3,000
4,000
5,000
6,000
7,000
8,000
2016
2017
2018
2019
875
2,884
2,705
2,644
0
1,310
1,277
1,477
0
1,148
1,667
1,688
0
1,077
1,667
1,733
Interna4onal Projects
Dubai Free-Zone Kolkata Salt Lake, India Al QaFf, KSA Hangzhou, China
'000s