SlideShare uma empresa Scribd logo
1 de 26
Ranga Naik
Top N and Bottom N View on the Same Worksheet
This article helps you find the top and bottom N within the whole data set, Here, we will
create two side bar graphs in same work sheet, one is showing Top N values and the
other is showing Bottom N values .We Can achieve this one more than 5 methods . In
real time Every dashboard or chart created needs to support one common business
question What are the Top customers or products Or Players (it can be anything
Region , country , state level , city level etc) .
Steps to get Top N Bottom N view on the same worksheet:
Let’s use any data source example excel, csv or any database tables. I am going to use
superstore data source. Once you connected to data Follow the below steps
Method 1: Using Set
Most of the tableau developer aware about this method, but for beginner it will helpful.
Step 1:
Using the Superstore Sales data, create a horizontal bar chart showing the Sum of
Sales per sub category. To create this view drag sales in columns shelf and sub
category in Row shelf.
Step 2 :
Create Top N and Bottom N parameter that will allow users to choose different Values.
In my example I am going to create Top 5 and Bottom 5 selection parameter
Ranga Naik
Step 3:
Right Click on “Sub-Category” dimension present at the data pane section and then
select Create -> set
Step 4 :
Create a Set and name it as Top N Category.
Go to the Top filter tab -> Select By field -> Choose the parameter what you created i.e
Top N and Bottom N parameter.
Ranga Naik
Step 5:
Create one more set and name it as Bottom N Category follow above step instead of
“top” choose bottom
Step 6:
Now you have two sets, one for the TOP N VALUE and one for the BOTTOM N
VALUE.
Select both sets > right-click > Create Combined Set
Ranga Naik
Step 7:
Give Name as Top N and Bottom N combined set and choose All members in both
sets.
Step 8:
Now you can drag this new set “Top N and Bottom N combined set ” to the Filter
shelf and you can able to see your desired result. Sort it descending order, Enable show
mark label and choose show parameter control
Ranga Naik
Method 2: Using Index (), Size () function
Step 1:
Using the Superstore Sales data, create a horizontal bar chart showing the Sum of
Sales per sub category. To create this view drag sales in columns shelf and sub
category in Row shelf.
Step 2 :
Sort the sub category data to descending order
Click sub category from column shelf -> select sort -> choose sort order i.e
Descending -> Choose Sort By ( On which filed you want to short ) -> choose
aggregation
Ranga Naik
Step 3:
Create calculated filed i.e Top N and Bottom N and use parameter what you created in
method 1
In Calculation Mention any one of the formula i.e a or b
a) INDEX() <= [Top N and Bottom N Parameter]
OR
INDEX() >= Size() - [Top N and Bottom N Parameter]
Ranga Naik
b) INDEX() <= [Top N and Bottom N Parameter]
OR
[Top N and Bottom N Parameter] > Size() - INDEX()
Step 4:
Drag calculated field into filter shelf and choose “TRUE”
Ranga Naik
Step 5:
Enable the parameter and Label you will get desired result in a Single
view.
Method 3: Using First(), Size () function
Step 1:
Using the Superstore Sales data, create a horizontal bar chart showing the Sum of
Sales per sub category. To create this view drag sales in columns shelf and sub
category in Row shelf.
Step 2:
Sort the sub category data to descending order
Click sub category from column shelf -> select sort -> choose sort order i.e. Descending
-> Choose Sort By (On which filed you want to short) -> choose aggregation
Ranga Naik
Step 3:
Create calculated filed i.e Top N and Bottom N_first and use parameter what you
created in method 1
In Calculation Mention any one of the formula i.e a or b
a) -First() < [Top N and Bottom N parameter ]
OR
-First() >= Size() - [Top N and Bottom N parameter ]
Ranga Naik
b) -First() <[Top N and Bottom N parameter]
OR
[TopN and BottomN parameter] >= Size() +First()
Step 4:
Drag calculated field into filter shelf and choose “TRUE”
Ranga Naik
Step 5:
Enable the parameter and Label you will get desired result in a Single view.
Method 4: Using Last (), Size () function
Step 1:
Using the Superstore Sales data, create a horizontal bar chart showing the Sum of
Sales per sub category. To create this view drag sales in columns shelf and sub
category in Row shelf.
Step 2:
Sort the sub category data to descending order
Click sub category from column shelf -> select sort -> choose sort order i.e. Descending
-> Choose Sort By (On which filed you want to short) -> choose aggregation
Ranga Naik
Step 3:
Create calculated filed i.e Top N and Bottom N_last and use parameter what you
created in method 1
In Calculation Mention any one of the formula i.e a or b
a) LAST() >= Size() - [Top N and Bottom N parameter ]
OR
LAST () < [Top N and Bottom N parameter ]
Ranga Naik
b) [Top N and Bottom N parameter ] >= Size() - LAST()
OR
LAST () < [Top N and Bottom N parameter ]
Step 4:
Drag calculated field into filter shelf and choose “TRUE”
Ranga Naik
Step 5:
Enable the parameter and Label you will get desired result in a Single view.
Method 5: First() , LAST() Function
Step 1:
Using the Superstore Sales data, create a horizontal bar chart showing the Sum of
Sales per sub category. To create this view drag sales in columns shelf and sub
category in Row shelf.
Step 2:
Sort the sub category data to descending order
Click sub category from column shelf -> select sort -> choose sort order i.e. Descending
-> Choose Sort By (On which filed you want to short) -> choose aggregation
Ranga Naik
Step 3:
Create calculated filed i.e Top N and Bottom N_first_last and use parameter what
you created in method 1
In Calculation Mention below formula i.e
-FIRST() < [Top N and Bottom N parameter ]
OR
LAST () < [Top N and Bottom N parameter ]
Ranga Naik
Step 4:
Drag calculated field into filter shelf and choose “TRUE”
Step 5:
Enable the parameter and Label you will get desired result in a Single view.
Ranga Naik
Method 6: Rank_Unique () , size()
Step 1:
Using the Superstore Sales data, create a horizontal bar chart showing the Sum of
Sales per sub category. To create this view drag sales in columns shelf and sub
category in Row shelf.
Step 2:
Sort the sub category data to descending order
Click sub category from column shelf -> select sort -> choose sort order i.e. Descending
-> Choose Sort By (On which filed you want to short) -> choose aggregation
Step 3:
Create calculated filed i.e Top N and Bottom N_Rank_unique and use parameter
what you created in method 1
In Calculation Mention any one of the formula i.e a or b
a) RANK_UNIQUE(SUM([Sales])) <= [Top N and Bottom N parameter ]
OR
RANK_UNIQUE(SUM([Sales])) > size() -[Top N and Bottom N parameter ]
Ranga Naik
b) RANK_UNIQUE(SUM([Sales])) <= [Top N and Bottom N parameter ]
OR
[Top N and Bottom N parameter ] > size() -RANK_UNIQUE(SUM([Sales]))
Step 4:
Drag calculated field into filter shelf and choose “TRUE”
Ranga Naik
Step 5:
Enable the parameter and Label you will get desired result in a Single view.
Ranga Naik
Method 7: Rank () , size()
Step 1:
Using the Superstore Sales data, create a horizontal bar chart showing the Sum of
Sales per sub category. To create this view drag sales in columns shelf and sub
category in Row shelf.
Step 2:
Sort the sub category data to descending order
Click sub category from column shelf -> select sort -> choose sort order i.e. Descending
-> Choose Sort By (On which filed you want to short) -> choose aggregation
Step 3:
Create calculated filed i.e Top N and Bottom N_Rank and use parameter what you
created in method 1
In Calculation Mention any one of the formula i.e. a or b
a) RANK(SUM([Sales])) <= [Top N and Bottom N parameter ]
OR
RANK(SUM([Sales])) > SIZE() - [Top N and Bottom N parameter ]
Ranga Naik
b) RANK(SUM([Sales])) <= [Top N and Bottom N parameter ]
OR
[Top N and Bottom N parameter ] > SIZE() - RANK(SUM([Sales]))
Step 4:
Drag calculated field into filter shelf and choose “TRUE”
Ranga Naik
Step 5:
Enable the parameter and Label you will get desired result in a Single view.
Method 8: Rank_DENSE () , size()
Step 1:
Using the Superstore Sales data, create a horizontal bar chart showing the Sum of
Sales per sub category. To create this view drag sales in columns shelf and sub
category in Row shelf.
Ranga Naik
Step 2:
Sort the sub category data to descending order
Click sub category from column shelf -> select sort -> choose sort order i.e. Descending
-> Choose Sort By (On which filed you want to short) -> choose aggregation
Step 3:
Create calculated filed i.e Top N and Bottom N_Rank_dense and use parameter what
you created in method 1
In Calculation Mention any one of the formula i.e. a or b
a) RANK_DENSE(sum([Sales])) <= [Top N and Bottom N parameter ]
OR
RANK_DENSE(sum([Sales])) > SIZE() - [Top N and Bottom N parameter ]
Ranga Naik
b) RANK_DENSE(sum([Sales])) <= [Top N and Bottom N parameter ]
OR
[Top N and Bottom N parameter ] > SIZE() - RANK_DENSE(sum([Sales]))
Step 4:
Drag calculated field into filter shelf and choose “TRUE”
Step 5:
Enable the parameter and Label you will get desired result in a Single view.
Ranga Naik
Notes :
 If data contains duplicate measure values than go for Method 1 i.e. Using Set ,
Method 6 i.e Rank_Unique () , size() and Method 8 i.e Rank_dense (), size()
 Please refer below url for tableau workbook.
https://public.tableau.com/profile/publish/topnbottomnanalysis/rank_denseandsiz
emethod8#!/publish-confirm
Ranga Naik

Mais conteúdo relacionado

Mais procurados

GU_SAP S4 HANA_Define GL Account for Statistical Cost Element.docx
GU_SAP S4 HANA_Define GL Account for Statistical Cost Element.docxGU_SAP S4 HANA_Define GL Account for Statistical Cost Element.docx
GU_SAP S4 HANA_Define GL Account for Statistical Cost Element.docxMICKAEL QUESNOT
 
use and create spreadsheet.ppt
use and create spreadsheet.pptuse and create spreadsheet.ppt
use and create spreadsheet.pptJaleto Sunkemo
 
Subcontracting configuration
Subcontracting configurationSubcontracting configuration
Subcontracting configurationRamesh Kamishetty
 
Online trading ppt
Online trading ppt Online trading ppt
Online trading ppt petkarshwt
 
SAP SD Variant configuration-training-document 2
SAP SD Variant configuration-training-document 2SAP SD Variant configuration-training-document 2
SAP SD Variant configuration-training-document 2ramesh Charantimath
 
Pricing Procedure For Purchase Order
Pricing Procedure For Purchase OrderPricing Procedure For Purchase Order
Pricing Procedure For Purchase OrderRameswara Vedula
 
Variant Configuration
Variant ConfigurationVariant Configuration
Variant ConfigurationRama Y
 
Descriptive Statistics Part II: Graphical Description
Descriptive Statistics Part II: Graphical DescriptionDescriptive Statistics Part II: Graphical Description
Descriptive Statistics Part II: Graphical Descriptiongetyourcheaton
 
How To Create Subcontracting Process In SAP MM _ Tech Azmaan.pdf
How To Create Subcontracting Process In SAP MM _ Tech Azmaan.pdfHow To Create Subcontracting Process In SAP MM _ Tech Azmaan.pdf
How To Create Subcontracting Process In SAP MM _ Tech Azmaan.pdfkpkdhar36
 
Excel presentation data validation
Excel presentation   data validationExcel presentation   data validation
Excel presentation data validationNagamani Y R
 
Infrastructure of E- commerce and Issues of e-commerce infrastructure
Infrastructure of E- commerce and Issues of e-commerce infrastructureInfrastructure of E- commerce and Issues of e-commerce infrastructure
Infrastructure of E- commerce and Issues of e-commerce infrastructurePrince Sharma
 
55811936 product-costing-cost-estimation-in-sap
55811936 product-costing-cost-estimation-in-sap55811936 product-costing-cost-estimation-in-sap
55811936 product-costing-cost-estimation-in-sapPepa Pencheva
 
Invoice Verifications And Unplanned Delivery Costs
Invoice Verifications And Unplanned Delivery CostsInvoice Verifications And Unplanned Delivery Costs
Invoice Verifications And Unplanned Delivery CostsRameswara Vedula
 

Mais procurados (20)

GU_SAP S4 HANA_Define GL Account for Statistical Cost Element.docx
GU_SAP S4 HANA_Define GL Account for Statistical Cost Element.docxGU_SAP S4 HANA_Define GL Account for Statistical Cost Element.docx
GU_SAP S4 HANA_Define GL Account for Statistical Cost Element.docx
 
use and create spreadsheet.ppt
use and create spreadsheet.pptuse and create spreadsheet.ppt
use and create spreadsheet.ppt
 
Subcontracting configuration
Subcontracting configurationSubcontracting configuration
Subcontracting configuration
 
Online trading ppt
Online trading ppt Online trading ppt
Online trading ppt
 
SAP SD Variant configuration-training-document 2
SAP SD Variant configuration-training-document 2SAP SD Variant configuration-training-document 2
SAP SD Variant configuration-training-document 2
 
Display reports in tally
Display reports in tallyDisplay reports in tally
Display reports in tally
 
Pricing Procedure For Purchase Order
Pricing Procedure For Purchase OrderPricing Procedure For Purchase Order
Pricing Procedure For Purchase Order
 
Variant Configuration
Variant ConfigurationVariant Configuration
Variant Configuration
 
E business fundamentals
E  business fundamentalsE  business fundamentals
E business fundamentals
 
Descriptive Statistics Part II: Graphical Description
Descriptive Statistics Part II: Graphical DescriptionDescriptive Statistics Part II: Graphical Description
Descriptive Statistics Part II: Graphical Description
 
Sap edi idoc
Sap edi idocSap edi idoc
Sap edi idoc
 
How To Create Subcontracting Process In SAP MM _ Tech Azmaan.pdf
How To Create Subcontracting Process In SAP MM _ Tech Azmaan.pdfHow To Create Subcontracting Process In SAP MM _ Tech Azmaan.pdf
How To Create Subcontracting Process In SAP MM _ Tech Azmaan.pdf
 
Da 100-questions
Da 100-questionsDa 100-questions
Da 100-questions
 
92241650 split-valuation-configuration
92241650 split-valuation-configuration92241650 split-valuation-configuration
92241650 split-valuation-configuration
 
What is a special gl
What is a special glWhat is a special gl
What is a special gl
 
Sets in Tableau
Sets in TableauSets in Tableau
Sets in Tableau
 
Excel presentation data validation
Excel presentation   data validationExcel presentation   data validation
Excel presentation data validation
 
Infrastructure of E- commerce and Issues of e-commerce infrastructure
Infrastructure of E- commerce and Issues of e-commerce infrastructureInfrastructure of E- commerce and Issues of e-commerce infrastructure
Infrastructure of E- commerce and Issues of e-commerce infrastructure
 
55811936 product-costing-cost-estimation-in-sap
55811936 product-costing-cost-estimation-in-sap55811936 product-costing-cost-estimation-in-sap
55811936 product-costing-cost-estimation-in-sap
 
Invoice Verifications And Unplanned Delivery Costs
Invoice Verifications And Unplanned Delivery CostsInvoice Verifications And Unplanned Delivery Costs
Invoice Verifications And Unplanned Delivery Costs
 

Semelhante a Top N and bottom N view on the same worksheet In Tableau

Semelhante a Top N and bottom N view on the same worksheet In Tableau (20)

Tableau - bump chart
Tableau - bump chartTableau - bump chart
Tableau - bump chart
 
Easy Pivot Tutorial June 2020
Easy Pivot Tutorial June 2020Easy Pivot Tutorial June 2020
Easy Pivot Tutorial June 2020
 
Tableau - waterfall charts
Tableau - waterfall chartsTableau - waterfall charts
Tableau - waterfall charts
 
Advanced excel unit 01
Advanced excel unit 01Advanced excel unit 01
Advanced excel unit 01
 
Parameters in Tableau
Parameters in TableauParameters in Tableau
Parameters in Tableau
 
Bar chart Creation
Bar chart CreationBar chart Creation
Bar chart Creation
 
A Skills Approach Excel 2016 Chapter 8 Exploring Advanced D.docx
A Skills Approach Excel 2016  Chapter 8 Exploring Advanced D.docxA Skills Approach Excel 2016  Chapter 8 Exploring Advanced D.docx
A Skills Approach Excel 2016 Chapter 8 Exploring Advanced D.docx
 
Creating modeled views
Creating modeled viewsCreating modeled views
Creating modeled views
 
Alv report-tutorial-www.sapexpert.co .uk-
Alv report-tutorial-www.sapexpert.co .uk-Alv report-tutorial-www.sapexpert.co .uk-
Alv report-tutorial-www.sapexpert.co .uk-
 
Tableau.pdf
Tableau.pdfTableau.pdf
Tableau.pdf
 
Advanced Top N Measures in Power BI
Advanced Top N Measures in Power BIAdvanced Top N Measures in Power BI
Advanced Top N Measures in Power BI
 
How to design a report with fine report reporting tool
How to design a report with  fine report reporting toolHow to design a report with  fine report reporting tool
How to design a report with fine report reporting tool
 
Birt crosstabtutorialadvanced
Birt crosstabtutorialadvancedBirt crosstabtutorialadvanced
Birt crosstabtutorialadvanced
 
Visualizing Data using Tableau
Visualizing Data using TableauVisualizing Data using Tableau
Visualizing Data using Tableau
 
Itb weka
Itb wekaItb weka
Itb weka
 
Tableau - crosstab
Tableau - crosstabTableau - crosstab
Tableau - crosstab
 
003.query
003.query003.query
003.query
 
Computer Applications in Business Tally unit 5
Computer Applications in Business Tally  unit 5Computer Applications in Business Tally  unit 5
Computer Applications in Business Tally unit 5
 
Power BI Tips Top N Measures.pptx
Power BI Tips Top N Measures.pptxPower BI Tips Top N Measures.pptx
Power BI Tips Top N Measures.pptx
 
Tableau scatter plot
Tableau   scatter plotTableau   scatter plot
Tableau scatter plot
 

Último

Ranking and Scoring Exercises for Research
Ranking and Scoring Exercises for ResearchRanking and Scoring Exercises for Research
Ranking and Scoring Exercises for ResearchRajesh Mondal
 
Dubai Call Girls Peeing O525547819 Call Girls Dubai
Dubai Call Girls Peeing O525547819 Call Girls DubaiDubai Call Girls Peeing O525547819 Call Girls Dubai
Dubai Call Girls Peeing O525547819 Call Girls Dubaikojalkojal131
 
Predicting HDB Resale Prices - Conducting Linear Regression Analysis With Orange
Predicting HDB Resale Prices - Conducting Linear Regression Analysis With OrangePredicting HDB Resale Prices - Conducting Linear Regression Analysis With Orange
Predicting HDB Resale Prices - Conducting Linear Regression Analysis With OrangeThinkInnovation
 
Sealdah % High Class Call Girls Kolkata - 450+ Call Girl Cash Payment 8005736...
Sealdah % High Class Call Girls Kolkata - 450+ Call Girl Cash Payment 8005736...Sealdah % High Class Call Girls Kolkata - 450+ Call Girl Cash Payment 8005736...
Sealdah % High Class Call Girls Kolkata - 450+ Call Girl Cash Payment 8005736...HyderabadDolls
 
Digital Transformation Playbook by Graham Ware
Digital Transformation Playbook by Graham WareDigital Transformation Playbook by Graham Ware
Digital Transformation Playbook by Graham WareGraham Ware
 
Jual Obat Aborsi Surabaya ( Asli No.1 ) 085657271886 Obat Penggugur Kandungan...
Jual Obat Aborsi Surabaya ( Asli No.1 ) 085657271886 Obat Penggugur Kandungan...Jual Obat Aborsi Surabaya ( Asli No.1 ) 085657271886 Obat Penggugur Kandungan...
Jual Obat Aborsi Surabaya ( Asli No.1 ) 085657271886 Obat Penggugur Kandungan...ZurliaSoop
 
High Profile Call Girls Service in Jalore { 9332606886 } VVIP NISHA Call Girl...
High Profile Call Girls Service in Jalore { 9332606886 } VVIP NISHA Call Girl...High Profile Call Girls Service in Jalore { 9332606886 } VVIP NISHA Call Girl...
High Profile Call Girls Service in Jalore { 9332606886 } VVIP NISHA Call Girl...kumargunjan9515
 
+97470301568>>weed for sale in qatar ,weed for sale in dubai,weed for sale in...
+97470301568>>weed for sale in qatar ,weed for sale in dubai,weed for sale in...+97470301568>>weed for sale in qatar ,weed for sale in dubai,weed for sale in...
+97470301568>>weed for sale in qatar ,weed for sale in dubai,weed for sale in...Health
 
Top profile Call Girls In Satna [ 7014168258 ] Call Me For Genuine Models We ...
Top profile Call Girls In Satna [ 7014168258 ] Call Me For Genuine Models We ...Top profile Call Girls In Satna [ 7014168258 ] Call Me For Genuine Models We ...
Top profile Call Girls In Satna [ 7014168258 ] Call Me For Genuine Models We ...nirzagarg
 
Top profile Call Girls In Vadodara [ 7014168258 ] Call Me For Genuine Models ...
Top profile Call Girls In Vadodara [ 7014168258 ] Call Me For Genuine Models ...Top profile Call Girls In Vadodara [ 7014168258 ] Call Me For Genuine Models ...
Top profile Call Girls In Vadodara [ 7014168258 ] Call Me For Genuine Models ...gajnagarg
 
5CL-ADBA,5cladba, Chinese supplier, safety is guaranteed
5CL-ADBA,5cladba, Chinese supplier, safety is guaranteed5CL-ADBA,5cladba, Chinese supplier, safety is guaranteed
5CL-ADBA,5cladba, Chinese supplier, safety is guaranteedamy56318795
 
Top profile Call Girls In dimapur [ 7014168258 ] Call Me For Genuine Models W...
Top profile Call Girls In dimapur [ 7014168258 ] Call Me For Genuine Models W...Top profile Call Girls In dimapur [ 7014168258 ] Call Me For Genuine Models W...
Top profile Call Girls In dimapur [ 7014168258 ] Call Me For Genuine Models W...gajnagarg
 
20240412-SmartCityIndex-2024-Full-Report.pdf
20240412-SmartCityIndex-2024-Full-Report.pdf20240412-SmartCityIndex-2024-Full-Report.pdf
20240412-SmartCityIndex-2024-Full-Report.pdfkhraisr
 
DATA SUMMIT 24 Building Real-Time Pipelines With FLaNK
DATA SUMMIT 24  Building Real-Time Pipelines With FLaNKDATA SUMMIT 24  Building Real-Time Pipelines With FLaNK
DATA SUMMIT 24 Building Real-Time Pipelines With FLaNKTimothy Spann
 
Top profile Call Girls In Indore [ 7014168258 ] Call Me For Genuine Models We...
Top profile Call Girls In Indore [ 7014168258 ] Call Me For Genuine Models We...Top profile Call Girls In Indore [ 7014168258 ] Call Me For Genuine Models We...
Top profile Call Girls In Indore [ 7014168258 ] Call Me For Genuine Models We...gajnagarg
 
Gulbai Tekra * Cheap Call Girls In Ahmedabad Phone No 8005736733 Elite Escort...
Gulbai Tekra * Cheap Call Girls In Ahmedabad Phone No 8005736733 Elite Escort...Gulbai Tekra * Cheap Call Girls In Ahmedabad Phone No 8005736733 Elite Escort...
Gulbai Tekra * Cheap Call Girls In Ahmedabad Phone No 8005736733 Elite Escort...gragchanchal546
 
Jodhpur Park | Call Girls in Kolkata Phone No 8005736733 Elite Escort Service...
Jodhpur Park | Call Girls in Kolkata Phone No 8005736733 Elite Escort Service...Jodhpur Park | Call Girls in Kolkata Phone No 8005736733 Elite Escort Service...
Jodhpur Park | Call Girls in Kolkata Phone No 8005736733 Elite Escort Service...HyderabadDolls
 
SAC 25 Final National, Regional & Local Angel Group Investing Insights 2024 0...
SAC 25 Final National, Regional & Local Angel Group Investing Insights 2024 0...SAC 25 Final National, Regional & Local Angel Group Investing Insights 2024 0...
SAC 25 Final National, Regional & Local Angel Group Investing Insights 2024 0...Elaine Werffeli
 
7. Epi of Chronic respiratory diseases.ppt
7. Epi of Chronic respiratory diseases.ppt7. Epi of Chronic respiratory diseases.ppt
7. Epi of Chronic respiratory diseases.pptibrahimabdi22
 

Último (20)

Ranking and Scoring Exercises for Research
Ranking and Scoring Exercises for ResearchRanking and Scoring Exercises for Research
Ranking and Scoring Exercises for Research
 
Dubai Call Girls Peeing O525547819 Call Girls Dubai
Dubai Call Girls Peeing O525547819 Call Girls DubaiDubai Call Girls Peeing O525547819 Call Girls Dubai
Dubai Call Girls Peeing O525547819 Call Girls Dubai
 
Abortion pills in Jeddah | +966572737505 | Get Cytotec
Abortion pills in Jeddah | +966572737505 | Get CytotecAbortion pills in Jeddah | +966572737505 | Get Cytotec
Abortion pills in Jeddah | +966572737505 | Get Cytotec
 
Predicting HDB Resale Prices - Conducting Linear Regression Analysis With Orange
Predicting HDB Resale Prices - Conducting Linear Regression Analysis With OrangePredicting HDB Resale Prices - Conducting Linear Regression Analysis With Orange
Predicting HDB Resale Prices - Conducting Linear Regression Analysis With Orange
 
Sealdah % High Class Call Girls Kolkata - 450+ Call Girl Cash Payment 8005736...
Sealdah % High Class Call Girls Kolkata - 450+ Call Girl Cash Payment 8005736...Sealdah % High Class Call Girls Kolkata - 450+ Call Girl Cash Payment 8005736...
Sealdah % High Class Call Girls Kolkata - 450+ Call Girl Cash Payment 8005736...
 
Digital Transformation Playbook by Graham Ware
Digital Transformation Playbook by Graham WareDigital Transformation Playbook by Graham Ware
Digital Transformation Playbook by Graham Ware
 
Jual Obat Aborsi Surabaya ( Asli No.1 ) 085657271886 Obat Penggugur Kandungan...
Jual Obat Aborsi Surabaya ( Asli No.1 ) 085657271886 Obat Penggugur Kandungan...Jual Obat Aborsi Surabaya ( Asli No.1 ) 085657271886 Obat Penggugur Kandungan...
Jual Obat Aborsi Surabaya ( Asli No.1 ) 085657271886 Obat Penggugur Kandungan...
 
High Profile Call Girls Service in Jalore { 9332606886 } VVIP NISHA Call Girl...
High Profile Call Girls Service in Jalore { 9332606886 } VVIP NISHA Call Girl...High Profile Call Girls Service in Jalore { 9332606886 } VVIP NISHA Call Girl...
High Profile Call Girls Service in Jalore { 9332606886 } VVIP NISHA Call Girl...
 
+97470301568>>weed for sale in qatar ,weed for sale in dubai,weed for sale in...
+97470301568>>weed for sale in qatar ,weed for sale in dubai,weed for sale in...+97470301568>>weed for sale in qatar ,weed for sale in dubai,weed for sale in...
+97470301568>>weed for sale in qatar ,weed for sale in dubai,weed for sale in...
 
Top profile Call Girls In Satna [ 7014168258 ] Call Me For Genuine Models We ...
Top profile Call Girls In Satna [ 7014168258 ] Call Me For Genuine Models We ...Top profile Call Girls In Satna [ 7014168258 ] Call Me For Genuine Models We ...
Top profile Call Girls In Satna [ 7014168258 ] Call Me For Genuine Models We ...
 
Top profile Call Girls In Vadodara [ 7014168258 ] Call Me For Genuine Models ...
Top profile Call Girls In Vadodara [ 7014168258 ] Call Me For Genuine Models ...Top profile Call Girls In Vadodara [ 7014168258 ] Call Me For Genuine Models ...
Top profile Call Girls In Vadodara [ 7014168258 ] Call Me For Genuine Models ...
 
5CL-ADBA,5cladba, Chinese supplier, safety is guaranteed
5CL-ADBA,5cladba, Chinese supplier, safety is guaranteed5CL-ADBA,5cladba, Chinese supplier, safety is guaranteed
5CL-ADBA,5cladba, Chinese supplier, safety is guaranteed
 
Top profile Call Girls In dimapur [ 7014168258 ] Call Me For Genuine Models W...
Top profile Call Girls In dimapur [ 7014168258 ] Call Me For Genuine Models W...Top profile Call Girls In dimapur [ 7014168258 ] Call Me For Genuine Models W...
Top profile Call Girls In dimapur [ 7014168258 ] Call Me For Genuine Models W...
 
20240412-SmartCityIndex-2024-Full-Report.pdf
20240412-SmartCityIndex-2024-Full-Report.pdf20240412-SmartCityIndex-2024-Full-Report.pdf
20240412-SmartCityIndex-2024-Full-Report.pdf
 
DATA SUMMIT 24 Building Real-Time Pipelines With FLaNK
DATA SUMMIT 24  Building Real-Time Pipelines With FLaNKDATA SUMMIT 24  Building Real-Time Pipelines With FLaNK
DATA SUMMIT 24 Building Real-Time Pipelines With FLaNK
 
Top profile Call Girls In Indore [ 7014168258 ] Call Me For Genuine Models We...
Top profile Call Girls In Indore [ 7014168258 ] Call Me For Genuine Models We...Top profile Call Girls In Indore [ 7014168258 ] Call Me For Genuine Models We...
Top profile Call Girls In Indore [ 7014168258 ] Call Me For Genuine Models We...
 
Gulbai Tekra * Cheap Call Girls In Ahmedabad Phone No 8005736733 Elite Escort...
Gulbai Tekra * Cheap Call Girls In Ahmedabad Phone No 8005736733 Elite Escort...Gulbai Tekra * Cheap Call Girls In Ahmedabad Phone No 8005736733 Elite Escort...
Gulbai Tekra * Cheap Call Girls In Ahmedabad Phone No 8005736733 Elite Escort...
 
Jodhpur Park | Call Girls in Kolkata Phone No 8005736733 Elite Escort Service...
Jodhpur Park | Call Girls in Kolkata Phone No 8005736733 Elite Escort Service...Jodhpur Park | Call Girls in Kolkata Phone No 8005736733 Elite Escort Service...
Jodhpur Park | Call Girls in Kolkata Phone No 8005736733 Elite Escort Service...
 
SAC 25 Final National, Regional & Local Angel Group Investing Insights 2024 0...
SAC 25 Final National, Regional & Local Angel Group Investing Insights 2024 0...SAC 25 Final National, Regional & Local Angel Group Investing Insights 2024 0...
SAC 25 Final National, Regional & Local Angel Group Investing Insights 2024 0...
 
7. Epi of Chronic respiratory diseases.ppt
7. Epi of Chronic respiratory diseases.ppt7. Epi of Chronic respiratory diseases.ppt
7. Epi of Chronic respiratory diseases.ppt
 

Top N and bottom N view on the same worksheet In Tableau

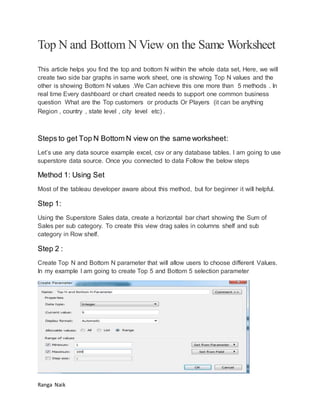
  • 1. Ranga Naik Top N and Bottom N View on the Same Worksheet This article helps you find the top and bottom N within the whole data set, Here, we will create two side bar graphs in same work sheet, one is showing Top N values and the other is showing Bottom N values .We Can achieve this one more than 5 methods . In real time Every dashboard or chart created needs to support one common business question What are the Top customers or products Or Players (it can be anything Region , country , state level , city level etc) . Steps to get Top N Bottom N view on the same worksheet: Let’s use any data source example excel, csv or any database tables. I am going to use superstore data source. Once you connected to data Follow the below steps Method 1: Using Set Most of the tableau developer aware about this method, but for beginner it will helpful. Step 1: Using the Superstore Sales data, create a horizontal bar chart showing the Sum of Sales per sub category. To create this view drag sales in columns shelf and sub category in Row shelf. Step 2 : Create Top N and Bottom N parameter that will allow users to choose different Values. In my example I am going to create Top 5 and Bottom 5 selection parameter
  • 2. Ranga Naik Step 3: Right Click on “Sub-Category” dimension present at the data pane section and then select Create -> set Step 4 : Create a Set and name it as Top N Category. Go to the Top filter tab -> Select By field -> Choose the parameter what you created i.e Top N and Bottom N parameter.
  • 3. Ranga Naik Step 5: Create one more set and name it as Bottom N Category follow above step instead of “top” choose bottom Step 6: Now you have two sets, one for the TOP N VALUE and one for the BOTTOM N VALUE. Select both sets > right-click > Create Combined Set
  • 4. Ranga Naik Step 7: Give Name as Top N and Bottom N combined set and choose All members in both sets. Step 8: Now you can drag this new set “Top N and Bottom N combined set ” to the Filter shelf and you can able to see your desired result. Sort it descending order, Enable show mark label and choose show parameter control
  • 5. Ranga Naik Method 2: Using Index (), Size () function Step 1: Using the Superstore Sales data, create a horizontal bar chart showing the Sum of Sales per sub category. To create this view drag sales in columns shelf and sub category in Row shelf. Step 2 : Sort the sub category data to descending order Click sub category from column shelf -> select sort -> choose sort order i.e Descending -> Choose Sort By ( On which filed you want to short ) -> choose aggregation
  • 6. Ranga Naik Step 3: Create calculated filed i.e Top N and Bottom N and use parameter what you created in method 1 In Calculation Mention any one of the formula i.e a or b a) INDEX() <= [Top N and Bottom N Parameter] OR INDEX() >= Size() - [Top N and Bottom N Parameter]
  • 7. Ranga Naik b) INDEX() <= [Top N and Bottom N Parameter] OR [Top N and Bottom N Parameter] > Size() - INDEX() Step 4: Drag calculated field into filter shelf and choose “TRUE”
  • 8. Ranga Naik Step 5: Enable the parameter and Label you will get desired result in a Single view. Method 3: Using First(), Size () function Step 1: Using the Superstore Sales data, create a horizontal bar chart showing the Sum of Sales per sub category. To create this view drag sales in columns shelf and sub category in Row shelf. Step 2: Sort the sub category data to descending order Click sub category from column shelf -> select sort -> choose sort order i.e. Descending -> Choose Sort By (On which filed you want to short) -> choose aggregation
  • 9. Ranga Naik Step 3: Create calculated filed i.e Top N and Bottom N_first and use parameter what you created in method 1 In Calculation Mention any one of the formula i.e a or b a) -First() < [Top N and Bottom N parameter ] OR -First() >= Size() - [Top N and Bottom N parameter ]
  • 10. Ranga Naik b) -First() <[Top N and Bottom N parameter] OR [TopN and BottomN parameter] >= Size() +First() Step 4: Drag calculated field into filter shelf and choose “TRUE”
  • 11. Ranga Naik Step 5: Enable the parameter and Label you will get desired result in a Single view. Method 4: Using Last (), Size () function Step 1: Using the Superstore Sales data, create a horizontal bar chart showing the Sum of Sales per sub category. To create this view drag sales in columns shelf and sub category in Row shelf. Step 2: Sort the sub category data to descending order Click sub category from column shelf -> select sort -> choose sort order i.e. Descending -> Choose Sort By (On which filed you want to short) -> choose aggregation
  • 12. Ranga Naik Step 3: Create calculated filed i.e Top N and Bottom N_last and use parameter what you created in method 1 In Calculation Mention any one of the formula i.e a or b a) LAST() >= Size() - [Top N and Bottom N parameter ] OR LAST () < [Top N and Bottom N parameter ]
  • 13. Ranga Naik b) [Top N and Bottom N parameter ] >= Size() - LAST() OR LAST () < [Top N and Bottom N parameter ] Step 4: Drag calculated field into filter shelf and choose “TRUE”
  • 14. Ranga Naik Step 5: Enable the parameter and Label you will get desired result in a Single view. Method 5: First() , LAST() Function Step 1: Using the Superstore Sales data, create a horizontal bar chart showing the Sum of Sales per sub category. To create this view drag sales in columns shelf and sub category in Row shelf. Step 2: Sort the sub category data to descending order Click sub category from column shelf -> select sort -> choose sort order i.e. Descending -> Choose Sort By (On which filed you want to short) -> choose aggregation
  • 15. Ranga Naik Step 3: Create calculated filed i.e Top N and Bottom N_first_last and use parameter what you created in method 1 In Calculation Mention below formula i.e -FIRST() < [Top N and Bottom N parameter ] OR LAST () < [Top N and Bottom N parameter ]
  • 16. Ranga Naik Step 4: Drag calculated field into filter shelf and choose “TRUE” Step 5: Enable the parameter and Label you will get desired result in a Single view.
  • 17. Ranga Naik Method 6: Rank_Unique () , size() Step 1: Using the Superstore Sales data, create a horizontal bar chart showing the Sum of Sales per sub category. To create this view drag sales in columns shelf and sub category in Row shelf. Step 2: Sort the sub category data to descending order Click sub category from column shelf -> select sort -> choose sort order i.e. Descending -> Choose Sort By (On which filed you want to short) -> choose aggregation Step 3: Create calculated filed i.e Top N and Bottom N_Rank_unique and use parameter what you created in method 1 In Calculation Mention any one of the formula i.e a or b a) RANK_UNIQUE(SUM([Sales])) <= [Top N and Bottom N parameter ] OR RANK_UNIQUE(SUM([Sales])) > size() -[Top N and Bottom N parameter ]
  • 18. Ranga Naik b) RANK_UNIQUE(SUM([Sales])) <= [Top N and Bottom N parameter ] OR [Top N and Bottom N parameter ] > size() -RANK_UNIQUE(SUM([Sales])) Step 4: Drag calculated field into filter shelf and choose “TRUE”
  • 19. Ranga Naik Step 5: Enable the parameter and Label you will get desired result in a Single view.
  • 20. Ranga Naik Method 7: Rank () , size() Step 1: Using the Superstore Sales data, create a horizontal bar chart showing the Sum of Sales per sub category. To create this view drag sales in columns shelf and sub category in Row shelf. Step 2: Sort the sub category data to descending order Click sub category from column shelf -> select sort -> choose sort order i.e. Descending -> Choose Sort By (On which filed you want to short) -> choose aggregation Step 3: Create calculated filed i.e Top N and Bottom N_Rank and use parameter what you created in method 1 In Calculation Mention any one of the formula i.e. a or b a) RANK(SUM([Sales])) <= [Top N and Bottom N parameter ] OR RANK(SUM([Sales])) > SIZE() - [Top N and Bottom N parameter ]
  • 21. Ranga Naik b) RANK(SUM([Sales])) <= [Top N and Bottom N parameter ] OR [Top N and Bottom N parameter ] > SIZE() - RANK(SUM([Sales])) Step 4: Drag calculated field into filter shelf and choose “TRUE”
  • 22. Ranga Naik Step 5: Enable the parameter and Label you will get desired result in a Single view. Method 8: Rank_DENSE () , size() Step 1: Using the Superstore Sales data, create a horizontal bar chart showing the Sum of Sales per sub category. To create this view drag sales in columns shelf and sub category in Row shelf.
  • 23. Ranga Naik Step 2: Sort the sub category data to descending order Click sub category from column shelf -> select sort -> choose sort order i.e. Descending -> Choose Sort By (On which filed you want to short) -> choose aggregation Step 3: Create calculated filed i.e Top N and Bottom N_Rank_dense and use parameter what you created in method 1 In Calculation Mention any one of the formula i.e. a or b a) RANK_DENSE(sum([Sales])) <= [Top N and Bottom N parameter ] OR RANK_DENSE(sum([Sales])) > SIZE() - [Top N and Bottom N parameter ]
  • 24. Ranga Naik b) RANK_DENSE(sum([Sales])) <= [Top N and Bottom N parameter ] OR [Top N and Bottom N parameter ] > SIZE() - RANK_DENSE(sum([Sales])) Step 4: Drag calculated field into filter shelf and choose “TRUE” Step 5: Enable the parameter and Label you will get desired result in a Single view.
  • 25. Ranga Naik Notes :  If data contains duplicate measure values than go for Method 1 i.e. Using Set , Method 6 i.e Rank_Unique () , size() and Method 8 i.e Rank_dense (), size()  Please refer below url for tableau workbook. https://public.tableau.com/profile/publish/topnbottomnanalysis/rank_denseandsiz emethod8#!/publish-confirm