1. Introduction of Statistics
Economic and Non-economic Activities
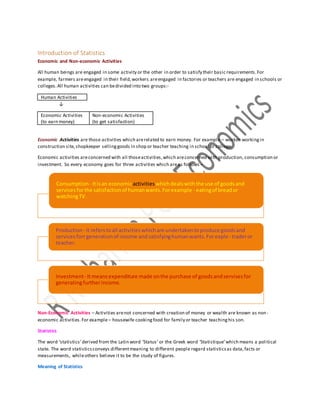
All human beings are engaged in some activity or the other in order to satisfy their basic requirements.For
example, farmers areengaged in their field,workers areengaged in factories or teachers are engaged in schools or
colleges.All human activities can bedivided into two groups:-
Human Activities
↓
Economic Activities
(to earn money)
Non-economic Activities
(to get satisfaction)
Economic Activities are those activities which arerelated to earn money. For example – worker workingin
construction site,shopkeeper sellinggoods in shop or teacher teaching in school or college.
Economic activities areconcerned with all thoseactivities,which areconcerned with production, consumption or
investment. So every economy goes for three activities which areas follows –
Non-Economic Activities – Activities arenot concerned with creation of money or wealth are known as non-
economic activities.For example– housewife cookingfood for family or teacher teachinghis son.
Statistics
The word ‘statistics’derived from the Latin word ‘Status’ or the Greek word ‘Statistique’which means a political
state. The word statisticsconveys differentmeaning to different people regard statisticsas data,facts or
measurements, whileothers believe it to be the study of figures.
Meaning of Statistics
Consumption - Itisan economicactivitieswhichdealswiththe use of goodsand
servicesforthe satisfactionof humanwants.Forexample - eatingof breador
watchingTV.
Production- It referstoall activitieswhichare undertakentoproduce goodsand
servicesforrgenerationof income andsatisfyinghumanwants.Forexple- traderor
teacher.
Investment- Itmeansexpenditure made onthe purchase of goodsandservisesfor
generatingfurtherincome.
2. 1
Statistics has been defined differently by different writers from time to time, emphasizingprécisingthemeaning,
scope and limitation of the subject.Some writers have defined statistics asstatistical data (plural sense),whereas
others as statistical methods (singular sense).
Statistics as a Plural Sense
In plural sense,statisticsrefers to aggregates of facts,affected to a marked extent by multiplicity of causes,
numerically expressed,enumerated or estimated accordingto reasonablestandardsof accuracy,collected in a
systematic manner for predetermined purpose and placed in relation to each other. In simplewords,it means a
collection of numerical facts.
Features of Statistics as a Plural Sense
Statistics has followingfeatures –
(a) Aggregates of facts – Statistics area number of facts.Singleand isolated figures arenot statistics assuch
figures cannot be compared. For example, a single student’s mark 88 is not a statistics,buta series
relatingto average marks of students in the class will becalled statistics.
(b) Affected by multiplicity of causes – Numerical data are influenced by variety of factors.Itis not easy job
to study the effects of any one factor separately by ignoringother factors.For example, agriculturecrop
likericeis affected by the rainfall,fertilizers,seeds,method of cultivation etc. It is notpossibleto study
separately the effect of each of these forces on the production of rice.
(c) Statistics are numerically expressed – The statistical approach to a subjectis numerical.So,any facts,to
be called statistics,mustbe numerically or quantitatively expressed.For example, Ishita istaller than
Manyata and Ankita, will notbe called statistics.However, if the same facts are expressed in nubbers (like
Ishita:160 cm, Manyata: 150 cm and Ankita: 145 cm), will call statistics.
(d) Statistics should be collected with reasonable standard of accuracy – Data is collected with reasonable
accuracy.For example, when we say that 40 students were present in the class,we areenumerating the
number of students present in the class.Butwhen a news channel says thatthere are 2000 casualties in
the earthquake in Nepal on April 25, 2015,then the news channel is simply estimatingthenumber of
casualties.
(e) Statistics are collected for a predetermined purpose – The purpose of collectingstatistical data mustbe
decided in advance, otherwise usefulness of the data collected would be negligible.Data collected in an
unsystematic manner and without complete awareness of the purpose will beconfusingand cannot be
made on the basis of valid conclusions.
(f) Statistics are collected in a systematic manner – For accuracy or reliability of data,the figures should be
collected in a systematic manner, the reliability of such data will deteriorate.
(g) Statistics should be placed in relation to each other – Collection of statistical data aregenerally
done with the motive to compare.
Statistics as a Singular Sense
In singular sense,the term statisticsmeans statistical method, i.e. itis a method of dealingwith numerical facts.
• Collection - It is the main and the firststep in a statistical inquiry.Thetechnique of collection of data
depends upon the objectiveof the study.
• Organization of data - After collection of data,the data is organised in a proper form which involves
editing and classification.
• Presentation of data - After classification,thedata is presented in some suitablemanner,in the form of
text, table, diagramor graph.
3. 2
• Analysis of data - After presentation of data,analysis isdonewith the help of simplestatistical techniques.
Like as measures of central tendency or measures of dispersion.
• Interpretation of data - It is the laststep in the statistical methodology.
Distinguish between Plural Sense V/s Singular Sense
Plural Sense Singular Sense
Statistics deals with numerical information. Statistics is a body of various methods and tools.
It is descriptive in nature. It is basically a tool of analysis.
It is often in the raw state. It helps in processing the raw data.
It is quantitative. It is an operational technique.
Function of Statistics
It performs many functions useful to human beings which areas follows –
1. To simplify complex facts – It is very difficultfor an individual to understand and concludefrom huge
numerical data.Statistical methods try to understand great mass of complex data into simpleand
understandableform. For example, statistical techniques likemean, correlation,graph etc. make
complex data intelligibleand understandablein shortperiod and better way.
2. To present facts in definite form – Quantitativefacts can easily bebelieved and trusted in
comparison to abstractand qualitativefacts.Statistics summarizes the generalized facts and present
them in definite form. For example, inflation in Indiais8%annually,ismoreconvincinglikeprices are
rising.
3. To make comparison – Comparison is oneof the main functions of statistics astheabsolutefigures
convey a less concrete meaning. For comparison variousstatistical methods likeaverages,ratio etc.
are used.
4. To facilitate planning and policy formulation – On the basis of numerical data and their analysis,
businessmen and administratorscan plan futureactivities and shapetheir policies.
5. To help in forecasting – As business is full of risksand uncertainties,correctforecastingis essential to
reduce the uncertainties of business.Statistical tools (timeseries analysis) helps in making
projections for future.
6. Formulation and testing of hypothesis – Statistics methods areextremely useful in formulatingand
testing hypothesis.For example, we can test the hypothesis,whether a risein railway fares and
freights will affectpassenger traffic or goods traffic or not.
7. To enlarge individual knowledge and experience – Statistics enablepeople to enlarge their horizon.
It sharpens the faculty of rational thinkingand reasoning,and is helpful in propoundingnew theories
and concepts.
Importance of Statistics
A. Importance to the Government
B. Importance in Economics
C. Importance in Economic Planning
D. Importance in Business
Importance to the Government
In the present scenario,Government collects the largestamount of statisticsfor variouspurposes.
4. 3
The role of government has increased and requires much greater information in the form of numerical
figures,to fulfill thewelfare objectives in addition to the efficient runningof their administration.
Popular statistical methods such as time-series analysis,index numbers,forecastingand demand analysis
are extensively used in formulatingeconomic policies.
In a democratic country likeIndia,variouspolitical groups arealso guided by the statistical analysis
regardingtheir popularity in the masses.
Importance of Statistics in Economics
Formulation of economic laws – Law of demand and concept of elasticity of demand have been
developed by the inductivemethod of generalization,which is also based on statistical principles.
Statistical data and statistical methods play a vital rolein understandingand solvingeconomic
problems such as poverty, unemployment, disparitiesin the distribution of incomeand wealth etc.
Study of market structures requires statistical comparison of market prices,costand profits of
individual firms.
Statistical methods can be used to estimate mathematical relation between various economic
variables.
Trend-series analysis isused to study the behavior of prices,production and consumption of
commodities, money in circulation and bank deposits and clearings.
Statistical surveys of prices helps in studyingthe theories of prices,pricepolicy and pricetrends as
well as their relationship to the general problem of inflation.
Importance of Statistics in Economic planning
At every stage of economic planning,there is a need for figures and statistical methods.
Usingstatistical techniques,itis possibleto assess theamounts of various resources availablein
the economy and accordingly determine whether the specified rate of growth is sustainableor
not.
Statistical analysisof data regardingan economy may reveal certain crucial areas,likeincreasing
rate of inflation,which may require immediate attention.
Importance of Statistics in Business
For establishinga businessunit
For estimatingthe demand of product
For production planning
For makingquality control
For marketing strategy
Accounts writing and auditing
Limitations of Statistics
(a) Statistics does not study qualitative phenomena – Statistics can beapplied in studyingonly those
problems which can be stated and expressed quantitatively.
- Qualitativecharacteristicssuch ashonesty,poverty, welfare, beauty, health etc. cannot be
measured quantitatively.
(b) Statistics does not deal with individuals – Statistics deals only with aggregates of facts and no
importance is attached to individual items.For example, marks of one student of a class does not
constitute statistics,butthe averages marks have statistical relevance.
(c) Statistics can be misused – Statistics can bemisused by ignorantor wrongly motivated persons.Any
person can misusestatistics and drawany type of conclusion helikes.
(d) Statistical results are true only on average – Statistics,as a science,is notas accurateas many other
sciences are.Natural sciences areexactas their results areuniversally true.However, statistical laws
5. 4
are not exact. For example, if average number of thefts in a town is 3 per week, it does not mean
that if 3 thefts have taken placeon the firstday of the week, there will beno more thefts in that
week.
(e) Statistical laws are not exact – As statistical laws areprobabilities in nature,interferences based on
them areonly approximateand not exact likeinterference based on mathematical or scientific laws.
(f) Only expertscan make the best possible use of statistics – The techniques of statisticsarenotso
simpleto be used by any layman.These techniques can only be used by the experts as they are
complicated in nature.
(g) Statistical data should be uniform and homogeneous – It is essential thatdata must be uniformand
homogeneous. Heterogeneous data arenot comparable.For example, it would be of no use to
compare the heights of trees with the heights of men because these data areof heterogeneous.
Assignment for Introduction of statistics
1. Define statisticsin plural sense.
2. What is meant by statistics in singularsense?
3. State two example of quantitativedata.
4. State two example of qualitativedata.
5. What is meant by statistical tools?
6. Why the problem of distrust of statistics arise?
7. Explain any three importanceof statistics.
Revision Exercise
1. Define statisticsin plural sense.
2. Briefly explain the meaning of statisticsin singular sense.
3. What is meant by distrustof statistics?
4. What is meant by statistical tools?
5. State two functions of statistics.
6. 5
Collection of Data
Introduction
Statistics has gained significantplacein themodern complex business world.Data is baseon which the
superstructureof statistical investigation ismade.The success and failureof investigation mainly depends upon
the quality,adequacy and accuracy of data.
Important are used in statisticsare –
A. Statistical Enquiry - It means a search conducted by statistical methods/ enquiry.
B. Investigator – The person who conducts the statistical enquiry is termed as investigator.
C. Enumerator – The investigator requires the help of certain persons to collectthe information,aretermed
as enumerator.
D. Respondents – The persons from whom information is collected arecalled respondents.
E. Survey – It is a method of gatheringinformation from individuals.The objective of the survey is to collect
data to describesome features likeprice, quality or usefulness.
Collection of Data – It is the firststep in any statistical investigation.
Sources of Data
Internal Sources of Data – In an organization, when data is collected from its reports and records, is known as
internal sources of data. For example – sales, salary, profit, dividend etc.
External Sources of Data – Information collected from outside agencies is called external data which can be
obtained from primary sources or secondary sources. This type of data can be collected by census or sample
methods.
Primary Data
Primary data is original and first hand information. The source from which the primary data is collected is called the
primary source. For example, population census conducted by Government of India.
Secondary Data
7. 6
The data which is not directly collected but rather obtained from the published or unpublished sources, is known as
secondary data. It is also known as second hand data. For example, Economic survey published by Government of
India.
Difference between Primary Data and Secondary Data
Basis Primary Data Secondary Data
Originality They are original becausethey are
collected by investigator himself.
They are not original sinceinvestigator makes use
of the collected by other agencies.
Source They are collected by some agency or
person by usingthe method of data
collection.
They are already collected and processed by some
person or agency and is ready for use.
Time Factor It requires longer time for data collection. It requires less time.
Cost Factor It requires a considerableamountof
money and personals as wholeplan of
investigation himself collectit.
It is cheaper as itis taken from published or
unpublished materials.
Reliability
and
Suitability
It is more reliableand suitableto the
enquiry as the investigator himself
collects it.
It is less reliableand less suitableas someone else
collected the data which may not serve the
purpose.
Precautions There is no great need for precautions
whileusingprimary data.
There should be used with great careand caution.
Organization
Factor
Collection of primary data requires
elaborateorganization setup.
There is no need for organizational setup in case
of secondary data.
Method of Collecting Data
A. Direct Personal Investigation
B. IndirectOral Investigation
C. Information from Local Sources or Correspondents
D. Information through Questionnaireand Schedules
Direct Personal Investigation
Data are collected by the investigator personally frompersons is called directpersonal investigation.Heinterviews
personally everyone who is in a position to supply information herequires.We can use this method of collection of
data when area of enquiry is limited or when a maximum degree of accuracy is needed. The success of this method
requires that the investigator should be very diligent,efficient, impartial and tolerant.
Suitability of this method
(a) When detailed information has to be collected.
(b) When area of investigation is limited.
(c) When nature of enquiry is confidential.
(d) When maximum degree of accuracy isneeded.
(e) When importanceis given to originality.
Merits of DirectPersonal Investigation
(a) The data collected is original in nature.
(b) Data is fairly accuratewhen personally collected.
(c) There is uniformity in collection of data.
(d) There is flexibility in theenquiry as the investigator is personally present.
(e) It is economical,in casethe field of investigation is limited.
8. 7
Demerits of DirectPersonal Investigation
(a) It can be used if the field of enquiry is small.Itcannotbe used when field of enquiry is wide.
(b) It is costly method and consume more time.
(c) Personal bias can givewrongresults.
(d) This method is lengthy and complex.
IndirectOral Investigation
It is thatmethod by which information is obtained not from the persons regardingwhom the information is
needed. It is collected orally fromother persons who areexpected to possess thenecessary information.
Suitability
(a) When concerned informants areunableto give information due to their ignoranceor they are not
prepared to partwith the information.
(b) When the area of investigation is very large.
(c) When secret or sensitiveinformation aboutthe information has to be gathered.
(d) When the problem of investigation is complex and need expert’s opinion.
Merits of IndirectOral Investigation
(a) It is suitablewhen the area of investigation is large.
(b) It is economical in terms of time, money and manpower.
(c) It is relatively freefrom personal biasas theinformation is collected fromthe persons who are well aware
of the situation.
Demerits of IndirectOral Investigation
(a) The resultcan be erroneous becauseinformation is obtained from other persons not directly connected.
(b) As compared with direct personal observation,the degree of accuracy of the data is likely to be lower.
(c) The persons,providingthe information,may be prejudiced or biased.
(d) The information collected from different persons may not be homogeneous and comparable.
Information from Local Sources or Correspondent
In this methods, local agents or correspondents areappointed and trained to collectthe information from the
different parts of the investigation area.These agents regularly supply theinformation to the central office.
This method is often adopted by newspapers and periodicalsfor information aboutpolitics,business,prices of
agricultural and industrial product,stock market, strikes etc.
Suitability of Information from Correspondent
(a) When regular and continuous information is required.
(b) When area of investigation is very large.
(c) When high degree of accuracy is notrequired.
Merits of Information from Correspondent
(a) It is comparatively cheap.
(b) It gives results easily and promptly.
(c) It covers a wide area under investigation.
Demerits of Information from Correspondent
9. 8
(a) In this method original data isnotobtained.
(b) It gives approximateand rough results.
(c) Different attitudes of different correspondents and agents may increaseerrors.
Information through Questionnaires and Schedules
Under this method, the investigator prepares a questionnairekeeping in view the objective of the enquiry. There
are two ways of collectinginformation on the basis of questionnaire -
(a) MailingMethod and (b) Enumerator’s method
MailingMethod
Under this method, the investigator makes a questionnairepertainingto the field of investigation and send it to
the respondents, alongwith a coveringletter, to collectinformation fromthem. It is also assured thatthe
information would be kept confidential.
Suitability of MailingMethod
(a) When the field of investigation is very large.
(b) When respondents are literate and likely to co-opearte with the investigation.
Merits of MailingMethod
(a) It is economical in terms of time, money and efforts involved.
(b) It is original and therefore, fairly reliable.This is becausethe information is duly supplied by the
concerned persons themselves.
(c) It allows widecoverage of the area of study.
Demerit of Mailing Method
(a) Informants do not take interest in questionnaireand fails to return the questionnaires.Thosewho return,
often send incomplete answers.
(b) It lacks flexibility.When questions are not properly replied, these cannotbe changed to obtain the
required information.
(c) If the respondents are biased,then the information will also bebiased.
Enumerator’s Method
Under this method, a questionnaireis prepared accordingto the purpose of enquiry. The enumerator himself
approaches the informantwith a questionnaire.The questionnaires which arefilled by the enumeratos
themselves by putting questions arecalled schedules.
Construction of Questionnaire or Schedule
A questionnaireor a scheduleis a listof questions relatingto the problem under investigation.
Quality of a Good Questionnaire
(1) Limited Number of Questions – The number of questions should beas small as possible.Long
questionnaires discouragepeople from completing them. Only those questions which have a direct
relevance to the problem be included.
(2) Simple and Short Questions – The questions should beclear,brief and simple.The question should be
framed in such a manner that their answers are specific and precise.
(3) Proper Order of the Questions – Questions must be placed in a proper order.
(4) No UndesirableQuestions –These type questions or personal questions mustbe avoided.
10. 9
(5) Non-controversial –Questions should be such as can be answered impartiality.
(6) Avoid Question requiringCalculation –The questions relatingto calculations which forcethe
respondent to recollectfrom his memory should not asked. For example, informants should not be
asked yearly income, sincein most of the cases they are paid monthly.
(7) Instructions to the Informants – The questionnaireshould providenecessary instruction aboutthe
terms and units in it. Clear and definite instructions for fillingin the questionnaireand address,where
completed questionnaireshould besent, must be given.
(8) Questionnaireshould look Attractive – a questionnaireshould be made to look as attractiveas
possible.The printingand the paper should be of good quality and enough spaceshould be provided
for answers.
(9) Request for return – Request should be made to the respondents to return the questionnaire
completed in all respects.
Specimen Questionnaire– Consumer
1. Name ___________________________________
2. Age _______________
3. Address _______________________________________
4. Sex □ Male □ Female
5. Phone: Landline________________ Mobile
_________________
6. Monthly Family Income:
□ Less than ₹10,000 □ ₹10,000 to ₹20,000
□ ₹20,000 to ₹30,000 □ More than ₹30,000
7. What kind of
Collection of Secondary Data
11. 10
Census and Sample Methods of Collection of Data
Census Method
When a statistical investigation isconducted wherein, the data is collected from each and every element of the
population or universe,is termed as census method. Generally the term population is used to mean total number
of people livingin a country.Population of India was 125 crorein 2015.But in statistics,the term population
means the aggregate of all items about which we want to obtain information.For example, there are1000
students in a particular school.If an investigation relates to all the 1000 students, then 1000 would be taken as
universeor population.Each of unit of these 1000 is called item.
Census method is also known as ‘Complete Enumeration’ or 100% Enumeration or Complete Survey.
Merits of Census Method
(h) Intensivestudy of population
(i) High degree of accuracy and reliability
(j) Study of diversecharacteristics
Demerits of Census Method
(h) Expensive
(i) Needs more time and manpower
(j) Not suitableto largeinvestigation
Sample Method
It is thatmethod in which data is collected aboutthe sampleon a group of items taken from the population for
examination and conclusionsaredrawn on their basis.
Merits of SampleMethod
(i) Economical – It is more economical than the census techniques as the task of collection and analysis
of data is confined only to a fraction of the population.
(ii) Time Saving
(iii) Identification of Error – Becauseonly a limited number of items are covered, errors can be easily
identified.To that extent samplingmethod shows better accuracy.
(iv) More Scientific –It is more scientific becausethe sampledata can be conveniently investigated from
various angles
(v) AdministrativeConvenience – In caseof sampling,scaleof operation remains atlow level. So,
planning,organization and supervision can beconveniently managed, which leads to administrative
convenience.
Demerits of Sample Method
(i) Partial –If the investigator is biased,then he might selectsampledeliberately.In such cases,selected
samplecannot be a representative of the characteristics of all thecharacteristicsof the population.
(ii) Wrong conclusion
(iii) Difficulty in selectingrepresentativesample
(iv) Difficulty in framingsample
Types of Sampling
12. 11
Random Sampling
Random samplingmethod refers to a method in which every item in the universehas a known chanceof being
chosen for the sample. It is also known as ‘Probability Sampling’.
(i) Lottery method
(ii) Table of Random Numbers
Merits of Random Sampling
(i) It is free from personal biasof the investigator.
(ii) Each and every items of the population stands equal chances of being selected.
(iii) The universegets fairly represented by the sample
Demerits of Random Sampling
(i) Unsuitablefor small sampling
(ii) Difficultto prepare samplingframe
(iii) Time consuming
Purposive Sampling
It is thatsamplingin which the investigator himself makes the choiceof the sampleitems whh in hopinion arethe
best representative of the universe.
Stratified or Mixed Sampling
In this method, the universe or the entire population is divided into a number of groups or strata and then certain
numbers of items are taken from each group at random.
Systematic Sampling
13. 12
Under this method, out of the complete listof availablepopulation,thesampleis selected by takingevery nth item
from this list.
Quota Sampling
In this method, the population is divided into different groups or classes accordingto different characteristicsof
the population.
Convenience Sampling
In this method, samplingis doneby the investigator in such a manner that suits his convenience.For example, to
estimate the average height of an Indian,the investigator can take a convenience samplefrom Delhi city only and
estimate the average height of an Indian.
Revision Exercise
Very Short Answer Type Questions
1. What do you by a statistical enquiry?
2. What aretwo main sources of data?
3. What is the meaning of primary data?
4. What do you mean by secondary data?
5. State merits of primary data.
6. Mention two demerits of primary data.
7. Expand NSSO.
8. What do you mean by enumerator?
Short Answer Type Questions
1. What do you mean by secondary data? Mention its sources.
2.
14. 13
Organization of Data
What is Classification?
The quantitativeinformation collected in any field of society or scienceis never uniform. They always differ from
one to another e.g., prices of vegetables, students in different sections,income of families.Heightor weight of a
person etc.
The process of groupinginto different classes or sub-classes accordingto characteristicsis termed as classification.
In the words of Conner, “ Classification is theprocess of arrangingthings in groups or classesaccordingto their
resembles and affinities and gives expression to the unity of attributes that may exist amongst a diversity of
individuals”.
Attributes – The characteristics which arenotcapableof being measured quantitatively arecalled
attributes. For example, blindness,literaterate, beauty, intelligenceetc.
Basis of Classification
Geographical – when the data is classified according to geographical location o region, is called geographical
classification. When population of different states is presented.
States Uttar Pradesh Maharashtra Bihar Madhya Pradesh Andhra Pradesh Rajasthan
population 20 crore 12 crore 10 crore 8 crore 7.8 crore 7.5 crore
Chronological –When data is classified with respect to different periods of time, the type of classification is known
as chronological classification.
Qualitative – When data is classified on the basis of descriptive characteristics or on the basis of attributes like
gender, literacy, region, caste, etc. which cannot be quantified.
Quantitative– Data is classified on the basis of some characteristicswhich can bemeasured such as height, weight,
income, expenditure, production or sale.
Concept of Variable
A characteristicwhich is capableof beingmeasured and changes its valueovertime is called a variable. Asingleitem
out of all the observations of groups as numerical may be called variateor variable.Examples – priceis a variableas
prices of different commodities are different.
There are two types of variable –
15. 14
(a) Continuous Variable– These variables which can takeall the possiblevalues (integral as well as fractional)
in a given specified range are termed as continuous variables.
Weight (kg) 30-35 35-40 40-45 45-50 50-55 55-60
No. of Students 22 12 8 5 6 3
(b) Discrete Variable–Variables which arecapableof takingonly exact valueand not any fractional valueare
termed as discrete variables.
No. of children 0 1 2 3
No. of families 5 8 9 13
Frequency
Frequency refers to number of times a given value appears in a distribution. For example, suppose there are 30
students in a class and out of them –
15 students have got 70 marks
12 students have got 88 marks
3 students have got 95 marks
Class Frequency – The number of times an item repeats itself corresponding to a range of value (class interval) is
termed class frequency. For example, if there are 5 students securingmarks between 70-80, then 5 is the frequency
corresponding to the class interval 70-80. Thus, 5 will be called frequency.
Tally Bars – Every time an item occurs, a tally bar, (I) is marked against that item.
Raw Data
A mass of data in its crude form is called raw data. It is an unorganized mass of the various items.
Series – Raw data are classified in the form of series.Series refers to those data which are presented in some order
and sequence. Arrangingof data in differentclasses accordingto a given order is called series.In simplewords,series
is arranged in some logical order.
Types of series
Individual Series
16. 15
Individual seriesrefers to that series in which items are listed single,i.e.each item is given a separatevalueof
measurement. It is presented in two ways –
Ascending Order Descending Order
When data is arranged systematically fromthe lowest
valueto the highestvalue, then such arrangement is in
the ascendingorder. For example, - 70, 72, 87, 95 and
98.
When data is arranged systematically fromthe highest
valueto the lowest value,then such arrangement is in
the descending order. For example,- 98, 95, 87, 72 &
70.
Discrete Series or Frequency Array
A discreteis that series in which data arepresented in a way that exact measurements of items are clearly shown.
In this series,there is no classintervals.
Illustration –
10 students of Class Xi havesecured the followingmarks –
45, 50, 88, 98,88, 45, 45, 85, 65 and 65.
Table – Discrete Series
Marks Tally Bars Frequency
45
50
65
85
88
98
III
I
II
I
II
I
3
2
1
1
2
1
Total 10
Frequency Distribution
A table in which the frequencies and the associated values of a variable are written side by side, is known as
frequency distribution.
Some Important Terms
Class – It means a group of numbers in which items are placed such as 10-20,20-30,etc.
Class Limit – The lowest and highestvalues of the variables within a classis called classlimit.
Class-Interval – The difference between the lower limit(l1) and upper limit(l2) is known as class -interval.
i= l1 – l2
Range – The range of a frequency distribution can bedefined as the difference between the lower limitof first
class-interval and upper limitof the lastclass-interval.
Mid-point – It is the central pointof a class-interval.
Mid-point= l1+l2/2
Class Frequency – The number of observations correspondingto a particular classis known as classfrequency or
the frequency of that class.Itis denoted generally by f. The sum of frequencies is denoted as ∑f or N.
Types of Frequency Distribution
17. 16
A. ExclusiveSeries
B. InclusiveSeries
C. Open End
D. CumulativeFrequency
E. Mid-Value
Exclusive Series – It is that series in which every class interval excludes items correspondingto its upper limit.
Classes Frequency
10-20
20-30
30-40
40-50
6
5
9
10
Total 30
Inclusive Series – It is thatseries which includes all items upto its upper limit.
Classes Frequency
10-19
20-29
30-39
40-49
6
5
9
10
Total 30
Difference between Exclusive Method and Inclusive Method
S.N. ExclusiveMethod InclusiveMethod
1. The upper limitof a class interval iscounted in
the next immediate class.
Both the limits of a class interval iscounted in the
same class.
2. The upper limitof a class interval and lower
limitof next class arethe same.
The upper limitof a class interval and lower limitof
next classaredifferent.
3. There is no need of converting it to inclusive
method prior to calculation.
For simplicity in calculation,itis necessary to change
it into exclusivemethod.
Open End distribution – When the lower limitof the firstclassand the upper limitof lastclassis notgiven,is
known as open end distribution.
Classes Frequency
Below 20
20-40
40-60
60-80
80 and above
15
12
8
5
5
Total 45
Cumulative Frequency Series – It is thatin which the frequencies are continuously added correspondingto each
class interval in theseries.
Classes CumulativeFrequencies
5-10
15-20
20-25
25-30
5
9
15
20
Mid-Value Frequency Series – It is the middle valueof a class interval.When such mid values aregiven
18. 17
, is called mid valueseries.
Mid-value Frequency
15
25
35
45
5
6
4
5
Total 20
Assignment for Organization of Data
1. What is classification?
2.
Presentation of Data – Textual and Tabular Presentation
Textual Presentation
A textual presentation is a descriptiveform of presentation of data written in text or paragraph.Itis also called
descriptivepresentation of data.
Tabular Presentation
It is a systematic presentation of numerical data in columns and rows in accordancewith some important features
or characteristics.
Component of a Table
(i) Table Number – A tableshould always benumbered for identification and reference in the future. A
table must be numbered 1, 2, 3 etc.
(ii) Title – There must be a title on the top of the table. The title must be appealingand attractive.
19. 18
(iii) Stubs – These aretitles of the rows of a table. These titles indicateinformation contained in the row
of the table.
(iv) Caption – It is the title given to the columns of a table.
(v) Body of the Table– This is the most important part of the table as itcontains data.
(vi) Source – A sourcenote refers to the source from which information has been taken.
(vii) Footnote – It is the lastpartof the table. Footnote explains the specific featureof the data content of
the table which is not self-explanatory and has notbeen explained earlier.
ILLUSTRATION
Table – 1 Coffee DrinkingHabits in Town X and Y
Kinds of Table
A. Accordingto Purpose
20. 19
B. Accordingto Originality
C. Accordingto Construction
Accordingto Purpose– There are two types of table –
(i) General Purpose Table – This is also called as reference or repository table. It provides information
about general useof tablefor example, census of India.
(ii) Special Purpose Table – It is called text, summary or analytical tables.Such tables aresmall in sizeand
designed to highlighta particularsetof facts in a simpleand analytical form.
Accordingto Originality –there arealso two types of table–
(i) Original Table– An original tableis thatin which data arepresented in the same form and manner in
which they are collected.
(ii) Derived Table – Itprovides total, ratio,percentage and other statistical calculations.Such tables can
be derived from general purposetables.
Accordingto Construction – There are two types of table–
(i) Simple or One Way Table – It is the simplesttablewhich shows only one characteristicsand takes the
form of frequency table, for example,
Marks No. of Students
0-20
20-40
40-60
5
25
20
Total 50
(ii) Complex Table – A table which presents data accordingto two or more characteristicsis known as
complex table.
Classification of Data and Tabular Presentation
Tabular presentation is based on four fold classification of data –
(i) QualitativeClassification of Data and Tabular Presentation – Itoccurs when data are classified on the
basis of qualitativeattributes.
21. 20
(ii) QuantitativeClassification of Data and Tabular Presentation – It occurs when data areclassified on
the basis of quantitativecharacteristicsof a phenomenon.
(iii) Temporal Classification of Data and Tabular Presentation – Data are classified accordingto time and
time becomes the classifyingvariable.
(iv) Spatial Classification –In spatial classification,placebecomes the classifyingvariable.
Assignment for Presentation of Data
1. What do you mean by presentation of data?
2. What is meant by table?
3. Define tabulation.
4. What arethe main forms of a table?
22. 21
5. What arethe requisites of a good table?
6. What arethe main forms of table?
7. Write three essentials of a satisfactory table?
8. What areparts to be present in a table? Write any three.
Measures of Central Tendency – Arithmetic Mean
What is a central Tendency?
The singlevaluethat reads the characteristicsof the complex and varied mass of data is called averageor central
value. The valuealways fallsbetween the lowest and highestvalues of the data. It is generally located in the centre
or middleof the observations.An average is a figure that represents the whole group is called a measureof central
tendency or measure of location.
Accordingto clark,“An average is a figure that represents the whole group.”
Objective and Function of Average
(i) To present huge data in summarized form
(ii) To make comparison easier
(iii) To help in decision making
(iv) To know about universe from a sample
(v) To trace precise relationship
(vi) Base for computing other measures
Characteristics of a Representative Average
(i) It should be simple to calculate and easy to understand.
(ii) It should be rigidly defined.
(iii) It should be based on all the observations.
(iv) It should be least affected by fluctuations of sample.
(v) It should be capable of further algebraic treatment.
(vi) It should not be affected much by extreme values of data.
Types of Statistical Averages
Arithmetic Mean (Mean)
23. 22
Mean is the number obtained by dividingthetotal values of different items by their number. In other words, mean
is defined as the sum of the values of all observationsdivided by the number of observations.Itis generally
denoted by . It can be computed in two ways –
A. Simple Arithmetic Mean
B. Weighted Arithmetic Mean
Methods of CalculatingSimpleArithmetic Mean
We know, there are three types of statistical series –
1. Individual Series
2. Discrete Series
3. Frequency distribution
Calculation of Mean in Case of Individual Series
There are three methods to calculatemean of individual series –
(i) Direct Method – Accordingto this method, all the units are added and then their total is divided by
the number of items and the quotient become the mean.
Steps of DirectMethod
1. Let the items be X1, X2, ………. Xn.
2. Add up the values of all the items and obtain the total i.e, ∑X.
3. Find out total number of items in the series,i.e., N.
4. Dividetotal number of items ∑X by total number of N.
=
∑𝑋
𝑁
(ii) Short-Cut Method – This method is also called assumed mean method.
= 𝐴 +
∑𝑑
𝑛
(iii) Step Deviation Method – Step deviation method further simplified the shortcut method. In this
method, deviations from assumed mean are divided by a common factor (h) to get step deviations.
= 𝐴 +
∑𝑑′
𝑁
𝑋ℎ
Illustration
Calculatearithmetic mean from the followingdata – 30, 45, 60, 15, 65, 85,20.
Ans. Computation of Average marks
Direct Method Short-Cut Method Step Deviation Method
Marks (X) Marks (X) D = X – A (A=40) Marks (X) d=X –A d’=X-A/h
30
45
60
40
15
65
85
20
30
45
60
40
15
65
85
20
-10
5
20
0
-25
25
45
-20
30
45
60
40
15
65
85
20
-10
5
20
0
-25
25
45
-20
-2
1
4
0
-5
5
9
-4
∑ X = 360 N=8 ∑d= 40 N = 8 ∑d’=8
24. 23
=
∑𝑋
𝑁
= 360/ 8 = 45
𝐴 +
∑𝑑
𝑁
= 40 + 40/8
= 45 = A
+
∑𝑑′
𝑁
𝑋 ℎ
= 40 + 40/8 = 45
Discrete Frequency Series
In caseof discrete, values of variableshows the repetitions, i.e, frequencies aregiven correspondingto
different valus of variable.Mean in a discreteseries can be computed by applying –
(i) Direct Method – In this method, various items (x) are multiplied with their respective frequencies
(f) and the sum of products (∑fX) is divided by total of frequencies ∑f to determine mean.
=
∑𝑓𝑥
∑𝑓
(ii) Short-Cut Method – This method saves considerabletime in calculatingmean.
1. Denote the variableas X and frequency as f.
2. Decide any item of the series as assumed mean (A).
3. Calculatethe deviations (d) of the items from the assumed mean.
4. Multiply the deviations (d) with the respective frequency (f) and obtain the total to get ∑fd.
= 𝐴 +
∑𝑓𝑑
∑𝑓
(iii) Step Deviation Method – In this method, the values of the deviations (d) aredivided by common
factor (h).
= 𝐴 +
∑𝑓𝑑′
∑𝑓
Xh
Illustration
Calculate meanfromthe followingseries –
Size 8 10 12 14 16 18 20
Frequency 6 12 15 28 20 14 5
Ans.Computationof MeaninDiscrete FrequencySeries
DirectMethod Short-CutMethod (A=14) StepDeviationMethod
X f fd x f D= x-A fd x f d d’ Fd’
8
10
12
14
16
18
20
6
12
15
28
20
14
5
48
120
180
392
320
252
100
8
10
12
14
16
18
20
6
12
15
28
20
14
5
-6
-4∑-2
0
2
4
6
-36
-48
-30
0
40
56
30
8
10
12
14
16
18
20
6
12
15
28
20
14
5
-6
-4
-2
0
2
4
6
-3
-2
-1
0
1
2
3
-18
-24
-15
0
20
28
15
100 1412
=
1412
100
= 14.12
100
= A+
∑𝑓𝑑
𝑁
=14 +
12
100
= 14.12
12 100
= A +
∑𝑓𝑑’
𝑁
× ℎ
= 14+
6
100
×
2 = 14.12
6
=
14.12
6
Calculationof MeaninCase of FrequencyDistribution
In thisseries,the methodof calculationof meanisthe same as inthe case of discrete series.The only
difference isthatinfrequencyseriesmid-pointof variousclassintervalsare required tobe obtained.
26. 25
Calculationof CorrectedArithmeticMean
=∑𝑋( 𝑤𝑟𝑜𝑛𝑔) + ( 𝑐𝑜𝑟𝑟𝑒𝑐𝑡 𝑉𝑎𝑙𝑢𝑒) −(IncorrectValue)/N
Illustration
Mean marksobtainedby50 studentsare estimatedtobe 40. Later on it isfoundthat one value was
readas 63 insteadof 36. Findout the correctedmean.
Ans. = 2000+ 36 – 63/50
= 1973 = 39.46
WeightedArithmeticMean
Weightedmeanreferstothe average whendifferentitemsof aseriesare givendifferentweights
accordingto theirrelative importance.
=
∑𝑤𝑥
∑𝑤
Illustration
Calculate the weightedmeanof the followingdata–
Items 10 15 20 25 30 35
weight 6 9 4 10 5 2
Ans.Calculationof WeightedMean
Items(X) Weight(w) wx
10
15
20
25
30
35
6
9
4
10
5
2
60
135
80
250
150
70
∑w=36 ∑wx=745
=
∑𝑤𝑥
∑𝑤
= 745/36
= 20.69
CombinedMean
=
𝑁1 1+ 𝑁2 2
𝑁1+𝑁2
Meritsof ArithmeticMean
Arithmeticmeanisthe mostpopularlyusedbecauseof the followingmerits-
27. 26
i. It issimple tounderstandandeasyto calculate.
ii. It isbasedon all the observationsof the series.Therefore,itisthe mostrepresentative
measure.
iii. Its valuesisalwaysdefinite.Itisrigidlydefinedandnotaffectedbypersonal bias.
iv. It doesnotrequire anyspecificarrangementof data.
v. It iscapable of furtheralgebraictreatmentandwe can use it forfuture mathematical
calculationinstatistics.
vi. It isleastaffectedbyfluctuationsof samplingandensuresstabilityincalculation.
vii. It isgood base for comparison.
viii. It iscalculatedvalue andnota positionvalue like medianandmode.
Demeritsof ArithmeticMean
i. It sometimesgivesmostabsurdresultswhichcannotpossiblyexiste.g.,average childrenin
a family3.2 or 2.2. a childcannot be dividedinfractions.Itisnotan actual iteminthe series
and itis calledafictionaverage.
ii. It isaffectedbyextreme itemse.g.,aGeneral manager’ssalaryinafirmis ₹ 1,35,000 as
comparedto otheremployeessayclerk₹10,000 and peon₹5,000. The average salaryof the
firmis₹50,000. Average calculationisnotarepresentative figure.Itisaffectedbyan
extreme value of ₹1,35,000 paidto the General Manager.
iii. It cannot be calculatedinthe absence of one of the items.Inopenenddistribution
arithmeticmeanisbasedonassumptionsof the classinterval.
iv. It can be a value thatdoesnot existinthe seriesatall e.g.,4,8 and 9 is 7.
v. It givesmore importance tothe biggeritemsandlessimportance tothe small itemsof the
series.
vi. It cannot be decidedjustbyobservation.Itneedsmathematical calculations.
Measures of Central Tendency – Median, Mode
In a statistical series, there issometime avalue whichiscentrallylocatedorwhichoccursmost
frequentlyinthe series,iscalledcentral value of the series.
Median
Medianmay be definedasthe middle value inthe datasetwhenitselementsare arrangedina
sequentialorder,i.e.,ineitherascendingordescendingorderof magnitude.Itsvalue issolocatedina
distributionthatitdividesinhalf,with50% itemsbelow itand50% above it.
It concentratesonthe middle orcentre of a distribution.
It that positional valueof the variable whichdividesthe distributionintotwoequal parts.
Computation
28. 27
Mediancan be calculatedinthe followingtypesof distributions–
A. Individual Series –To calculate medianinanindividual series,the followingstepsare needed –
(i) Arrange the data in ascendingordescendingorder.
(ii) Applythe formula– Median(M) = Size of [𝑁 + 1/2]𝑡ℎ item
Example – Findoutmedianfromthe followingdata –
151, 140, 149, 142, 147, 144, 145
Ans.Arrange inascending – 140, 142, 144, 145, 147, 149, 151
M= Size of [
𝑁+1
2
]thitem
M= 7+1/2 = 4
Hence,medianis145.
B. Discrete Series –In a discrete series,the value of the variable are givenalongwiththeir
frequencies. Stepsare tobe
(i) Arrange the data in ascendingordescendingorder.
(ii) Denote the variablesasXand frequencyasf.
(iii) Calculate cumulativefrequency(cf)
(iv) Findthe medianitemas:M = Size of [N+1/2]th item
Example – Calculate medianfromthe followingseries –
Marks 10 20 30 40 50 60 70 80
No.of students 2 8 16 26 20 16 7 4
Ans.
Marks No.of Students cf
10
20
30
40
50
60
70
80
2
8
16
26
20
16
7
4
2
10
26
52
72
88
55
9
Total 99
M= N+1/2 = 99+1/2
= 100/2 = 50
Median= 40.
29. 28
C. FrequencyDistribution(ContinuousSeries) –Incase of frequencyseries,mediancannotbe
locatedstraight-forward.Inthiscase,medianliesinbetweenlowerandupperlimitof class
interval.
Steps –
a. Arrange the data in ascendingordescendingorder.
b. Calculate the cumulative frequencies
c. Findthe medianitemasM = size of [N/2]th
item
d. By inspectingcumulativefrequencies,findoutcf whichiseitherequal toorjust greaterthan
this.
e. Findthe classcorrespondingtocf = N/2 or justgreaterthanthis.Thisclass iscalledmedian
class.
𝑀 = 𝑙1 +
𝑁
2
− 𝑐𝑓
𝑓
× ℎ
Illustration
From the followingfigures,findoutmedian:
Marks No.of Students Marks No.of Students
10-20
20-30
30-40
40-50
15
27
35
52
50-60
60-70
70-80
80-90
49
17
3
1
Ans.Computationof median
Marks No.of students Cumulative Frequency
10-20
20-30
30-40
40-50
50-60
60-70
70-80
80-90
15
21
35
52
49
17
3
1
15
36
71 Cf
123 MedianClass
172
189
192
193
Total N = ∑f=193
M y= N/2 = 193/2 = 96.5th
item
96.5th
itemliesinthe group40-50
L1=40, cf = 71, f=52, h = 10
By applyingformula
𝑀 = 𝑙1 +
𝑁
2
− 𝑐𝑓
𝑓
× ℎ
= 40 +
96.5−71
52
× 10 = 44.90
30. 29
Meritsof Median
(i) It iseasyto calculate and understand.
(ii) It iswell definedasanideal average shouldbe anditindicatesthe value of the middleitem
inthe distribution.
(iii) It can be determinedgraphically,meancannotbe graphicallydetermined.
(iv) It isproperaverage for qualitativedatawhere itemsare notconvertedormeasuredbutare
scored.
(v) It isnot affectedbyextreme value.
Demeritsof Median
(i) For mediandataneedtobe arrangedinascendingordescendingorder.
(ii) It isnot basedon all the observationsof the series.
(iii) It cannot be givenfurtheralgebraictreatment.
(iv) It isaffectedbyfluctuationsof sampling.
(v) It isnot accurate whenthe data isnot large.
Quartiles(PartitionValues)
Whenwe 1are requiredtodivide aseriesintomore thantwoparts, the dividingplacesare knownas
partitionvalues.Suppose we have apiece of cloth100 metres longandwe have to cut it into4 equal
pieces,we will have tocutitat three places.
Quartilesare those valueswhichdividesthe seriesintofourequal parts.
Calculationof Quartiles
individualSeries Discrete Series FrequencyDistribution
Steps
Arrange the data in ascending
order.
Locate the itembyfindingout
(N+1/4)th
and3(N+1/4)th
items.
Arrangementof datain
ascendingorderisnecessary.
Calculate lessthancumulative
frequencies.
Locate the items(N+1/4)th
and
3(N+1/4)th
items.
Calculate lessthancumulative
frequencies.
Locate the firstquartile and
thirdquartile groupby
cumulative frequencycolumn
where the size of respective
(N/4)th
and3(N/4)th
items.
𝑄1 = 𝑙1 +
𝑁
4
− 𝑐𝑓
𝑓
× ℎ
Q3 = 𝑙1 +
3( 𝑁+1)−𝑐𝑓
𝑓
× ℎ
Mode
Mode isanotherimportant measure of central tendency,whichisconceptuallyveryuseful.Mode isthe
value occurringmostfrequentlyinasetof observationandaroundwhichotheritemsof the setscluster
mostdensely.
M = 44.90
31. 30
Mode = 3 Median – 2 Mean
Z = l1 +
𝑓1– 𝑓0
2𝑓1−𝑓0−𝑓2
× ℎ
AssignmentsforMeasuresof Central Tendency
1. Define median.
2. Whenis an average knownaspositional average?
3. Mentionanytwo meritsof median.
4. Whichgraph is usedtolocate mediangraphically.
5. Whichaverage dividesthe seriesintotwoequal parts?
6. Define mode.
7. Give twomeritsof mode.
8. State one meritof mode.
9. Showthe empirical relationshipbetweenmean,medianandmode.
10. Discussmeritsanddemeritsof median.
11. Discussthe stepsinvolvedforcalculatingmode bygroupingmethod.
Measuresof Dispersion
Average like mean,medianandmode condensethe seriesintoasingle figure.These measuresof central
tendenciesindicatethe central tendencyof afrequencydistributioninthe formof anaverage.These
averagestell ussomethingaboutgeneral level of magnitude of the distribution,buttheyfail toshow
anythingfurtheraboutthe distribution.Measurescentral tendencyare sometimesnotfully
representative of the data.
Dispersionisthe extenttowhichvaluesinadistributiondifferfromthe average of the distribution.It
indicateslackof uniformityinthe size of items.
Accordingto Conor,“Dispersionisameasure of the extenttowhichthe individual itemsvary”.
Objective of Measure of Dispersion
(i) To test the Reliability of an Average –
(ii) To serve asBasis forControlof Variability –
(iii) To makeComparativestudy of two ormoreseries –
(iv) To serve asa Basis forfurtherStatistical Analysis –
Methodsof Measureof Dispersion
A. Dispersion fromSpread of Values – (a) Range(b) InterquartileRangeand QuartileDeviation
B. Dispersion fromAverage – (a) Mean Deviation or Median Deviation (b) Standard Deviation
C. Graphic Method – LorenzCurve
Range
Range is the simplest measureof dispersion.Itisthe difference betweenthe largestandthe
smallestvalue inthe distribution.
R = L – S
32. 31
Relative Range
Coefficientof Range =
𝐿 – 𝑆
𝐿+𝑆
Meritsof Range
(i) It issimple tocalculate andeasyto understandthe measure of dispersion.
(ii) It givesbroadpicturesof the data quickly.
(iii) It isrigidlydefined.
(iv) It dependsonunitof measurementof the variable.
Demeritsof Range
(i) It isnot basedon all the observationof series.
(ii) It isverymuch affectedbyextreme items.
(iii) It isinfluencedverymuchby fluctuationsof sample.
(iv) It cannot calculatedincase of openendseries.
(v) It doesnottell anythingaboutthe distributionof itemsinthe seriesrelative toameasure of
central tendency.
Interquartile Range andQuartile Deviation
Range is a crude measure because ittakesintoaccountonlytwo extreme valuesi.e.,the largestandthe
smallest.The effectof extreme valuesonrange canbe avoidedif we use the measure of interquartile
range.Interquartile range referstothe difference betweenthe valuesof twoquartiles.
𝐼𝑛𝑡𝑒𝑟𝑞𝑢𝑎𝑟𝑡𝑖𝑙𝑒 𝑅𝑎𝑛𝑔𝑒 = 𝑄3 − 𝑄1
Quartile Deviation(Semi-Interquartile Deviation)
It isknownas the half of difference of upperquartile(Q3) andthe lowerquartile(Q1).Itishalf of the
inter-quartile range.
𝑄𝐷 =
𝑄3 – 𝑄1
2
Coefficientof Quartile Deviation(CQD)
Quartile deviationisanabsolute measure of dispersion.Forcomparative studiesof variabilityof two
distributions,we make use of relativemeasure,knownasCQD.
CQD =
𝑄3– 𝑄1
𝑄3+𝑄1
Meritsof Quartile Deviation
(i) It isquite easyto understandandcalculate.
(ii) It isonlymeasure of dispersionwhichcanbe usedto deal witha distributionhavingopen-
endclasses.
(iii) In comparison torange,it islessaffectedbyextremevalues.
Demeritsof Quartile Deviation
33. 32
(i) It isnot basedon all the observationsasitignoresthe first25% andthe last25% of the
items.Thus,itcannot be regardedasa reliable measure of variability.
(ii) It isnot capable of furtheralgebraictreatment.Itisin a way a positional average anddoes
not studyvariationof the valuesof a variable fromanyaverage.
(iii) It isconsiderablyaffectedbyfluctuationsinthe sample.A change inthe value of a single
item,inmanycases,affectitsvalue considerably.
Mean Deviation
Mean deviation of aseriesisthe arithmeticaverage of the deviationof variousitemsfromameasure of
central tendency(mean,medianormode).Meandeviationisalsoknownas‘firstmomentof
dispersion’.
Mean deviationisbasedonall the items of the series.
Theoretically,meandeviationcanbe calculatedbytakingdeviationsfromanyof the three
averages.Butinactual practices,meandeviationiscalculatedeitherfrommeanorfrom
median.
While calculatingdeviationsfromthe selectedaverage,the signs(+0r -) of the deviationsare
ignoredandthe deviationsare takenaspositive.
Coefficientof MeanDeviation(CMD)requencies
Mean deviationisanabsolute measure of dispersion.Inordertotransformitintoa relative measure,it
isdividedbythe average,fromwhichithasbeencalculated.Itisthenknownas the coefficientof Mean
Deviation.
CMD =
𝑀𝐷
CMD fromMedian=
𝑀𝐷𝑀
𝑀
Calculationof MeanDeviationandits Coefficient
Individual Series Discrete Series ContinuousSeries
Steps–
a. Calculate the specific
average (meanor
median) fromwhich
meandeviationistobe
calculated.
b. Obtainabsolute
deviation|d|of each
observationfromthe
specificaverage.
c. Absolute deviationsare
totaledupto findout
∑|d|
d. Applythe formula–
Steps –
a. Calculate specific
average fromwhich
meandeviationistobe
found.
b. Obtainthe absolute
deviations|d|of each
observationfromthe
specificaverage.
c. Multiplyabsolute
deviation|d|with
respective frequencies
(f) andobtainthe sum
productto get
∑𝑓|𝑑|
𝑁
Steps–
a. Calculate meanby
assumedmeanmethod.
b. Take deviationsof mid-
pointsfrommeanand
denote |d|.
c. Multiplythese
deviationsbyrespective
frequenciesand find
out f|d|.
d. M.D. =
∑𝑓|𝑑|
𝑁
34. 33
e. MD frommean=
∑|d|/N
OR
MD from= ∑|d|/N
Where |d|= |X - M|
d. MD frommean=
∑f|d|/N
1. Calculate meandeviationfrommeanandmedianfromthe followingseries –
X 12 10 15 19 21 16 18 9 25 11 156
|d|mean 3.6 5.6 0.6 3.4 5.4 0.4 2.4 6.6 9.4 4.6 42
|d|median 6.5 5.5 5.5 3.5 0.5 0.5 2.5 3.5 5.5 9.5 43
Mean deviationfrommean
Mean =
∑𝑋
𝑁
=
156
10
= 15.6
Applyingformula,we get
MD =
∑|𝑑|
𝑁
=
42
10
= 4.2
𝐶𝑀𝐷 =
𝑀𝐷
𝑀𝑒𝑎𝑛
=
4.2
15.6
= 0.269
Mean deviationfrommedian
M = size of
(𝑁+1)
2
item
=
10+1
2
= 5.5
= 15.5
MD =
∑|𝑑|
𝑁
=
43
10
= 4.3
CMD =
𝑀𝐷
𝑀𝑒𝑑𝑖𝑎𝑛
=
4.3
10
= 0.277
StandardDeviation
The concept of standarddeviationwasintroducedbyKarl Pearsonin1893. It ismostcommonlyused
measure of dispersion.Itsatisfiesmostof the propertieslaiddownforanideal measure of dispersion.
Standarddeviationisthe square rootof the arithmeticaverage of the squaresof the deviations
measuredfrommean.
Standarddeviationisalsoknownasroot meandeviationbecause itisthe square rootof the mean of
squareddeviationsfromthe arithmeticmean.
𝜎 = √
∑(𝑋 −
𝑁
Where x = 𝑋 −
σ = √∑x2
/N
Calculationof Standard Deviation
Individual Series Discrete Series ContinuousSeries
A Actual Mean Method
Steps–
Actual Mean Method
Steps –
StepDeviationMethod
Steps–
35. 34
i. Calculate the actual
meanof the
observations.
ii. Obtaindeviationof
the valuesfromthe
meani.e.,calculate
𝑋 − . Denote
these deviationsby
x.
iii. Square the
deviationsand
obtainthe total ∑x2
.
iv. σ = √∑x2
/N
i. calculate actual
mean ( ) of the
seriesas =
∑𝑓𝑥
𝑁
ii. findoutdeviations
of the itemsfrom
the actual mean( X
- )
iii. square the
deviationand
multiplythemby
theirrespective
frequencies(f) and
obtainthe total i.e.,
∑fx2
σ =
i. take any mid-point
(m) inthe seriesas
assumedmean(A)
ii. findoutdeviations
(d) of the mid-point
fromthe assumed
mean
iii. divide these
deviationsby
commonfactor (h)
to obtainstep
deviation(d’)
iv. multiplystep
deviationsby
respective
frequenciesand
obtainthe total i.e.,
∑fd’
v. calculate the square
of the step
deviationsi.e.,d’2
vi. multiplythese
squaredstep
deviationsbythe
respective
frequenciesand
obtainthe total to
get∑fd’2
σ =
Mean deviation StandardDeviation
Absolute Measure
Individual Observation/
MD = ∑|X – X |/N
Discrete andContinuousseries
MD = ∑f|d|N
Absolute Measure
Individual Series
σ = √∑𝑥2/N
x = X – X
DirectMethod
36. 35
Calculate StandardDeviationof the followingdata
25, 50, 45, 30, 42, 36, 48, 34, 60
X x=X-X X2
d = X –
A
d2
25 -19 361 -20 400
50 6 36 5 25
45 1 1 0 0
30 -6 36 -15 225
42 -2 4 -3 9
36 -8 64 -9 81
48 4 16 3 9
34 -10 100 -11 121
60 16 256 15 225
440 1710 -10 1720
= ∑X/N
= 440/10 = 44 = √1720/10 – (-10/10)2
σ = √∑x2
/N ∑ = √171
= √1710/10 = 13.076
= √171
= 13.076
OtherMeasure from StandardDeviation
Variousmeasuresare calculatedfromstandarddeviation.Someof the importantmeasuresare asunder
(a) Coefficientof StandardDeviation –A relative measure of standarddeviationiscalculatedto
compare the variabilityintwoormore than two serieswhichiscalled‘Coefficientof standard
Deviation’.Thisrelativemeasurementiscalculatedbydividingstandarddeviationbyarithmetic
meanof the data.
37. 36
CSD = SD/
(b) Coefficientof Variation –Thisrelative measurementisdevelopedbyKarl Pearsonandismost
popularlyusedtomeasure relative variationof twoormore thantwo series.Itshowsthe
relationshipbetweenstandarddeviationandarithmeticmeanexpressedintermsof
percentage.Thismeasure isusedto compare uniformity,consistencyandvariabilityintwo
differentseries. 𝐶. 𝑉. =
𝜎
⨱
X100
(c) Variance – Variance isthe square of standarddeviation.Standarddeviationandvariance are
measuresof variabilityandtheyare closelyrelated.The only difference betweenthe two
measurementsisthatthe variance isthe average squareddeviationfrommeanandstandard
deviationisthe square rootof variance.
Variance = σ2
StandardDeviation=√Variance
Mathematical Propertiesof StandardDeviation
1. The Sum of the Square of the DeviationsfromArithmeticMeanisthe Least,i.e.,lessthan
the sum of the squaresof the deviationsof the observationstakenfromanyothervalue.
∑(X - )2
˂ ∑(X – A)2
∑(X – M)˃∑(X - )
2. StandarddeviationandNormal Curve –In a normal or symmetrical distributionapartfrom
mean,medianandmode are identical,alarge proportionof distributionsare concentrated
aroundmean.Followingare arelationship –
Mean ± 1 σ covers68.27% of the total items.
Mean ± 2 σ covers95.45% of the total items.
Mean ± 3 σ covers99.73% of the total items.
Absolute Measure
Absolute measure ismeasuredinthe same unitsasthe data.For instance,if the original dataare in
rupees,the absolute measure isalsobe inrupees,if the dataare inkg,the measure will be inkgetc.For
thisreasonabsolute dispersioncannotbe usedtocompare the scatteror variabilityinserieswhere units
of measure are differentorwhenaveragesof one distributionthanthatinotherdistributionsdifferin
size.
Relative Measure
For comparingtwoor more serieswhere unitsof measure are differentrelative measuresare used
because theyare calculatedasthe percentage orthe coefficientof the absolute measure of dispersion.
Graphic Method(LorenzCurve)
The graphic methodof studyingdispersionisknownasthe LorenzCurve Method.ItisnamedafterDr.
Max O. Lorenzwhousedit forthe firsttime tomeasure the distributionof wealthandincome.Nowitis
alsousedfor the studyof the distributionof profits,wages,turnoveretc.Inthismethodof valuesthe
frequenciesare cumulatedandtheirpercentageare calculated.Thesevaluesare plottedonthe graph
and the curve thus obtainediscalledLorenzCurve.
Steps–
38. 37
(i) The size of itemsare made cumulative.Consideringlastcumulativetotal asequal to100
difference cumulative total are convertedintopercentages.
(ii) In the same way frequenciesare made cumulative.Consideringthe lastcumulative
frequencyitemasequal to100, all the differentcumulativefrequenciesare convertedinto
percentages.
(iii) Cumulative percentagesof these twovariablesshouldbe plottedonX – axisand Y – axis.
Profit Cumulative
profit
Cumulative
Profit%
No.of
companies
Cumulative
number
Cumulative
number%
6
25
60
84
105
150
170
400
6
31
91
175
280
430
600
1000
0.6
3.1
9.1
17.5
28
43
60
100
6
11
13
14
15
17
10
14
6
17
30
44
59
76
86
100
6
17
30
44
59
76
86
100
Assignment
Long AnswerQuestions
1. What isthe meaningof dispersionandwhatare itsobjectives?Mentioncharacteristicsof a
goodmeasure of dispersion.
2. A measure of dispersionisagood supplementtothe central value inunderstandingafrequency
distribution.Comment.
Ans.A central value summarizesthe frequencydistributionintosingle figure,whichcanbe
regardedas itsrepresentative.However,averagesare notalone sufficienttodescribe the
characteristicsof a statistical data.Inorder to understandthe frequencydistributionfully,itis
essential tostudythe variabilityof the observation.
Measuresof dispersionimprovesthe understandingof adistribution.Forexample,percapita
income givesonlythe average income.A measure of dispersioncantell aboutthe income
inequalities,therebyimprovingthe understandingof the relative standardsof livingenjoyedby
differentstrataof society.
3. Explainmeritsanddemeritsof quartile deviation.
0
20
40
60
80
100
120
0 20 40 60 80 100 120
%ofProfits
% of number of Companies
39. 38
Measuresof Correlation
In the previouschapter,we have studiedthe statistical problemsanddistributionsrelatingtoone
variable.We discussedvariousmeasuresof central tendencyanddispersion,whichare confinedtoa
single variable/thiskindof statistical analysisinvolvingone variable isknownasunivariate distribution.
But we may come across a numberof situationswithdistributionshavingtwovariables.Forexample,
we may have data relatingtoincome andexpenditure,price anddemand,heightandweightetc.The
distributioninvolvingtwovariablesiscalledbivariate distribution.
In a bivariate distribution,we maybe interestedtofindif there isanyrelationshipbetweenthe two
variablesunderstudy.Inday-to-daylife,we observe thatthere existscertainrelationshipbetween two
variableslike betweenincome andexpenditure,price anddemandandsoon. Correlationisastatistical
tool whichstudiesthe relationshipbetweentwovariables.
Meaningof Correlation
Correlationindicatesthe relationshipbetweentwovariablesof aseriessothatchangesin the valuesof
one variable are associatedwithchangesinthe valuesof the othervariables.
Significance of correlation:
Correlationhasimmense utilityinstatistics.
i. It helpsindeterminingthe degree of relationshipbetweenvariables.
ii. We can estimate the value of one variable onthe basisof the value of anothervariable
correlationservesthe basisof regression.
iii. Correlationisuseful foreconomists.Aneconomistspecifiesthe relationshipbetween
differentvariableslikedemandandsupply,moneysupplyandprice level bywayof the
correlation.
Correlationandcausation:Itmeasuresco-variation,notcausation.Itshouldneverbe interpretedas
implyingcause andeffectrelationshipbetweentwovariables.The presence of correlationbetweentwo
variablesXandY simplymeansthatwhenone variable isfoundtochange inone direction,the valueof
the othervariable isfoundtochange eitherinsame directionorinthe opposite direction.
Positive andNegative Correlation: - Correlationisclassifiedintopositive andnegativecorrelationwhen
twovariablesmove inthe same direction,i.e.if the value of Yincreases( or decreases) withanincrease
(or decrease) inthe value of X,theyare saidto be positivelyrelated.Onthe otherhandwhentwo
variablesmove inthe oppositedirectioni.e.if the valueof variable ‘X’increase(ordecrease) withthe
decrease orincrease inthe value of Y variable,theyone saidtobe negativelycorrelated.
Linearand Non- linearcorrelation:- Correlationmaybe linearornon-linear.If the amountof change in
one variable tendstohave a constantrelationwiththe amountof change inthe othervariable thenthe
correlationissaidtobe liner.Itisrepresentedbyastraightline.Onthe otherhandif the amountof
change in one variable doesnothave constantproportional relationshiptothe amountof change in the
othervariable,thenthe correlationissaidtobe non-linearorcurvi-linear.
Simple ,multipleandpartial correlation:- Correlationmayalsobe simple,multipleandpartial
correlation.Whentwovariablesare studiedtodetermine correlation,itiscalledsimplecorrelationon
40. 39
the otherhand whenmore thantwo variablesare studiedtodetermine the correlationitiscalled
multiple correlation.Whencorrelationof onlytwovariablesisstudiedkeepingothervariablesconstant,
it iscalledpartial correlation.
Methodsof studyingcorrelation:- The correlationbetweenthe twovariablescanbe determinedbythe
followingthree methods:-
(a) Scatter diagram
(b) Karl Pearson’smethodof correlation coefficient
(c) Spearman’smethodof Rankcorrelation.
Scatter Diagram:It isa graphic(or visual) methodof studyingcorrelation.Toconstructa scatter
diagram,x.variable istakenonX axisand Y Variable istakenonY-axis.The clusterof pointsso plottedis
referredtoas a scatter diagram.Ina scatterdiagram, the degree of closenessof scatterpointsandtheir
overall directiongivesusanideaof the nature of the relationship:-
(i) If the dotsmove fromleftto the rightupwards,correlationis saidtobe positive where as
the movementsof dotsfromlefttorightdownwardindicatesnegative correlation.
(ii) Dots ina straightline indicate perfectcorrelation.
(iii) Scattereddotsindicate no-correlation.
PerfectPositivecorrelation
PerfectNegativecorrelation
No correlation
Karl pearson’scoefficientof correlation:-
Karl pearson’scoefficientof correlationisanimportantandwidelyusedmethodof studyingcorrelation.
Karl pearsonhas measuredthe degree of relationshipbetweenthe twovariableswithhelpof
correlationcoefficient.Coefficientof correlationmeasuresthe degree of relationshipbetweenthe two
variables.
Computationof Karl pearsonscoefficientof correlation:- The variousformulae usedtocalculate
coefficientof correlation (r) are :-
r =
∑𝑥𝑦
√𝑥2×𝑦2
Some of the importantpropertiesof karl- pearson’scoefficientof correlationare : -
(i) The correlationcoefficientisindependentof the unitsof measurementof the variables:-
(ii) The value of co-relationcoefficient(r) lies between+1and -1.
(iii) The correlationcoefficientisindependentof the choice of bothoriginandscale of
observations.
(iv) The correlationcoefficientof the variablesx andy issymmetric,i.e;xyyx r r .
Illustration1.Calculate coefficientof correlation,giventhe followingdata –
43. 42
INDEXNUMBERS
Index numbersare deviceswhichmeasure the change inthe level of aphenomenonwithrespectto
time,geographical locationorsome othercharacteristic.Anindex numberisastatistical device for
measuringchangesinthe magnitude of agroup of relatedvariables.Itisa measure of the average
change in a groupof relatedvariablesovertwodifferentsituations.
Meaning:Index numbersisastatistical tool formeasuringrelative change inagroupof relatedvariables
overtwo or more differenttimes.
“Index numbersare devicesformeasuringdifferencesinthe magnitude of agroupof relatedvariables”.
– CroxtonandCowden
Featuresof an Index Number
a. Theyare expressedinpercentages.
b. Theyare special typesof averages.
c. Theymeasure the effectof change overa periodof time.
Problemsinconstructionof Index Numbers
a. Definingthe purpose of index numbers
b. Selectionof items
c. Selectionof base period
d. Selectionof prices
e.Selectionof weights
f.Choice of an average
g. Choice of the formulae
Price index are of twotypes
a. Simple Index Number
b. Weightedprice Indexnumbers
Constructionof simple Index Numbers:- There are twomethods
a. Simple aggregate Method
P01 =
∑ 𝑃1
∑ 𝑃0
× 100
b.Simple Average of price relative methodP01= ∑ (
𝑃1
𝑝0
× 100) /N
6. WeightedIndex Numbers
There are twomethods:-
44. 43
a. WeightedAggregate method:- Inthismethodcommoditiesare assignedweightsonthe basisof
quantitiespurchased.
a) Laspeyre’sMethod
Laspeyresin1871 gave an weightedaggregatedindex,inwhichweightsare representedbythe
quantitiesof the commoditiesinthe base year.
𝑃01 =
∑𝑝1𝑞0
∑𝑝0𝑞0
𝑥100
steps–
The variousstepsinvolvedare –
(i) Multiplythe currentyearprices(P1) bybase yearquantity(q0) andtotal all suchproductsto
get∑P1q0.
(ii) Similarly,multiplythe base yearprices(P0) bybase yearquantity (q0) andobtainthe total to
get∑P1q0.
(iii) Divide ∑P1q0 by∑p0q0 andmultiplythe quotientby100. Thiswill be the index numberof the
currentyear.
Paasche’sMethod
The German statisticianPaasche in1874 constructedan index numberinwhichweightsare
determinedbyquantitiesinthe givenyear.
P01 =
∑𝑝1𝑞1
∑𝑝0𝑞1
x100
Fisher’sMethod
P01 =√
∑𝑝1𝑞0
∑𝑝0𝑞0
𝑥
∑𝑝1𝑞1
∑𝑝0𝑞1
x 100
Why Fisher’smethodisanideal method?
1. The formulaisbasedon geometricmeanwhichisconsideredtobe the bestaverage
for constructingindex numbers.
2. It considersbothbase yearand currentyearquantitiesasweights.So,itavoidsthe
biasassociatedwiththe Laspeyre’sandPaasche’sindexes.
3. It satisfiestime reversaltestandfactorreversal test.
Question1.Calculate Laspeyre’s,Paasche’sandFisher’sIndexnumbersfromthe followingdata:
Commodity Base Year CurrentYear
Price (₹) Quantity Price Quantity
(p0) (q0) (p1) (q1)
A 10 30 12 50
B 8 15 10 25
C 6 20 6 30
D 4 10 6 20
Solution - 690/
45. 44
Commodity P0 Q0 P1 Q1 P0Q0 P0Q1 P1Q0 P1Q1
A 10 30 12 50 300 500 360 600
B 8 15 10 25 120 200 150 250
C 6 20 6 30 120 180 120 180
D 4 10 6 20 40 80 60 120
580 960 690 1150
Laspeyre’sIndex Number(P01)=
∑𝑝1𝑞0
∑𝑝0𝑞0
𝑥100
=
690
580
𝑥100 = 118.965
Paasche’sIndex Number(P01) =
∑𝑝1𝑞1
∑𝑝0𝑞1
x100
=
1150
960
x100
= 119.79
Fisher’sIdeal IndexNumber P01 = √
∑𝑝1𝑞0
∑𝑝0𝑞0
𝑥
∑𝑝1𝑞1
∑𝑝0𝑞1
x 100
= √
690
580
𝑥1150/960
𝑥100
= 119.376
b. WeightedAverage of Price RelativeMethod:- Underthismethodcommoditiesare assigned
weightorthe basisof base’syearvalue (W=P0 Q 0 ) or fixedweights(W) are used.
P01 = ∑ 𝑅𝑊/ ∑ 𝑊
Where R = P1 × 100 P0 W = value inthe base year(P0 Q 0) or fixedweights
Typesof Index Numbers
(i) ConsumerPrice Index(CPI) –It reflectsthe average increaseinthe costof the commodities
consumedbya class of classof people sothattheycan maintainthe same standardof living
inthe currentyearas inthe base year.
Theyare designedtomeasure effectsof change inpricesof a basketof goodsand
servicesonpurchasingpowerof a particularsectionof the societyduringanygiven
(current) periodwithrespecttosome fixed(base) period.
CPIis alsoknownas –
(a) Cost of livingindexnumbers
(b) Retail price index numbers
(c) Price of livingindex numbers
Methodsof ConstructingCPI
(a) Aggregate Expenditure Method –Thismethodissimilartothe Laspeyre’smethod of
constructingweightedindex.
CPI=
∑𝑝1q0
∑p0q0
x100
47. 46
b. It isusedfor grant of DearnessAllowance.
c. It is usedbygovernmentforframingwage policy,price policyetc.
d. CPIis usedasprice deflatorof income
e.CPI isusedas indicatorof price movementsinretail market.
(ii) Whole Sale Price Index(WPI)–
Wholesale Price Index(WPI):-
a. It measuresthe relative change inthe price of commoditiestradedinwholesale market.
b. It indicatesthe change inthe general price level.
c. It doesnot include services
Uses of WPI
a. Basisof DearnessAllowance
b. Indicatorof changesineconomy
c. Measuresthe rate of inflation
(iii) Index numberof Industrial Production(IIP) –
Index Numberof Industrial Production(IIP)
It indicatesthe changesinlevelof Industrial productionorapercentage change inphysical volume
of outputof commoditiesinfollowingindustries
a. Mining
b. Quarrying
c. Manufacturing
d. Electricityetc.,
IIP= ∑ (q1 /q0) X100
W = relative importance of differentoutput.
q0 = Base year quantity.
q1= CurrentYear Quantity.
Uses of Index Numbers.
a. Helpsusto measure changesinprice level
b. Helpusto knowchangesin costof living
c. Helpgovernmentinadjustmentof salariesandallowances
48. 47
d. Useful toBusiness Community
e.InformationtoPoliticians
f.Informationregardingforeigntrade
(iv) SENSEX
SENSEX
SENSEXis the shortform of Stock Exchange Sensitive Index with1978-79 as base.It is a useful guide
for the investorsinthe stockmarket.Itdealswith30 stocksrepresentedby13 sectorsof the
economy.
InflationandIndex Numbers
Inflationrefersto rise inthe general price levelinacountry overa fairlylongperiodof time.Often,
inflationismeasuredintermsof WPI.A consistentrise inthe wholesale price index overtime
impliesasituationof inflation.
Rate of Inflation=
𝐴2−𝐴1
𝐴1
𝑥100
Where A1 = whole sale price indexforweek1
A2 = whole sale price index forweek2
Questions:-
1. What is an Index Number?
2. What is a Base Year?
3. What is SENSEX?
4. Mentionany three problemsinthe constructionof Index Numbers
5. Construct Costof LivingIndex Numberfromthe followingdata
Commodities Price in2010 Quantityin2010 Price in2015
A
B
C
D
E
25
36
12
6
28
16
7
3.5
2.5
4
35
48
16
10
28
RevisionQuestions
Multiple Choice Questions(MCQs)
49. 48
1. The Paasche index numberisbasedon –
(a) Base year quantities
(b) Currentyearquantities
(c) Average of currentand base year
(d) None of these
2. Index numberforthe base periodisalwaystakenas –
(a) 100 (b) 1 (c) 50 (d) 200
3. Fisher’sIdeal Indexisthe –
(a) Mean of Lespeyre’s andPaasche’sindices
(b) Medianof Lespeyre’sandPaasche’sindices
(c) Geometricmeanof Lespeyre’sandPaasche’sindices
(d) None of these
4. We use price index numbers –
(a) To measure andcompare
(b) To compare prices
(c) To measure prices
(d) None of these
Veryshortanswertype questions
1. Define indexnumber.
2. State any one feature of index number.
3. Define base year.
4. What ismeantby relative price?
5. State any one use of index number.
Short AnswerType Questions