1. RaeAnne Smith
HL Biology Y2
Soule: Period 7
10 October 2011
Affect of Sugars on Yeast Respiration
Introduction
Cellular respiration can be defined as the release of energy, or the breakdown of carbohydrates
into carbon dioxide and water1. Cell respiration takes place in the mitochondria of animals and in
the cytoplasm of plants. The formula for aerobic cellular respiration is:
Aerobic respiration occurs when oxygen is present, while anaerobic respiration occurs when
there is no oxygen present. In anaerobic respiration, ethanol and carbon dioxide are produced.
In this investigation, the rate of carbon dioxide production (cellular respiration) of yeast using
different sugars and one artificial sugar will be measured. The natural sugars used in this
investigation will be sucrose (table sugar) and lactose (in milk). The artificial sugar that will be
used is aspartame (equal). The rate of respiration between the natural sugars will be compared to
that of the artificial sugar. The molarity of the sugar will remain constant at 0.4M for all the
sugars used and the amount and type of yeast used will be the same. It is expected that the yeast
will have a higher rate of respiration for the natural sugars than the artificial sugar. As aspartame
is about 200 times sweeter than natural sugar, only small amounts are put into packets of equal,
and other substances such as dextrose or maltodextrin are used as "fillers" to make it appear as
though there is more aspartame in the packet than there is2. It is predicted that because there is
only a very small amount of sugar in the equal packets, that the yeast will have less to
metabolize, and therefore the rate of respiration will be lower.
Design
Research Question: How do natural sugars versus artificial sugars affect the rate of cellular
respiration in yeast?
Dependent Variable: The sweetener used - sugar (sucrose and lactose) vs. artificial sugar
(aspartame).
Independent Variable: The rate of cellular respiration of the yeast.
Controlled Variables: Amount of yeast used, type of yeast used, molarity of sugar used,
temperature of water.
Materials:
About 20 packets of Aspartame
20g of Lactose
20g of Sucrose
2. One large beaker (400mL beaker)
One small beaker (150mL beaker)
Two 10mL graduated cylinders
One 100mL graduated cylinder
2 pipettes
Test tubes
Test tube stand
Lap top
Vernier software
Gas pressure sensor
Mass scale
Hot plate
Thermometer
Weighing papers
30g of yeast
Procedure:
1. Use the 100mL graduated cylinder to fill large (400mL) beaker with 150mL of water
2. Place beaker with water onto hot plate
3. Turn the heat up to 4 or 5
4. Wait about 5 minutes for water to heat to about 40-45 C (optimal temperature for yeast to
activate) while using the thermometer to take the temperature
5. Pour 30g of yeast into weighing paper (use the mass scale to measure 30g).
6. Once the water is heated, pour measured 30g of yeast into the beaker with the heated water
7. Stir the yeast until no clumps remain
8. Wait several minutes for yeast to activate (there will be a layer of foam on top of the yeast
when it is activated)
9. Fill the small (150mL) beaker with 100mL of water using the 100mL graduated cylinder
10. Measure out 13.68g of sucrose (to make 0.4M) using the weighing paper and mass scale
11. Pour the sugar into the small beaker with 100mL of water
12. Stir until the sucrose has dissolved (for lactose and aspartame, the water must be heated in
order for the sugars to properly dissolve)
13. Set up test tube into test tube stand
14. Set up loggerpro software, including the gas pressure sensor
15. Use a pipette to measure out 10mL into the 10mL graduated cylinder of 0.4M sucrose water
and pour it into the test tube
16. Use the other pipette to measure 10mL of yeast solution into the other 10mL graduated
cylinder.
17. Pour 10mL of 0.4M sucrose into test tube
3. 18. Add the 10mL of yeast solution to the test tube
19. Shake the test tube slightly so the yeast and water are evenly distributed
20. Attach the gas pressure sensor to the test tube
21. Measure the rate of respiration with logger pro for 300 seconds (5 minutes)
22. Repeat the steps for 5 trials
23. Repeat procedure for lactose and aspartame.
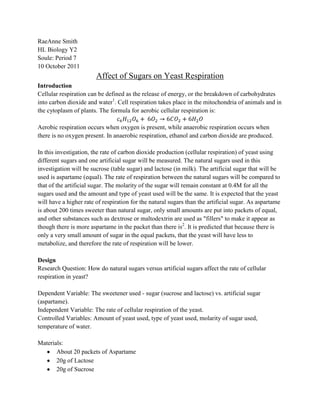
Rubber Stopper
Gas Pressure Computer
Sensor
Test Tube
Yeast/Sucrose
solution
Figure 1: Set up of the experiment.
Not shown is the test tube stand
Data Collection and Processing
Table 1: Type of sugar vs. rate of respiration data
Type of
Sugar Rate of Respiration (kPa) [±0.0001]
Trial 1 Trial 2 Trial 3 Trial 4 Trial 5 Average
Sucrose 0.0209 0.0637 0.0475 0.0448 0.0788 0.0511
Lactose -0.0002 -0.0006 -0.0003 -0.0003 -0.0002 -0.0003
Aspartame -0.0004 -0.0006 -0.0021 -0.0008 - 0.0006 -0.0009
Table 1: This table shows the rate of respiration of the yeast for the different sugars for each
trial, as well as the average rate for each sugar. One trial was taken for the control group (yeast
with pure water, no sugar) and the rate of respiration was 0.0031kPa.
Table 2: Type of sweetener vs. average rate of respiration
Type of Sweetener (natural sugar vs. Average Rate of Yeast Respiration
artificial) (kPa)
Natural (Sucrose and Lactose) 0.0254
Artificial (Aspartame) -0.0009
Table 2: This table shows the average rate of respiration of the sucrose and lactose versus the
respiration rate of the aspartame.
4. Graph 1: This is a sample graph, taken from trial 2 of sucrose. The slope is taken at about 120
seconds because the yeast did not begin to metabolize the sugar until then.
Qualitative Observations:
The changes during respiration of the yeast were very slight. During the yeast's respiration of the
sucrose, bubbles began to form as the rate of respiration (or pressure) began to increase (usually
around 150 seconds).
Graph 2: This graph shows the average rate of respiration for each of the sweeteners used. The
sucrose had the highest rate of respiration, while the lactose and aspartame had negative slopes,
suggesting that the yeast was unable to metabolize the lactose and aspartame.
5. Graph 3: This graph shows the average rate of respiration of the natural sugars versus the
average rate of respiration for the artificial sugar (aspartame).
Table 3: P-value of sucrose, lactose & aspartame
P-Value
Sucrose Lactose Aspartame
Sucrose X 0.0007 X
Lactose X X 0.1031
Aspartame 0.0007 X X
Table 3: This table shows the results of a t-test performed on the average respiration rates for
each sugar. The p-value is shown, and the red ones are considered to be statistically significant
(less than 0.05).
Sample Calculations
i. Average for Sucrose:
= (trial 1 + trial 2 + trial 3 + trial 4 + trial 5) / 5
= (0.0209 + 0.0637 + 0.0475 + 0.0448 + 0.0788) / 5
= 0.2557 / 2
= 0.0511
ii. 0.4 Molarity for Sucrose:
= C12H22O11
= (12.011 x 12) + (1.0079 x 22) + (15.999 x 11)
6. = 144.132 + 22.1738 + 175.989
= 342.29
= 0.4 x 342.29
= 136.8
= 136.8/1000 = x/100
=1000x = 136.8 (100)
= 13.68g of sucrose in 100mL of water
Conclusion
The results of the experiment showed that sucrose had the highest rate of respiration, as was
predicted. The results also showed that both lactose and aspartame were unable to be
metabolized properly by the yeast, causing the slope to be negative. The results of the t-test
performed showed a p-value of 0.0007 between both sucrose and lactose and sucrose and
aspartame, meaning that the difference between them is extremely statistically significant. The p-
value between the lactose and aspartame though, was only 0.1031, which is not statistically
significant. Although one of the natural sugars (sucrose) did cause the yeast to have a higher
respiration rate, the other natural sugar (lactose) did not. This suggests that the rate of respiration
of yeast does not depend on whether the sugar is natural or artificial, but whether the yeast has
the proper enzymes to metabolize the sugar presented to it.
The yeast has certain enzymes designed to metabolize glucose and galactose specifically, but
these enzymes are not able to properly process lactose 3. This presents a reason for the yeast
producing a negative slope when given lactose. Equal packets also sometimes contain lactose to
create bulk, since only small amounts of aspartame are needed. In this case, the yeast would be
unable to metabolize the lactose.
Evaluation
The most significant possible source of error could have come from a leak in the gas pressure
sensor. This would affect the data by creating a negative slope when there could have been a
positive slope because the air would be leaking out from the test tube, lowering the pressure.
This could be the result of the rubber stopper not being pushed in far enough in the test tube to
prevent a leak, or a leak from the tube connecting to the rubber stopper. A solution to this source
of error would be to
The next most significant source of error could have come from the temperature of the yeast
solution. The water that the yeast was placed into to activate, was heated to 42°C. After the
yeast was activated in this solution, it was used for the first set of trials. While the first trials
were being done, the yeast solution had time to cool down, and by the time it was used for the
next set of trials, the yeast solution was a different temperature. The different temperatures could
have affected the yeast respiration rate. With the warmer temperatures, the molecules move
faster, enabling for more collisions, which could have caused the rate of respiration to be higher
for the first set of trials, when the yeast was warmer. A solution to this problem would be to keep
7. the yeast solution in a warm water bath, in order to keep the temperature constant, and to have a
thermometer in the solution to check for changes in temperature.
The final most significant source of error could have been the amount of yeast used for every
trial. On top of the yeast solution there was a thick layer of foam. When using the pipette to put
the solution into the 10mL graduated cylinder, some foam was also added to it. The foam made it
difficult to determine whether the yeast solution had reached 10mL, or if it appeared that way
because of the foam on top of the yeast. This could have resulted in there being less than 10mL
of yeast for some trials, while others have 10mL of yeast. This could affect the data because
there would be more yeast to metabolize the sugar, which could increase the rate of respiration.
A solution to this would be to use a spoon to remove the excess foam on top of the yeast
solution, leaving only the liquid, useable substance.
A possible extension to this investigation could be to compare the effect of monosaccharides,
disaccharides and polysaccharides on yeast respiration rate. More types of artificial sugars could
have been used as well, such as splenda (sucralose).
There is also a type of yeast that is genetically engineered by scientists to contain the enzyme
lactase, enabling the yeast to metabolize lactose4. The rate of respiration between the genetically
engineered yeast and the normal yeast could be compared.
Sources:
[1] http://www.anaerobicrespiration.net/
[2] http://www.equal.com/equal-classic/faqs#saccharin01
[3] http://www.madsci.org/posts/archives/2005-11/1132509463.Cb.r.html
[4] http://www.ncbi.nlm.nih.gov/pmc/articles/PMC195890/