Energy scenario: Save Today, Survive Tomorrow
•
1 gostou•640 visualizações

The presentation describes the complete energy scenario of World and India as of 2020. It also describes the prime energy sources that the entire world depends on.

Recomendados
Mais conteúdo relacionado
Mais procurados
Mais procurados (20)
Semelhante a Energy scenario: Save Today, Survive Tomorrow
Semelhante a Energy scenario: Save Today, Survive Tomorrow (20)
Mais de R.Arun Kumar M.E (Ph.D.)
Mais de R.Arun Kumar M.E (Ph.D.) (20)
Último
Último (20)
Energy scenario: Save Today, Survive Tomorrow
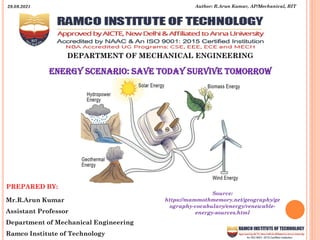
- 1. DEPARTMENT OF MECHANICAL ENGINEERING PREPARED BY: Mr.R.Arun Kumar Assistant Professor Department of Mechanical Engineering Ramco Institute of Technology ENERGy SCENARIO: SAVE TODAY SURVIVE TOMORROW Author: R.Arun Kumar, AP/Mechanical, RIT 29.09.2021 Source: https://mammothmemory.net/geography/ge ography-vocabulary/energy/renewable- energy-sources.html
- 2. Outcome of the presentation: At the end of reading this content the reader will be able to narrate the energy scenario of World and India in various primary energy sources aspects. 2 Author: R.Arun Kumar, AP/Mechanical, RIT Source: https://giphy.com/explore/objectives 29.09.2021
- 3. WHAT IS ENERGY CONSERVATION? Minimizing the energy consumption without affecting the human comfort. 3 Source: https://people.howstuffworks.com/will-sleeping-with-fan- on-kill.htm https://www.lsu.edu/reslife/housing/traditional/cedar.php Author: R.Arun Kumar, AP/Mechanical, RIT 29.09.2021
- 4. ENERGY CONSERVATION: What would be the electrical energy requirement per day of a household of 5 persons with an AC, water heater, washing machine? 10 units (app.) What is the electricity demand of a state? (Consider Tamil Nadu) 13,500MW to 14,500MW What is the electricity demand of our country? 1,80,000MW 4 Source: https://timesofindia.indiatimes.com/city/chennai/tn-joins-maha-gujarat-up-with-more-than-300mu-power- consumption/articleshow/58522802.cms https://en.wikipedia.org/wiki/Electricity_sector_in_India Author: R.Arun Kumar, AP/Mechanical, RIT 29.09.2021
- 5. PRIMARY ENERGY SOURCES THAT DRIVES WORLD: 5 Oil NG Coal Nuclear Renewable Source: https://giphy.com/explore/earth Author: R.Arun Kumar, AP/Mechanical, RIT 29.09.2021
- 6. COAL: The proven global reserve of world was estimated to be 10,74,108 million tonnes by end of 2020. 1. USA with 23.2% of total reserve 2. Russia holds 15.1% 3. Australia holds 14.0% 4. China holds 13.3% 5. India with 10.3% of total reserve NOTE : The proven reserve at the end of 2010 was 10,59,053 million tonnes. World’s reserve – 139 years, India’s – 120 years Indonesia is the 5th largest producer of coal by 2018 & 2019 followed by India 6 Source: BP Statistical report Data reference : BP Statistical report, 2021 Author: R.Arun Kumar, AP/Mechanical, RIT 29.09.2021
- 7. COAL: 7 Source : BP Statistical report, 2021 Author: R.Arun Kumar, AP/Mechanical, RIT 29.09.2021
- 8. COAL: Note: Commonwealth of Independent States (9 countries including Russia) 8 Source : BP Statistical report, 2021 Author: R.Arun Kumar, AP/Mechanical, RIT 29.09.2021
- 9. COAL: 9 Data reference : BP Statistical report, 2021 Author: R.Arun Kumar, AP/Mechanical, RIT Indonesia have became the 5th largest producer in past couple of years 29.09.2021
- 10. COAL: Note: Commonwealth of Independent States (9 countries including Russia ) 1 Exajoule = 2.39 × 10⁷ toe 10 Source : BP Statistical report, 2021 Author: R.Arun Kumar, AP/Mechanical, RIT 29.09.2021
- 11. OIL: The global proven oil reserve was estimated to be 1732.4 billion barrels by the end of 2020. 1. Venezuela shares 17.5% of total reserve 2. Saudi Arabia – 17.2% 3. Canada – 9.7% NOTE: One barrel of oil is approximately 160 liters. India’s reserve is 4.5 billion barrels i.e. 0.3% World’s reserve – 50 years; India’s – 10 years India imports 82% of it’s requirement i.e. 51,23,000 barrels per day approximately. Iran was forced to reduce its 231.4Mtoe in 2017 to 142.7 Mtoe in 2020.. 11 Source: https://www.fool.com/investing/2019/12/30/why- valaris-stock-is-soaring-today.aspx https://en.wikipedia.org/wiki/List_of_countries_ by_oil_imports#cite_note-4 Data reference : BP Statistical report, 2021 Author: R.Arun Kumar, AP/Mechanical, RIT 29.09.2021
- 12. OIL: 12 Source : BP Statistical report, 2021 Author: R.Arun Kumar, AP/Mechanical, RIT 29.09.2021
- 13. OIL: 13 Source : BP Statistical report, 2021 Author: R.Arun Kumar, AP/Mechanical, RIT 29.09.2021
- 14. OIL: 14 Data reference : BP Statistical report, 2021 Author: R.Arun Kumar, AP/Mechanical, RIT 29.09.2021
- 15. OIL: 15 Source : BP Statistical report, 2021 Author: R.Arun Kumar, AP/Mechanical, RIT 29.09.2021
- 16. NATURAL GAS: The global proven Natural Gas reserve was estimated to be 188.1 trillion cubic meter at the end of 2020. 1. Russia holds 19.9% of total share 2. Iran – 17.1% 3. Qatar – 13.1% NOTE: India’s has a proven reserve of 1.3 trillion cubic meter which is 0.7% of world’s World’s reserve – 48.8 years; India’s – 20 years 16 Source: https://clubofmozambique.com/news/natura l-gas-extraction-in-mozambique-likely-to- begin-in-2021/ Data Reference : BP Statistical report, 2020 & 2021 Author: R.Arun Kumar, AP/Mechanical, RIT 29.09.2021
- 17. NATURAL GAS: 17 Source : BP Statistical report, 2021 Author: R.Arun Kumar, AP/Mechanical, RIT 29.09.2021
- 18. NATURAL GAS: 18 Source : BP Statistical report, 2021 Author: R.Arun Kumar, AP/Mechanical, RIT 29.09.2021
- 19. NATURAL GAS: 19 Data reference : BP Statistical report, 2021 Author: R.Arun Kumar, AP/Mechanical, RIT 29.09.2021
- 20. NATURAL GAS: 20 Source : BP Statistical report, 2021 Author: R.Arun Kumar, AP/Mechanical, RIT 29.09.2021
- 21. NUCLEAR ENERGY: Due to the increasing threat of Nuclear power plant, the consumption pattern varies as per the scenario. It was 563.20 Mtoe during 2019. 1. US is the largest consumer with 30.8% 2. France – 13.1% 3. China – 13.6% 4. Russia – 8.0% Note: India shares 1.7% of total consumption India’s share is 0.40 exajoules 1 Exajoule = 2.39 × 10⁷ toe 21 Source: https://www.novim.org/projects/nuclear- energy Data reference : BP Statistical report, 2021 Author: R.Arun Kumar, AP/Mechanical, RIT 29.09.2021
- 22. NUCLEAR ENERGY: 5th largest consuming country is South Korea as on 2018. Fukushima accident happened on March 11, 2011. Later Japan stopped Nuclear Energy production by 2013. Thereafter by creating awareness, generation as on 2018 was 6.6Mtoe. Now American & European countries minimizes their generation. 22 Data reference : BP Statistical report, 2020 Author: R.Arun Kumar, AP/Mechanical, RIT 29.09.2021
- 23. NUCLEAR ENERGY: On 14th May, 2020 Germany demolished the cooling tower of Philippsburg NPP. Earlier, two reactors were decommissioned in 2011 and 2019 respectively as a part of policy to exit NPP. 23 Source https://www.usatoday.com/videos/news/have-you- seen/video/2020/05/15/cooling-towers-demolished-germany- continues-energy-transition/652393000/ Author: R.Arun Kumar, AP/Mechanical, RIT 29.09.2021
- 24. NUCLEAR ENERGY: 24 Source : BP Statistical report, 2021 Author: R.Arun Kumar, AP/Mechanical, RIT 29.09.2021
- 25. RENEWABLE ENERGY: Increase in the global warming forced the countries to switch over to renewable resources from conventional resources. The consumption was 757.38 Mtoe 1. China at the top with 24.6% share 2. USA – 19.4% 3. Germany – 7.0% 4. Brazil – 6.3% 5. India – 4.5% Note: In 2008 India and China consumed 5.4 Mtoe and 6.4 Mtoe respectively 25 Source: https://www.vccircle.com/reliance-to-buy- majority-stake-in-renewable-energy- services-firm-kanoda/ Data Reference : BP Statistical report, 2021 Author: R.Arun Kumar, AP/Mechanical, RIT 29.09.2021
- 26. RENEWABLE ENERGY: India shares 4.5% of total renewable energy consumption of world against China’s 24.6%. Growth rate of total World have seen a sharp decrease to 9.7% against the growth rate of 13.4% during the period 2009 – 2019. 26 Data reference : BP Statistical report, 2021 Author: R.Arun Kumar, AP/Mechanical, RIT 29.09.2021
- 27. RENEWABLE ENERGY: 27 Source : BP Statistical report, 2021 Author: R.Arun Kumar, AP/Mechanical, RIT 29.09.2021
- 28. PRESENT ENERGY SCENARIO OF WORLD: 28 Source : World Energy Outlook Report Author: R.Arun Kumar, AP/Mechanical, RIT 29.09.2021
- 29. PRESENT ENERGY SCENARIO OF WORLD: Inferences: Energy requirement of world – 15 billion toe Total population of world – 7.5 billion Population consuming 50% of energy demand – 1.2 billion (16%) Population using remaining 50% – 4.7 billion Population having no access to electricity – 1.6 billion Note: 1 tonne of oil equivalent is amount of energy generated by burning one tonne of crude oil (i.e. 7.4 barrel or 1184 litres) 29 Author: R.Arun Kumar, AP/Mechanical, RIT 29.09.2021
- 30. PRESENT ENERGY SCENARIO OF WORLD: 30 Source https://www.visualcapitalist.com/mapped-billion-people- without-access-to-electricity/ Author: R.Arun Kumar, AP/Mechanical, RIT 29.09.2021
- 31. PRESENT ENERGY SCENARIO OF INDIA: 31 Source : India Energy Outlook report 2021 Author: R.Arun Kumar, AP/Mechanical, RIT 29.09.2021
- 32. PRESENT ENERGY SCENARIO OF INDIA: 32 Source : Mercom India Research Author: R.Arun Kumar, AP/Mechanical, RIT 29.09.2021
- 33. PRESENT ENERGY SCENARIO OF INDIA: 33 Source : Mercom India Research Author: R.Arun Kumar, AP/Mechanical, RIT 29.09.2021
- 34. PRESENT ENERGY SCENARIO OF INDIA: 34 Source https://cleantechnica.com/2019/01/21/74-of-indias-new-power-capacity-addition-in- 2018-was-renewables/ Author: R.Arun Kumar, AP/Mechanical, RIT 29.09.2021
- 35. PRESENT ENERGY SCENARIO OF INDIA: Note: Per capita consumption during freedom was 16.3kW-hr 35 Data Reference : Central Electricity Authority Author: R.Arun Kumar, AP/Mechanical, RIT 29.09.2021
- 36. GLOBAL WARMING BY CONVENTIONAL PP: 36 Source https://powerprofessionals.wordpress.com/power-station/thermal-power-plant/ https://en.wikipedia.org/wiki/Electricity_sector_in_India Note: India’s installed capacity is 2,05,134.5MW as on 31/03/2020 Transmission loss in India is 21% Author: R.Arun Kumar, AP/Mechanical, RIT 29.09.2021
- 37. INTIATIVES AT RAMCO INSTITUTE OF TECHNOLOGY: 30kVA Roof top Solar Power Plant Solid waste management plant Automated lights on and off system Water sensors Creating awareness among students Waste water recycling plant of capacity 1 lakh litre per day 37 Author: R.Arun Kumar, AP/Mechanical, RIT 29.09.2021
- 38. INTIATIVES AT RAMCO INSTITUTE OF TECHNOLOGY: 38 Solar Energy Laboratory Author: R.Arun Kumar, AP/Mechanical, RIT 29.09.2021
- 39. REFERENCES: 39 Author: R.Arun Kumar, AP/Mechanical, RIT 29.09.2021
- 40. References: https://www.iea.org/policies/4916-jawaharlal-nehru-national- solar-mission-phase-i-ii-and-iii https://powermin.gov.in/en/content/power-sector-glance-all-india https://mnre.gov.in/solar/current-status/ 40 Author: R.Arun Kumar, AP/Mechanical, RIT 29.09.2021