QNBFS Daily Market Report March 13, 2017
•
1 gostou•264 visualizações

Yesterday, the QSE Index rose 0.2% to close at 10,491.2.

Recomendados
Mais conteúdo relacionado
Mais de QNB Group
Mais de QNB Group (20)
Último
Último (20)
QNBFS Daily Market Report March 13, 2017
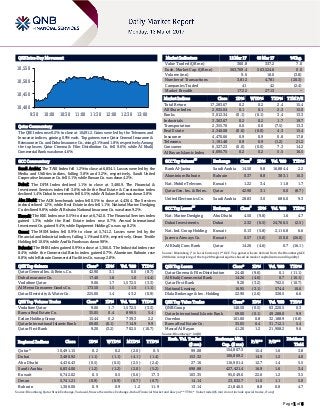
- 1. Page 1 of 6 QSE Intra-Day Movement Qatar Commentary The QSE Index rose 0.2% to close at 10,491.2. Gains were led by the Telecoms and Insurance indices, gaining 0.9% each. Top gainers were Qatar General Insurance & Reinsurance Co. and Doha Insurance Co., rising 3.1% and 1.8%, respectively. Among the top losers Qatar Cinema & Film Distribution Co. fell 9.6%, while Al Khalij Commercial Bank was down 4.6%. GCC Commentary Saudi Arabia: The TASI Index fell 1.2% to close at 6,834.1. Losses were led by the Media and Utilities indices, falling 3.8% and 3.2%, respectively. Saudi United Cooperative Insurance Co. fell 5.1%, while Bawan Co. was down 4.2%. Dubai: The DFM Index declined 1.1% to close at 3,480.9. The Financial & Investment Services index fell 3.6%, while the Real Estate & Construction index declined 1.4%. Dubai Investments fell 6.5%, while Al Salam Bank was down 3.8%. Abu Dhabi: The ADX benchmark index fell 0.5% to close at 4,436.4. The Services index declined 1.2%, while Real Estate index fell 1.1%. National Marine Dredging Co. declined 9.8%, while Al Buhaira National Insurance Co. was down 9.2%. Kuwait: The KSE Index rose 0.5% to close at 6,742.0. The Financial Services index gained 1.3%, while the Real Estate index rose 0.7%. Amwal International Investment Co. gained 9.4%, while Equipment Holding Co. was up 8.2%. Oman: The MSM Index fell 0.9% to close at 5,741.2. Losses were led by the Financial and Industrial indices, falling 1.1% and 0.6%, respectively. Oman Textile Holding fell 10.0%, while Asaffa Foods was down 9.9%. Bahrain: The BHB Index gained 0.9% to close at 1,366.0. The Industrial index rose 8.4%, while the Commercial Banks index gained 0.7%. Aluminum Bahrain rose 8.8%, while Bahrain Commercial Facilities Co. was up 2.8%. QSE Top Gainers Close* 1D% Vol. ‘000 YTD% Qatar General Ins. & Reins. Co. 42.90 3.1 0.0 (8.7) Doha Insurance Co. 17.40 1.8 1.0 (4.4) Vodafone Qatar 9.06 1.7 1,572.5 (3.3) Al Meera Consumer Goods Co. 173.50 1.5 11.5 (1.1) Qatar Electricity & Water Co. 225.00 1.4 43.2 (0.9) QSE Top Volume Trades Close* 1D% Vol. ‘000 YTD% Vodafone Qatar 9.06 1.7 1,572.5 (3.3) Barwa Real Estate Co. 35.05 0.4 899.5 5.4 Ezdan Holding Group 15.44 0.2 739.3 2.2 Qatar International Islamic Bank 69.00 (0.1) 714.9 9.9 Qatar First Bank 9.20 (3.2) 702.5 (10.7) Market Indicators 12 Mar 17 09 Mar 17 %Chg. Value Traded (QR mn) 360.8 337.2 7.0 Exch. Market Cap. (QR mn) 563,769.4 563,524.6 0.0 Volume (mn) 9.6 10.0 (3.8) Number of Transactions 3,812 4,781 (20.3) Companies Traded 41 42 (2.4) Market Breadth 17:22 27:13 – Market Indices Close 1D% WTD% YTD% TTM P/E Total Return 17,283.67 0.2 0.2 2.4 15.4 All Share Index 2,935.04 0.1 0.1 2.3 15.0 Banks 3,012.34 (0.1) (0.1) 3.4 13.3 Industrials 3,363.67 0.2 0.2 1.7 19.7 Transportation 2,355.70 0.0 0.0 (7.5) 13.3 Real Estate 2,340.08 (0.0) (0.0) 4.3 15.4 Insurance 4,470.66 0.9 0.9 0.8 17.8 Telecoms 1,191.48 0.9 0.9 (1.2) 21.2 Consumer 6,327.23 (0.0) (0.0) 7.3 14.2 Al Rayan Islamic Index 4,095.75 0.2 0.2 5.5 16.5 GCC Top Gainers ## Exchange Close # 1D% Vol. ‘000 YTD% Bank Al-Jazira Saudi Arabia 14.50 9.8 16,884.4 2.2 Aluminium Bahrain Bahrain 0.37 8.8 383.1 16.3 Nat. Mobile Telecom. Kuwait 1.22 3.4 11.8 1.7 Qatar Gen. Ins. & Reins. Qatar 42.90 3.1 0.0 (8.7) United Electronics Co. Saudi Arabia 28.83 3.0 686.0 9.3 GCC Top Losers ## Exchange Close # 1D% Vol. ‘000 YTD% Nat. Marine Dredging Abu Dhabi 4.50 (9.8) 1.6 4.7 Dubai Investments Dubai 2.32 (6.5) 24,766.5 (2.5) Nat. Ind. Group Holding Kuwait 0.13 (5.8) 2,116.8 6.6 Jazeera Airways Co. Kuwait 0.57 (5.0) 150.0 (26.0) Al Khalij Com. Bank Qatar 14.26 (4.6) 0.7 (16.1) Source: Bloomberg ( # in Local Currency) ( ## GCC Top gainers/losers derived from the Bloomberg GCC 200 Index comprising of the top 200 regional equities based on market capitalization and liquidity) QSE Top Losers Close* 1D% Vol. ‘000 YTD% Qatar Cinema & Film Distribution 24.40 (9.6) 0.1 (11.1) Al Khalij Commercial Bank 14.26 (4.6) 0.7 (16.1) Qatar First Bank 9.20 (3.2) 702.5 (10.7) National Leasing 16.95 (3.1) 574.4 10.6 Dlala Brokerage & Inv. Holding 22.90 (2.6) 328.5 6.6 QSE Top Value Trades Close* 1D% Val. ‘000 YTD% QNB Group 148.50 (0.5) 63,220.5 0.3 Qatar International Islamic Bank 69.00 (0.1) 49,288.0 9.9 Ooredoo 101.00 0.8 32,188.9 (0.8) Barwa Real Estate Co. 35.05 0.4 31,712.1 5.4 Masraf Al Rayan 41.20 1.2 21,908.2 9.6 Source: Bloomberg (* in QR) Regional Indices Close 1D% WTD% MTD% YTD% Exch. Val. Traded ($ mn) Exchange Mkt. Cap. ($ mn) P/E** P/B** Dividend Yield Qatar* 10,491.15 0.2 0.2 (2.0) 0.5 99.08 154,867.5 15.4 1.6 3.8 Dubai 3,480.92 (1.1) (1.1) (4.1) (1.4) 153.32 106,869.2 14.9 1.2 4.0 Abu Dhabi 4,436.43 (0.5) (0.5) (2.5) (2.4) 27.16 116,901.4 12.7 1.4 5.5 Saudi Arabia 6,834.06 (1.2) (1.2) (2.0) (5.2) 698.88 427,421.4 16.9 1.6 3.4 Kuwait 6,742.02 0.5 0.5 (0.6) 17.3 103.35 95,049.6 22.6 1.2 3.5 Oman 5,741.21 (0.9) (0.9) (0.7) (0.7) 14.14 23,032.7 11.0 1.1 5.0 Bahrain 1,366.00 0.9 0.9 1.2 11.9 13.14 21,846.5 8.8 0.8 4.7 Source: Bloomberg, Qatar Stock Exchange, Tadawul, Muscat Securities Exchange, Dubai Financial Market and Zawya (** TTM; * Value traded ($ mn) do not include special trades, if any) 10,400 10,450 10,500 10,550 9:30 10:00 10:30 11:00 11:30 12:00 12:30 13:00
- 2. Page 2 of 6 Qatar Market Commentary The QSE Index rose 0.2% to close at 10,491.2. The Telecoms and Insurance indices led the gains. The index rose on the back of buying support from non-Qatari shareholders despite selling pressure from Qatari and GCC shareholders. Qatar General Insurance & Reinsurance Co. and Doha Insurance Co. were the top gainers, rising 3.1% and 1.8%, respectively. Among the top losers Qatar Cinema & Film Distribution Co. fell 9.6%, while Al Khalij Commercial Bank was down 4.6%. Volume of shares traded on Sunday fell by 3.8% to 9.6mn from 10.0mn on Thursday. Further, as compared to the 30-day moving average of 10.0mn, volume for the day was 4.2% lower. Vodafone Qatar and Barwa Real Estate Co. were the most active stocks, contributing 16.4% and 9.4% to the total volume, respectively. Source: Qatar Stock Exchange (* as a % of traded value) Earnings Releases and Earnings Calendar Earnings Releases Company Market Currency Revenue (mn) 2016 % Change YoY Operating Profit (mn) 2016 % Change YoY Net Profit (mn) 2016 % Change YoY Saudi Printing and Packaging Co.* Saudi Arabia SR – – 6.0 -83.5% -34.9 N/A Gulf Union Cooperative Ins. Co.* Saudi Arabia SR 277.4 23.3% – – 2.7 128.3% Saudi Indian Co. for Coop. Ins. * Saudi Arabia SR 550.8 5.6% – – 4.3 3.5% Gulf General Cooperative Ins. Co.* Saudi Arabia SR 255.2 -27.5% – – 4.3 N/A Saudi Automotive Services Co.* Saudi Arabia SR – – 19.6 19.2% 26.2 40.4% Source: Company data, DFM, ADX, MSM, TADAWUL (*FY2016) Earnings Calendar Tickers Company Name Date of board meeting No. of days remaining Status MRDS Mazaya Qatar 14-Mar-17 1 Due QFBQ Qatar First Bank 14-Mar-17 1 Due AKHI Al Khaleej Takaful Insurance 14-Mar-17 1 Due AHCS Aamal Company 15-Mar-17 2 Due Source: QSE Overall Activity Buy %* Sell %* Net (QR) Qatari Individuals 38.63% 31.24% 26,653,445.08 Qatari Institutions 18.30% 42.90% (88,746,184.34) Qatari 56.93% 74.14% (62,092,739.26) GCC Individuals 0.78% 0.60% 622,591.61 GCC Institutions 1.15% 13.40% (44,224,225.57) GCC 1.93% 14.00% (43,601,633.96) Non-Qatari Individuals 7.36% 6.53% 3,024,419.59 Non-Qatari Institutions 33.79% 5.33% 102,669,953.63 Non-Qatari 41.15% 11.86% 105,694,373.22
- 3. Page 3 of 6 News Qatar QSE announces trading suspension in the shares of UDCD on March 13 – Qatar Stock Exchange (QSE) announced trading suspension of the shares of United Development Company (UDCD) on March 13, 2017 due to its AGM being held on the day. (QSE) QSE announces the completion of the capital increase subscription of CBQK’s unsubscribed shares – Qatar Stock Exchange (QSE) announced the completion of the capital increase subscription of Commercial Bank of Qatar’s (CBQK) unsubscribed shares amounting to 3,792,314 shares. The sale will start on March 14, 2017 and will be carried during the official trading hours at the main market. (QSE) Nakilat embarks on further expansion into global markets – Qatar Gas Transport Company (Nakilat), which has grown from just an LNG (liquefied natural gas) shipping company to a comprehensive maritime service provider, has embarked on a multi-pronged strategy to further its expansion into global markets. The strategy was emboldened by its foray into repair and construction operations at the Erhama Bin Jaber Al Jalahma Shipyard as well as agency, towage and vessel support services, Nakilat Chairman and Minister of Energy and Industry HE Dr Mohamed bin Saleh al-Sada said to the shareholders at the AGM that approved QR955mn net profit and QR1 per share cash dividend. “In today’s increasingly volatile world economy, it is a necessity for businesses to adapt to survive,” al-Sada said, adding Nakilat’s strategic business planning and investments have helped the company to grow beyond being just an LNG shipper to a comprehensive maritime service provider. Nakilat’s vessels represent around 15% of the global LNG fleet capacity, which translates into more than 9mn cubic meters of LNG transportation. (Gulf-Times.com) Qatar PPI surges 4.5% in January on higher crude, natural gas prices – Oil producers output cut deal from January 1, 2017 has had its reflection on the Qatar’s producer price index (PPI), which surged 4.5% MoM in January 2017 on higher prices for crude and natural gas, according to official data. Qatar’s PPI for the industrial sector, a measure of the average selling prices received by the domestic producers for their output saw a stupendous 23.8% YoY surge this January, primarily on strengthened prices of crude and natural gas, refined petroleum products, other chemical products, basic metals and rubber and plastics products, according to the Ministry of Development Planning and Statistics (MDPS) data. MDPS had released a new PPI series in late 2015. With a base of 2013, it draws on an updated sampling frame and new weights. The previous sampling frame dates from 2006, when the Qatari economy was much smaller than today and the range of products made domestically much narrower. The PPI for mining, which carries the maximum weight of 72.7%, saw its group index soar 3.5% MoM in January 2017 on a 3.5% increase in the price of crude petroleum and natural gas; even as stone, sand and clay prices fell 0.5%. The PPI for mining witnessed the maximum expansion of 30% YoY this January as there was a 30.1% jump in the price of crude petroleum and natural gas but a 0.3% fall in stone, sand and clay prices. (Gulf-Times.com) Qatar, UNESCO sign MoU – Qatar and the United Nations Educational, Scientific and Cultural Organization (UNESCO) have signed a memorandum of understanding (MoU) on Qatar's contribution to the functioning of the UNESCO Regional Office in Doha, and on the financial support provided by Qatar to the UNESCO. HE Dr Mohammed bin Abdul Wahed al Hammadi, Minister of Education and Higher Education, President of the Qatar National Commission for Education, Culture and Science, signed the MoU on behalf of the government of Qatar, while UNESCO Director-General Irina Bokova signed for the Organization. The signing took place during a meeting between the Minister and the Director-General of UNESCO, who is currently visiting the country. During the meeting, they discussed topics on the agenda, including a visit to archaeological and heritage sites in the State of Qatar such as Al Zubarah Archaeological Site which was added by the Organization to the UNESCO World Heritage List. (Qatar Tribune) MDPS: New residency permits of 24,660 issued in January – According to the latest data released by the Ministry of Development Planning and Statistics (MDPS), as many as 24,660 new residency permits (RP) were issued in January 2017 through e-government (Hukoomi) showing an increase by 14.6% compared to the previous month (December 2016), when 21,522 RPs were issued. The number of RPs renewed through the e-government portal during January showed an increase of 10.1% reaching 95,649 from 86,869 in December 2016. However, the number of exit permits processed during January declined by a huge 95.5% compared to the previous month, from 24,227 to just 1,091. This is mainly because the number of people leaving the country to spend New Year holidays significantly increase during December. (Peninsula Qatar) International Surprise fall in Japan January machinery orders raises doubts about recovery – Japan's core machinery orders unexpectedly fell in January from the previous month and dipped the most in five months, adding to worries about whether recent signs of economic recovery will be sustainable. Japanese policymakers hope a recovery in capital spending will help drive growth in the world's third-largest economy and pull it out of deflation and stagnation. Core machinery orders fell 3.2% in January, sharply undershooting the economists' median estimate of a 0.5% increase, Cabinet Office data showed. That followed a rebound in December, when core orders rose 2.1%. While the data series can fluctuate widely, it is regarded as a leading indicator of capital spending in the coming six to nine months. Compared with a year earlier, core orders, which exclude those of ships and electrical equipment, fell 8.2% in January, the biggest fall in eight months and larger than the analyst estimate for a 3.3% decrease. (Reuters) Japan February wholesale prices rise 1.0% YoY – Bank of Japan data showed, Japanese wholesale prices rose 1.0% YoY in February 2017. The rise in the corporate goods price index (CGPI), which measures the price companies charge each other for their goods and services follows a 0.5% annual increase in January. Overall final goods prices, the prices of finished products charged to businesses fell 0.6% from a year earlier.
- 4. Page 4 of 6 Domestic final goods prices, which loosely track the consumer price index, rose 0.3% from a year earlier. (Reuters) China's economy is set for steady growth – The risk of a steep slide in China's economy has reduced, the head of a government research center said on Sunday, adding the country had moved through an L-shaped pattern of slowing to now horizontal growth. China's economy grew 6.7% last year, according to the government, the slowest pace in 26 years. The country met its growth target with support from record bank loans, a speculative housing boom and billions in government investment. But as Beijing moves to cool the housing market, slow new credit and tighten its purse strings, China will have to depend more on domestic consumption and private investment. The government last week trimmed its economic growth target to about 6.5% for this year. Li Wei, the Director of the Development Research Center of the State Council, China's cabinet, said many positive economic signs were emerging domestically and internationally, and the risk of a large slide in economic growth had clearly lowered. China's economic development has gone from a "downward stroke in the L-shape to the horizontal stroke", the official Xinhua news agency said, citing Li's comments on the sidelines of China's annual session of parliament. (Reuters) Regional In GCC region chemical R&D spending reaches $729mn in 2015 – According to a Gulf Petrochemicals & Chemicals Association (GPCA), GCC chemical R&D spending grew by a compound annual growth rate of 20%, reaching $729mn in 2015. In comparison, over the same period, global R&D in the chemicals industry grew at a pace of 3% a year. R&D investment in the region nearly tripled over the past five years, with R&D intensity on par with China. According to the 2016 Global Innovation Index, GCC countries scored within the upper middle range globally. The UAE enjoys the top spot with an overall innovation rank of 41, closely followed by Saudi Arabia, at 49, and Qatar at 50. Dr Abdulwahab al-Sadoun, GPCA Secretary-General said, “As GCC governments intensify their efforts towards diversifying their economies into high value, innovation rich sectors, this region have the potential to increase its ranking further on a global and regional scale.” (Gulf-Times.com) GOIC: Labor forces in GCC manufacturing factories reach 1.6mn in 2015 – According to the Gulf Organization for Industrial Consulting (GOIC), the labor force of manufacturing factories in the Gulf Cooperation Council (GCC) has increased from 774,000 in 2005 to 1.6mn workers in 2015. Growth in labor force, which achieved a 7.8% compound annual growth rate (CAGR), was parallel with the increase in the number of GCC manufacturing factories. Labor plays a key role in industrial production. In fact, they form an added value when coupled with the availability of raw materials. Therefore, labor productivity is seen as a criterion to measure industrial development and the efficient use of the labor force. It also sheds light on the strengths and weaknesses of an industrial activity. (Gulf-Times.com) Saudi Arabia scraps 6,000 'non-beneficial' projects – Saudi Arabia has scrapped nearly 6,000 projects deemed non- beneficial to economic diversification within its ambitious Vision 2030 development scheme. Arabic daily Al-Riyadh quoted Osama Al-Afaleq, Chairman of the Saudi Contractors' Commission said that the number of abandoned projects is not large considering the size of the Kingdom's economy. The government scrapped those projects after studies showed they will not pay off in terms of development and economic growth. (Bloomberg) UAE wants closer trade ties with Asia, Africa – UAE wants to expand trade ties with faster growing nations in Asia and Africa. Rich Gulf Arab states are looking at ways to diversify their economies, including who they trade with, after more than two years of depressed oil prices forced a rethink of government spending. The pace of economic growth in Asian and sub-Saharan African economies has made them ideal partners, Abdullah al-Saleh, undersecretary for foreign trade and industry at the UAE ministry of the economy, told Reuters. Asia's two largest economies China and India are expected to grow by 6.5% and 7.2% in 2017 whilst sub-Saharan Africa is forecast to expand by 2.8%, according to the International Monetary Fund (IMF). There are huge opportunities in China and India but also in Singapore and Indonesia. (Reuters) UAE's Sharjah Islamic Bank says plans convertible Sukuk issue – The UAEs’ Sharjah Islamic Bank (SIB) plans to issue convertible Sukuk equivalent to 10% of the lender's capital. Funds raised through the debt sale will be used by Islamic endowments selected by the government of the Emirate of Sharjah. The bank also authorized a capital increase to AED2.67bn from AED2.43bn. (Reuters) UAE's Mubadala completes deal to take 20% stake in Investcorp's parent – Bahrain-based Investcorp said Abu Dhabi state investment fund Mubadala Development had completed a deal to acquire a 20% stake in the alternative investment firm's parent, Investcorp Bank. Investcorp said in July that Mubadala would buy 9.99% of Investcorp immediately, and a further 10.01% following regulatory approvals, making it the largest shareholder of Investcorp. (Reuters) Dubai’s hospitality market top performer in MENA – Dubai’s hospitality market emerged as the top performer in the Middle East and North Africa (MENA) region in January 2017, representing the highest occupancy at 85.7% and highest RevPAR of $246, over three times the average RevPAR recorded in other cities of the region. Dubai’s beach hotels had the highest RevPAR of $343, while city-based hotels in the Emirate recorded the highest occupancy at 87.6%. Despite the influx of new hotels, Dubai has managed to sustain extremely high occupancy levels YoY. However, average room rates and RevPAR dropped 8.1% and 7.3% percentage points (pp) respectively in January, which could be a result of an oversupply of rooms, encouraging the sector as a whole to lower room rates to remain competitive. In the GCC, all markets except Kuwait recorded lower revenue per average room (RevPAR), reflecting the slowdown in performance witnessed across the wider MENA region. Abu Dhabi’s hospitality market maintained a strong occupancy of 77% in January 2017, but witnessed a decrease in RevPAR and ADR of 11.8% and 10.6% when compared to the period last year. (GulfBase.com) Net foreign investments in Abu Dhabi bourse total $40.3mn in February – Abu Dhabi Securities Exchange, ADX, has announced that foreign investors’ purchases in February 2017
- 5. Page 5 of 6 reached AED2.306bn, representing 44.8% of total trades, whereas their sales stood at AED2.158bn, representing 41.9% of total trades. Subsequently, the net foreign investment in February reached AED148mn, whereas institutional investments in February have reached AED31.8mn. The market capitalization of companies listed in ADX dropped by 0.44% at AED436.465bn compared with AED438.383bn in January. Value of traded stocks in ADX reached AED5.147bn compared with AED7.741bn in January. (Bloomberg) World Bank rankings boost for Bahrain – Bahrain has jumped 69 places in the World Bank’s latest ranking for 2017, thanks to a new commercial freedom legislation that was introduced in September. The country has been ranked 73 compared with the previous standing of 142 on its Easiness to Carry out Business Activities Index. (GulfBase.com)
- 6. Contacts Saugata Sarkar Shahan Keushgerian Zaid al-Nafoosi, CMT, CFTe Head of Research Senior Research Analyst Senior Research Analyst Tel: (+974) 4476 6534 Tel: (+974) 4476 6509 Tel: (+974) 4476 6535 saugata.sarkar@qnbfs.com.qa shahan.keushgerian@qnbfs.com.qa zaid.alnafoosi@qnbfs.com.qa Mohamed Abo Daff QNB Financial Services Co. W.L.L. Senior Research Analyst Contact Center: (+974) 4476 6666 Tel: (+974) 4476 6589 PO Box 24025 mohd.abodaff@qnbfs.com.qa Doha, Qatar Disclaimer and Copyright Notice: This publication has been prepared by QNB Financial Services Co. W.L.L. (“QNBFS”) a wholly-owned subsidiary of Qatar National Bank (Q.P.S.C.). QNBFS is regulated by the Qatar Financial Markets Authority and the Qatar Exchange. Qatar National Bank (Q.P.S.C.) is regulated by the Qatar Central Bank. This publication expresses the views and opinions of QNBFS at a given time only. It is not an offer, promotion or recommendation to buy or sell securities or other investments, nor is it intended to constitute legal, tax, accounting, or financial advice. QNBFS accepts no liability whatsoever for any direct or indirect losses arising from use of this report. Any investment decision should depend on the individual circumstances of the investor and be based on specifically engaged investment advice. We therefore strongly advise potential investors to seek independent professional advice before making any investment decision. Although the information in this report has been obtained from sources that QNBFS believes to be reliable, we have not independently verified such information and it may not be accurate or complete. QNBFS does not make any representations or warranties as to the accuracy and completeness of the information it may contain, and declines any liability in that respect. For reports dealing with Technical Analysis, expressed opinions and/or recommendations may be different or contrary to the opinions/recommendations of QNBFS Fundamental Research as a result of depending solely on the historical technical data (price and volume). QNBFS reserves the right to amend the views and opinions expressed in this publication at any time. It may also express viewpoints or make investment decisions that differ significantly from, or even contradict, the views and opinions included in this report. This report may not be reproduced in whole or in part without permission from QNBFS. COPYRIGHT: No part of this document may be reproduced without the explicit written permission of QNBFS. Page 6 of 6 Rebased Performance Daily Index Performance Source: Bloomberg Source: Bloomberg Source: Bloomberg Source: Bloomberg (*$ adjusted returns) 80.0 100.0 120.0 140.0 160.0 180.0 Feb-13 Feb-14 Feb-15 Feb-16 Feb-17 QSE Index S&P Pan Arab S&P GCC (1.2%) 0.2% 0.5% 0.9% (0.9%) (0.5%) (1.1%)(1.5%) (1.0%) (0.5%) 0.0% 0.5% 1.0% SaudiArabia Qatar Kuwait Bahrain Oman AbuDhabi Dubai Asset/Currency Performance Close ($) 1D% WTD% YTD% Global Indices Performance Close 1D%* WTD%* YTD%* Gold/Ounce 1,204.73 0.3 (2.4) 4.6 MSCI World Index 1,845.88 0.5 (0.2) 5.4 Silver/Ounce 17.04 0.5 (5.2) 7.1 DJ Industrial 20,902.98 0.2 (0.5) 5.8 Crude Oil (Brent)/Barrel (FM Future) 51.37 (1.6) (8.1) (9.6) S&P 500 2,372.60 0.3 (0.4) 6.0 Crude Oil (WTI)/Barrel (FM Future) 48.49 (1.6) (9.1) (9.7) NASDAQ 100 5,861.73 0.4 (0.2) 8.9 Natural Gas (Henry Hub)/MMBtu 2.98 5.4 19.1 (19.0) STOXX 600 373.23 0.9 0.5 4.5 LPG Propane (Arab Gulf)/Ton 66.12 0.9 8.0 (8.3) DAX 11,963.18 0.7 0.5 5.4 LPG Butane (Arab Gulf)/Ton 68.12 (2.2) 0.5 (41.7) FTSE 100 7,343.08 0.4 (1.1) 1.3 Euro 1.07 0.9 0.5 1.5 CAC 40 4,993.32 1.1 1.0 3.9 Yen 114.79 (0.1) 0.7 (1.9) Nikkei 19,604.61 1.4 0.3 4.2 GBP 1.22 0.0 (1.0) (1.4) MSCI EM 926.14 0.3 (0.5) 7.4 CHF 0.99 0.1 (0.3) 0.8 SHANGHAI SE Composite 3,212.76 (0.0) (0.2) 4.1 AUD 0.75 0.5 (0.7) 4.6 HANG SENG 23,568.67 0.3 0.1 7.0 USD Index 101.25 (0.6) (0.3) (0.9) BSE SENSEX 28,946.23 0.2 0.7 11.0 RUB 58.98 (0.5) 1.3 (4.2) Bovespa 64,675.46 1.0 (3.6) 10.8 BRL 0.32 1.7 (0.7) 3.6 RTS 1,055.93 0.9 (4.7) (8.4) 120.2 100.1 98.6