Molecular insight into Gene Expression Using Digital RNAseq: Digital RNAseq Webinar Part 3
•
2 gostaram•1,083 visualizações

Gene expression profiling is the key to understanding biological pathways and complex cellular systems. In this webinar we will discuss the challenges of targeted RNA-seq data analysis and present the solutions provided by the QIAGEN automated online data analysis tools. Using raw sequencing data from targeted sequencing, the output of the QIAseq primary data analysis tool and the options in QIAseq secondary analysis, such as normalization strategies, will be described. The use of Ingenuity Pathway Analysis (IPA) to unlock the molecular insights buried in experimental data by quickly identifying relationships, mechanisms, functions, and pathways of relevance will be shown with an example.

Recomendados
Recomendados
Mais conteúdo relacionado
Mais procurados
Mais procurados (20)
Destaque
Destaque (18)
Semelhante a Molecular insight into Gene Expression Using Digital RNAseq: Digital RNAseq Webinar Part 3
Semelhante a Molecular insight into Gene Expression Using Digital RNAseq: Digital RNAseq Webinar Part 3 (20)
Mais de QIAGEN
Mais de QIAGEN (20)
Último
Último (20)
Molecular insight into Gene Expression Using Digital RNAseq: Digital RNAseq Webinar Part 3
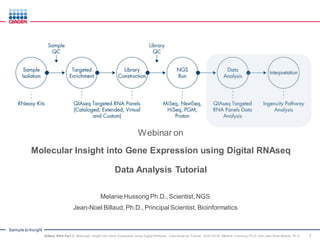
- 1. Sample to Insight Molecular Insight into Gene Expression using Digital RNAseq Data Analysis Tutorial Melanie Hussong Ph.D., Scientist, NGS Jean-Noel Billaud, Ph.D., Principal Scientist, Bioinformatics 1 Webinar on QIAseq RNA Part 3: Molecular Insight into Gene Expression using Digital RNAseq: Data Analy sis Tutorial, 03/01/2016, Melanie Hussong, Ph.D. and Jean-Noel Billaud, Ph.D.
- 2. Sample to Insight Welcome to 3 part webinar series on Digital RNAsequencing Digital RNA sequencing for accurate gene expression profiling Part 1: What is digital RNAseq? Speaker: Eric Lader, Ph.D. Senior Director, Research & Development, QIAGEN Date: Feb 17th, 1 pm EST, 10 am PST, 6 pm GMT Part 2: Digital RNAseq for gene expression profiling Speaker: Raed Samara, Ph.D. Global Product Manager, NGS, QIAGEN Date: Feb 24th, 1 pm EST, 10 am PST, 6 pm GMT Part 3: Molecular Insight into gene expression profiling using digital RNAseq: data analysis tutorial Speaker: Melanie Hussong, Ph.D. Scientist, NGS Jean-Noel Billaud, Ph.D. Principal Scientist. Bioinformatics Date: March 1st, 1 pm EST, 10 am PST, 6 pm GMT
- 3. Sample to Insight Molecular Insight into Gene Expression using Digital RNAseq: Data Analysis Tutorial Melanie Hussong, Ph.D. and Jean-Noel Billaud, Ph.D. QIAseq RNA Part 3: Molecular Insight into Gene Expression using Digital RNAseq: Data Analy sis Tutorial, 03/01/2016, Melanie Hussong, Ph.D. and Jean-Noel Billaud, Ph.D. 3
- 4. Sample to Insight Today’s Agenda 4 Why use Targeted Next Generation Sequencing (NGS) to study gene expression? Targeted Enrichment • QIAseq Targeted RNA Panels QIAseq Primary Data Analysis • Read Mapping • Molecular Barcode Counting QIAseq Expression Analysis • Workflow • Interface • Data Interpretation: Ingenuity Pathway Analysis (IPA) QIAseq RNA Part 3: Molecular Insight into Gene Expression using Digital RNAseq: Data Analy sis Tutorial, 03/01/2016, Melanie Hussong, Ph.D. and Jean-Noel Billaud, Ph.D.
- 5. Sample to Insight Outline of a RNAseq Experiment 5 Want to Study Gene Expression? For example: • Have 96 samples • Investigate 500 genes • Only have a limited amount of total RNA • Budget per sample is $100 QIAseq RNA Part 3: Molecular Insight into Gene Expression using Digital RNAseq: Data Analy sis Tutorial, 03/01/2016, Melanie Hussong, Ph.D. and Jean-Noel Billaud, Ph.D.
- 6. Sample to Insight Gene Expression Profiling 6 PCR-based Accuracy Limited sample & assay throughput Requires a lot of RNA Whole transcriptome sequencing (WTS) Throughput power Expensive Complex data Microarrays Easy data analysis High background noise Requires a lot of RNA Limited dynamic range Traditional targeted RNA sequencing Manageable data Low per-sample cost Amplification bias QIAseq RNA Part 3: Molecular Insight into Gene Expression using Digital RNAseq: Data Analy sis Tutorial, 03/01/2016, Melanie Hussong, Ph.D. and Jean-Noel Billaud, Ph.D.
- 7. Sample to Insight QIAseq Targeted RNA: High Throughput Digital NGS 7 Simple to use, complex behind the scenes • Complete, Integrated System: Sample to Insight o Sensitive and highly specific o Extremely flexible in experimental design (n samples x n assays) o Simple for end user to address bioinformatically o Requires no rRNA depletion or blocking or dT selection o Makes best use of limited NGS read budget o Flexible content – Leverages QIAGEN’s content know-how – Disease and pathway focused panels – Ready to use, easy to modify, and fully custom panel content all in one kit • When? Who? Why? • Scientists with known gene list or pathway • Follow up on broader experiments, such as WTS or microarray QIAseq RNA Part 3: Molecular Insight into Gene Expression using Digital RNAseq: Data Analy sis Tutorial, 03/01/2016, Melanie Hussong, Ph.D. and Jean-Noel Billaud, Ph.D.
- 8. Sample to Insight RNA Extraction Synthesize cDNA Library Construction Library Quantification Sequencing Run Data Analysis Data Interpretation Ingenuity Pathway Analysis (IPA) Molecular Barcode Assignment Purification Gene Specific PCR Purification Target Enrichment and Index Assignment Purification MiSeq NextSeq Ion Torrent Platform Agnostic Primary Analysis for MT count QIAseq RNA Quantification Portal Secondary Analysis for Normalization Sample Insight QIAseq Targeted RNA Workflow: from Sample to Insight 8QIAseq RNA Part 3: Molecular Insight into Gene Expression using Digital RNAseq: Data Analy sis Tutorial, 03/01/2016, Melanie Hussong, Ph.D. and Jean-Noel Billaud, Ph.D.
- 9. Sample to Insight GSP1 GSP2 MT FS2 RS2 RS2 Adaptor and Index Reverse gene-specific primer QIAseq Targeted RNA Library Construction Schematic 9 MT: 12-base unique barcode GSP1, GSP2: Gene-specific primers RS2, FS2: Universal PCR primers RNA Sample cDNA Synthesis Primer Extension and Molecular Barcoding Double QIAseq Bead Cleanup 1st Stage PCR 2nd Stage PCR library construction and sample indexing Library Quantification QIAseq Bead Cleanup QIAseq Bead Cleanup 6 Hours Adaptor and Index GSP1 and GSP2 never see each other, thereby minimizing primer dimers Molecular Barcoded forward gene-specific primer QIAseq RNA Part 3: Molecular Insight into Gene Expression using Digital RNAseq: Data Analy sis Tutorial, 03/01/2016, Melanie Hussong, Ph.D. and Jean-Noel Billaud, Ph.D.
- 10. Sample to Insight QIAseq Targeted RNA Panels 10 • Cancer Transcriptome (411) • Inflammation & Immunity Transcriptome (491) • Signal Transduction PathwayFinder (421) • Stem Cell & Differentiation Markers (309) • Molecular Toxicology Transcriptome (386) • Angiogenesis & Endothelial Cell Biology (356) • Apoptosis & Cell Death (280) • Extracellular Matrix & Cell Adhesion Molecules (437) QIAseq RNA Part 3: Molecular Insight into Gene Expression using Digital RNAseq: Data Analy sis Tutorial, 03/01/2016, Melanie Hussong, Ph.D. and Jean-Noel Billaud, Ph.D.
- 11. Sample to Insight QIAseq Targeted RNA Data Primary Analysis Web Portal QIAseq RNA Part 3: Molecular Insight into Gene Expression using Digital RNAseq: Data Analy sis Tutorial, 03/01/2016, Melanie Hussong, Ph.D. and Jean-Noel Billaud, Ph.D. 11 • FREE Complete and Easy to use Data Analysis with Web-based Software can be found at: ngsdataanalysis.sabiosciences.com/NGSRNA/
- 12. Sample to Insight QIAseq Targeted RNA Data Analysis Upload Files Interface 12 • .fastq or fastq.gz files (Illumina Platforms) • .bam files (Ion Torrent) • File Upload Tab QIAseq RNA Part 3: Molecular Insight into Gene Expression using Digital RNAseq: Data Analy sis Tutorial, 03/01/2016, Melanie Hussong, Ph.D. and Jean-Noel Billaud, Ph.D.
- 13. Sample to Insight QIAseq Targeted RNA Data Analysis File Management Interface QIAseq RNA Part 3: Molecular Insight into Gene Expression using Digital RNAseq: Data Analy sis Tutorial, 03/01/2016, Melanie Hussong, Ph.D. and Jean-Noel Billaud, Ph.D. 13 • File Management Tab • Delete/Manage Files
- 14. Sample to Insight QIAseq Targeted RNA Data Analysis RNA Quantification Interface QIAseq RNA Part 3: Molecular Insight into Gene Expression using Digital RNAseq: Data Analy sis Tutorial, 03/01/2016, Melanie Hussong, Ph.D. and Jean-Noel Billaud, Ph.D. 14 ■ RNA Quantification Tab • Submit Runs for Analysis • View and download Output Files
- 15. Sample to Insight QIAseq Targeted RNA Data Analysis Quantification Interface QIAseq RNA Part 3: Molecular Insight into Gene Expression using Digital RNAseq: Data Analy sis Tutorial, 03/01/2016, Melanie Hussong, Ph.D. and Jean-Noel Billaud, Ph.D. 15 • RNA Quantification Jobs Tab
- 16. Sample to Insight QIAseq Targeted RNA Data Analysis Quantification Interface QIAseq RNA Part 3: Molecular Insight into Gene Expression using Digital RNAseq: Data Analy sis Tutorial, 03/01/2016, Melanie Hussong, Ph.D. and Jean-Noel Billaud, Ph.D. 16 • RNA Quantification Jobs Tab • Select the appropriate Catalog Or Custom Catalog Number
- 17. Sample to Insight QIAseq Targeted RNA Data Analysis Quantification Interface QIAseq RNA Part 3: Molecular Insight into Gene Expression using Digital RNAseq: Data Analy sis Tutorial, 03/01/2016, Melanie Hussong, Ph.D. and Jean-Noel Billaud, Ph.D. 17 • RNA Quantification Jobs Tab • Select Sample Files to be analyzed
- 18. Sample to Insight QIAseq Targeted RNA Data Analysis Quantification Interface QIAseq RNA Part 3: Molecular Insight into Gene Expression using Digital RNAseq: Data Analy sis Tutorial, 03/01/2016, Melanie Hussong, Ph.D. and Jean-Noel Billaud, Ph.D. 18 • RNA Quantification Jobs Tab • File Lanes 1 for MiSeq/HiSeq and Ion Torrent • File Lanes 4 for NextSeq
- 19. Sample to Insight QIAseq Targeted RNA Data Analysis Quantification Interface QIAseq RNA Part 3: Molecular Insight into Gene Expression using Digital RNAseq: Data Analy sis Tutorial, 03/01/2016, Melanie Hussong, Ph.D. and Jean-Noel Billaud, Ph.D. 19 • RNA Quantification Jobs Tab
- 20. Sample to Insight Data Analysis for QIAseq Targeted RNA Sequencing QIAseq RNA Part 3: Molecular Insight into Gene Expression using Digital RNAseq: Data Analy sis Tutorial, 03/01/2016, Melanie Hussong, Ph.D. and Jean-Noel Billaud, Ph.D. 20 QIAseq Targeted RNA Data Analysis workflow • Adaptor Trimming o Remove the adaptor sequences from the reads • Read Mapping o Identify the possible position of the read within the reference o Align the read sequence to reference sequences • Molecular Barcode Counting o Merges unique barcodes with mapped reads Adaptor Trimming Read Mapping Molecular Barcode Count (Primary Analysis)
- 21. Sample to Insight Read Mapping 21 Adaptor Trimming and Alignment of Reads to the Reference Genome • Trim universal PCR adaptor sequences off the 3’ end of reads. • Reads that are less than 55 bp in length after adapter trimming are likely oligo dimers and are dropped. • The first 12 bp are removed from each read as they are the Molecular Tag (MT) sequence. o Append the MT sequence to the read identifier. • Using STAR RNA read mapper, reads are aligned to GRCh38 reference genome. o STAR uses Gencode transcript models to aid in aligning reads that cross introns. o Reads that do not map well are dropped. QIAseq RNA Part 3: Molecular Insight into Gene Expression using Digital RNAseq: Data Analy sis Tutorial, 03/01/2016, Melanie Hussong, Ph.D. and Jean-Noel Billaud, Ph.D.
- 22. Sample to Insight Process Read Alignments 22 Process Read Alignments • At least 60 bp of the reads must align otherwise the reads are dropped. o As most oligos are less than 30 bp, this ensures that at least 30 bp of the endogenous RNA sequence is present in the read. • Drop reads that are generated by off-target or unintended priming by identifying the 5’ primer at the start of the read. • If the genome alignment at the primer start site is not very good then these reads are dropped as the boundary between the MT region and the primer region of the read is ambiguous. Hence dropping these reads improves MT counting accuracy. QIAseq RNA Part 3: Molecular Insight into Gene Expression using Digital RNAseq: Data Analy sis Tutorial, 03/01/2016, Melanie Hussong, Ph.D. and Jean-Noel Billaud, Ph.D.
- 23. Sample to Insight Count MolecularTags 23 Count Molecular Tags • For each amplicon, cluster together the 12 bp read sequences from the MT region that have low edit distance from each other. Reads in a cluster putatively originated from the same MT priming event. • All of the above reads have the same MT ( ) although there are five replicates of one Transcript they have a MT Count of one. • All of the above reads have different MTs and are five unique MTs for one transcript they have a MT Count of five. Five replicates of one transcript MT = 1 Five unique transcripts of a gene MT = 5 QIAseq RNA Part 3: Molecular Insight into Gene Expression using Digital RNAseq: Data Analy sis Tutorial, 03/01/2016, Melanie Hussong, Ph.D. and Jean-Noel Billaud, Ph.D.
- 24. Sample to Insight QIAseq Targeted RNA Data Analysis Quantification Interface QIAseq RNA Part 3: Molecular Insight into Gene Expression using Digital RNAseq: Data Analy sis Tutorial, 03/01/2016, Melanie Hussong, Ph.D. and Jean-Noel Billaud, Ph.D. 24 • RNA Quantification Jobs Tab Job Status
- 25. Sample to Insight QIAseq Primary Data Analysis Output QIAseq RNA Part 3: Molecular Insight into Gene Expression using Digital RNAseq: Data Analy sis Tutorial, 03/01/2016, Melanie Hussong, Ph.D. and Jean-Noel Billaud, Ph.D. 25 • Features of the Primary Analysis Molecular Tag Report Summary Tab
- 26. Sample to Insight QIAseq Primary Data Analysis Output QIAseq RNA Part 3: Molecular Insight into Gene Expression using Digital RNAseq: Data Analy sis Tutorial, 03/01/2016, Melanie Hussong, Ph.D. and Jean-Noel Billaud, Ph.D. 26 • Features of the Primary Analysis Molecular Tag Report Summary Tab
- 27. Sample to Insight QIAseq Primary Data Analysis Output QIAseq RNA Part 3: Molecular Insight into Gene Expression using Digital RNAseq: Data Analy sis Tutorial, 03/01/2016, Melanie Hussong, Ph.D. and Jean-Noel Billaud, Ph.D. 27 • Features of the Primary Analysis Molecular Tag Report Summary Tab
- 28. Sample to Insight QIAseq Primary Data Analysis Output QIAseq RNA Part 3: Molecular Insight into Gene Expression using Digital RNAseq: Data Analy sis Tutorial, 03/01/2016, Melanie Hussong, Ph.D. and Jean-Noel Billaud, Ph.D. 28 • Features of the Primary Analysis Molecular Tag Report Summary Tab
- 29. Sample to Insight QIAseq Primary Data Analysis Output QIAseq RNA Part 3: Molecular Insight into Gene Expression using Digital RNAseq: Data Analy sis Tutorial, 03/01/2016, Melanie Hussong, Ph.D. and Jean-Noel Billaud, Ph.D. 29 • Features of the Primary Analysis Molecular Tag Report Summary Tab
- 30. Sample to Insight Read Details: Unique Captures per Target Gene Count 30 Sample by Sample, Gene by Gene Unique Barcode Counts (and Total) QIAseq RNA Part 3: Molecular Insight into Gene Expression using Digital RNAseq: Data Analy sis Tutorial, 03/01/2016, Melanie Hussong, Ph.D. and Jean-Noel Billaud, Ph.D.
- 31. Sample to Insight Read Details: Unique Captures per Target Gene Count 31 Sample by Sample, Gene by Gene Unique Barcode Counts (and Total) QIAseq RNA Part 3: Molecular Insight into Gene Expression using Digital RNAseq: Data Analy sis Tutorial, 03/01/2016, Melanie Hussong, Ph.D. and Jean-Noel Billaud, Ph.D. Differential gene expression can be seen inter- and intra- samples
- 32. Sample to Insight Read Details: Unique Captures per Target Gene Count 32 gDNA Control Amplicons QIAseq RNA Part 3: Molecular Insight into Gene Expression using Digital RNAseq: Data Analy sis Tutorial, 03/01/2016, Melanie Hussong, Ph.D. and Jean-Noel Billaud, Ph.D.
- 33. Sample to Insight Read Details: Unique Captures per Target Gene Count 33 Housekeeping Reference Genes Amplicons QIAseq RNA Part 3: Molecular Insight into Gene Expression using Digital RNAseq: Data Analy sis Tutorial, 03/01/2016, Melanie Hussong, Ph.D. and Jean-Noel Billaud, Ph.D.
- 34. Sample to Insight QIAseq Targeted RNA Secondary Data Analysis Setup QIAseq RNA Part 3: Molecular Insight into Gene Expression using Digital RNAseq: Data Analy sis Tutorial, 03/01/2016, Melanie Hussong, Ph.D. and Jean-Noel Billaud, Ph.D. 34 • Found in the GeneGlobe Data Analysis Center • Upload Data
- 35. Sample to Insight QIAseq Targeted RNA Secondary Data Analysis Setup QIAseq RNA Part 3: Molecular Insight into Gene Expression using Digital RNAseq: Data Analy sis Tutorial, 03/01/2016, Melanie Hussong, Ph.D. and Jean-Noel Billaud, Ph.D. 35 • Analysis Setup Uploaded Data
- 36. Sample to Insight QIAseq Targeted RNA Secondary Data Analysis Setup 36 • Analysis Setup Sample Manager QIAseq RNA Part 3: Molecular Insight into Gene Expression using Digital RNAseq: Data Analy sis Tutorial, 03/01/2016, Melanie Hussong, Ph.D. and Jean-Noel Billaud, Ph.D.
- 37. Sample to Insight QIAseq Targeted RNA Secondary Data Analysis Setup QIAseq RNA Part 3: Molecular Insight into Gene Expression using Digital RNAseq: Data Analy sis Tutorial, 03/01/2016, Melanie Hussong, Ph.D. and Jean-Noel Billaud, Ph.D. 37 • Analysis Setup Data QC
- 38. Sample to Insight Secondary Data Analysis: Normalization Against 38 • Unique barcodes/total unique barcodes per sample This method simply uses the sum of the molecular tag counts in each sample as the normalization factor. However, it assumes that equal amounts of RNA were used in the analysis and that a majority of the genes are expressed at a relatively stable level across the Samples. • Housekeeping genes (one, some, all) Housekeeping genes are ranked as most stable to least stably expressed. Housekeeping genes stability ranking is based on GeNorm calculations. Genes that have a stability factor of less than 1.5 are considered to be stably expressed. • Genes of your choice Calculate - fold change, p-values, generate heat maps, volcano plots QIAseq RNA Part 3: Molecular Insight into Gene Expression using Digital RNAseq: Data Analy sis Tutorial, 03/01/2016, Melanie Hussong, Ph.D. and Jean-Noel Billaud, Ph.D.
- 39. Sample to Insight QIAseq Targeted RNA Secondary Data Analysis Setup QIAseq RNA Part 3: Molecular Insight into Gene Expression using Digital RNAseq: Data Analy sis Tutorial, 03/01/2016, Melanie Hussong, Ph.D. and Jean-Noel Billaud, Ph.D. 39 • Analysis Setup Select Normalization Method – Total Molecular Tags
- 40. Sample to Insight QIAseq Targeted RNA Secondary Data Analysis Setup QIAseq RNA Part 3: Molecular Insight into Gene Expression using Digital RNAseq: Data Analy sis Tutorial, 03/01/2016, Melanie Hussong, Ph.D. and Jean-Noel Billaud, Ph.D. 40 • Analysis Setup Select Normalization Method – Housekeeping Genes
- 41. Sample to Insight QIAseq Targeted RNA Secondary Data Analysis QIAseq RNA Part 3: Molecular Insight into Gene Expression using Digital RNAseq: Data Analy sis Tutorial, 03/01/2016, Melanie Hussong, Ph.D. and Jean-Noel Billaud, Ph.D. 41 • Analysis
- 42. Sample to Insight QIAseq Targeted RNA Secondary Data Analysis Plots and Charts QIAseq RNA Part 3: Molecular Insight into Gene Expression using Digital RNAseq: Data Analy sis Tutorial, 03/01/2016, Melanie Hussong, Ph.D. and Jean-Noel Billaud, Ph.D. 42 • Plots and Charts
- 43. Sample to Insight QIAseq Targeted RNA Secondary Data Analysis Scatter Plot QIAseq RNA Part 3: Molecular Insight into Gene Expression using Digital RNAseq: Data Analy sis Tutorial, 03/01/2016, Melanie Hussong, Ph.D. and Jean-Noel Billaud, Ph.D. 43
- 44. Sample to Insight QIAseq Targeted RNA Secondary Data Analysis Volcano Plot QIAseq RNA Part 3: Molecular Insight into Gene Expression using Digital RNAseq: Data Analy sis Tutorial, 03/01/2016, Melanie Hussong, Ph.D. and Jean-Noel Billaud, Ph.D. 44
- 45. Sample to Insight QIAseq Targeted RNA Secondary Data Analysis Clustergram 45QIAseq RNA Part 3: Molecular Insight into Gene Expression using Digital RNAseq: Data Analy sis Tutorial, 03/01/2016, Melanie Hussong, Ph.D. and Jean-Noel Billaud, Ph.D.
- 46. Sample to Insight QIAseq Targeted RNA Secondary Data Analysis Export Data QIAseq RNA Part 3: Molecular Insight into Gene Expression using Digital RNAseq: Data Analy sis Tutorial, 03/01/2016, Melanie Hussong, Ph.D. and Jean-Noel Billaud, Ph.D. 46 • Export Data
- 47. Sample to Insight QIAseq Targeted RNA Secondary Data Analysis Export Data QIAseq RNA Part 3: Molecular Insight into Gene Expression using Digital RNAseq: Data Analy sis Tutorial, 03/01/2016, Melanie Hussong, Ph.D. and Jean-Noel Billaud, Ph.D. 47 • Gene Table Tab
- 48. Sample to Insight QIAseq Targeted RNA Secondary Data Analysis Export Data QIAseq RNA Part 3: Molecular Insight into Gene Expression using Digital RNAseq: Data Analy sis Tutorial, 03/01/2016, Melanie Hussong, Ph.D. and Jean-Noel Billaud, Ph.D. 48 • Fold Changes and p-value Tab
- 49. Sample to Insight QIAseq Targeted RNA Secondary Data Analysis Export Data QIAseq RNA Part 3: Molecular Insight into Gene Expression using Digital RNAseq: Data Analy sis Tutorial, 03/01/2016, Melanie Hussong, Ph.D. and Jean-Noel Billaud, Ph.D. 49 • Fold Regulation and p-value Tab
- 50. Sample to Insight QIAseq Targeted RNA Secondary Data Analysis Export Data 50 • IPA Upload Tab ■ Biological Interpretation Using IPA QIAseq RNA Part 3: Molecular Insight into Gene Expression using Digital RNAseq: Data Analy sis Tutorial, 03/01/2016, Melanie Hussong, Ph.D. and Jean-Noel Billaud, Ph.D.
- 51. Sample to Insight QIASeq Targeted RNA Panel: Sample to Insight workflow 51 Integrated library preparation Works with any RNA sample type Compatible with most sequencers Complementary data analysis tool for fold change analysis QIAseq RNA Part 3: Molecular Insight into Gene Expression using Digital RNAseq: Data Analy sis Tutorial, 03/01/2016, Melanie Hussong, Ph.D. and Jean-Noel Billaud, Ph.D.
- 52. Sample to Insight The QIAGEN Knowledge Base: Content & Content-aware Analytics 52 • Cancer Scoring • Hereditary Disease Scoring • Causal Network Analysis • Druggable Pathways • Disease Model-based Analysis QIAseq RNA Part 3: Molecular Insight into Gene Expression using Digital RNAseq: Data Analy sis Tutorial, 03/01/2016, Melanie Hussong, Ph.D. and Jean-Noel Billaud, Ph.D.
- 53. Sample to Insight Introduction to Ingenuity Pathway Analysis (IPA), Interpretation 53 Gene View, Chem View, and Disease/Function View Human and Mouse Isoform Views Canonical Pathways/Molecule Activity Predictor Upstream Analysis Upstream Regulators/Mechanistic Network/Causal Networks Diseases & Functions Downstream Effects Analysis Regulator Effects microRNA Target Filter BioProfiler Interaction Networks, Build and Overlay tools IsoProfiler My Findings QIAseq RNA Part 3: Molecular Insight into Gene Expression using Digital RNAseq: Data Analy sis Tutorial, 03/01/2016, Melanie Hussong, Ph.D. and Jean-Noel Billaud, Ph.D.
- 54. Sample to Insight Biological Interpretation of Breast Cancer (using 2 breast cancer cell lines) 54 BT-549 and MDA-MD-231 Breast cancer cell lines • Understanding the transcriptome in these cell lines when TOB1 is knockdown by siRNA o What are the signaling or metabolic pathways involved, are they activated/inhibited? (Canonical Pathways) o What are the underlying transcriptional programs? (UpstreamAnalysis) o What biological processes are involved and in what way? (Diseases & Functions) o Identify Isoforms differentially expressedconnectedto cancer (IsoProfiler) o What hypotheses can be drawn further? (Mechanistic Network, Causal Network, Regulator Effects) QIAseq RNA Part 3: Molecular Insight into Gene Expression using Digital RNAseq: Data Analy sis Tutorial, 03/01/2016, Melanie Hussong, Ph.D. and Jean-Noel Billaud, Ph.D.
- 55. Sample to Insight QIAseq RNA Panels: 2 Breast cancer cell lines 55 Upload the 254 QIAseq RNA panel dataset QIAseq RNA Part 3: Molecular Insight into Gene Expression using Digital RNAseq: Data Analy sis Tutorial, 03/01/2016, Melanie Hussong, Ph.D. and Jean-Noel Billaud, Ph.D.
- 56. Sample to Insight IPA: Analysis of QIAseq RNA panel of 2 Breast Cancer cell lines 56QIAseq RNA Part 3: Molecular Insight into Gene Expression using Digital RNAseq: Data Analy sis Tutorial, 03/01/2016, Melanie Hussong, Ph.D. and Jean-Noel Billaud, Ph.D.
- 57. Sample to Insight Canonical Pathways (CP) in BT-549 cell line 57 Understanding which Canonical Pathways (overlap) are involved and determining the predicted activity of this CP (Pathway Activity Analysis) QIAseq RNA Part 3: Molecular Insight into Gene Expression using Digital RNAseq: Data Analy sis Tutorial, 03/01/2016, Melanie Hussong, Ph.D. and Jean-Noel Billaud, Ph.D.
- 58. Sample to Insight PathwayActivity Analysis in BT-549 cell line 58 Cell Cycle G1/S Checkpoint Regulation is predicted to be inhibited (Z-score negative) QIAseq RNA Part 3: Molecular Insight into Gene Expression using Digital RNAseq: Data Analy sis Tutorial, 03/01/2016, Melanie Hussong, Ph.D. and Jean-Noel Billaud, Ph.D.
- 59. Sample to Insight Upstream Analysis in MDA-MB-231 cell line 59 Determining which transcriptional program is involved and in what way QIAseq RNA Part 3: Molecular Insight into Gene Expression using Digital RNAseq: Data Analy sis Tutorial, 03/01/2016, Melanie Hussong, Ph.D. and Jean-Noel Billaud, Ph.D.
- 60. Sample to Insight TP53-driven network in MDA-MD-231 cell line 60 TP53 is predicted to be activated when TOB1 siRNA is added QIAseq RNA Part 3: Molecular Insight into Gene Expression using Digital RNAseq: Data Analy sis Tutorial, 03/01/2016, Melanie Hussong, Ph.D. and Jean-Noel Billaud, Ph.D.
- 61. Sample to Insight TP53-driven network in MDA-MD-231 cell line 61 Overlay statistically significant diseases and functions Apoptosis Proliferation of cells QIAseq RNA Part 3: Molecular Insight into Gene Expression using Digital RNAseq: Data Analy sis Tutorial, 03/01/2016, Melanie Hussong, Ph.D. and Jean-Noel Billaud, Ph.D.
- 62. Sample to Insight CTNNB1-driven Mechanistic Network in MDA-MB-231 62 CTNNB1 is predicted to be activated and drives a Mechanistic Network along with 18 other regulators. This Network may explain the pattern of expression of 38 targets downstream (not shown here). QIAseq RNA Part 3: Molecular Insight into Gene Expression using Digital RNAseq: Data Analy sis Tutorial, 03/01/2016, Melanie Hussong, Ph.D. and Jean-Noel Billaud, Ph.D.
- 63. Sample to Insight Downstream Effect Analysis of MDA-MD-231 cell line 63 Apoptosis of tumor cell lines is predicted to be activated Apoptosis of tumor cell lines QIAseq RNA Part 3: Molecular Insight into Gene Expression using Digital RNAseq: Data Analy sis Tutorial, 03/01/2016, Melanie Hussong, Ph.D. and Jean-Noel Billaud, Ph.D.
- 64. Sample to Insight TCEB3 driven Causal Network in MDA-MB-231 64 TCEB3 Causal Network is predicted to be activated and to increase “Invasion of Cells” QIAseq RNA Part 3: Molecular Insight into Gene Expression using Digital RNAseq: Data Analy sis Tutorial, 03/01/2016, Melanie Hussong, Ph.D. and Jean-Noel Billaud, Ph.D.
- 65. Sample to Insight Regulator Effects in MDA-MB-231 65 Connecting the transcriptional program and the biological processes involved together via the targets in the dataset Upstream Regulators Targets Downstream Diseases and Functions QIAseq RNA Part 3: Molecular Insight into Gene Expression using Digital RNAseq: Data Analy sis Tutorial, 03/01/2016, Melanie Hussong, Ph.D. and Jean-Noel Billaud, Ph.D.
- 66. Sample to Insight IsoProfiler in IPA to discover isoforms that may drive tumor progression 66 Some VEGF isoforms are identified in the datasets that are specifically connected to EEC QIAseq RNA Part 3: Molecular Insight into Gene Expression using Digital RNAseq: Data Analy sis Tutorial, 03/01/2016, Melanie Hussong, Ph.D. and Jean-Noel Billaud, Ph.D.
- 67. Sample to Insight Using QIAGEN BioinformaticsApproach 67 • Using IPA, we have been able to: o Visualize the differentially expressed genes in the 2 breast cancer cell lines with TOB1 siRNA o Understand which signaling pathways are involved in tumor progression in these cell lines o Discover potential transcriptional program(s) that are induced or repressed in these BrCa cell lines treated with TOB1 siRNA o Discover specific biological processes that participate in the tumor progression o Identify Isoforms differentially expressed connected to EEC o Highlight new hypotheses (ready to be tested and validated) that could explain cell invasion QIAseq RNA Part 3: Molecular Insight into Gene Expression using Digital RNAseq: Data Analy sis Tutorial, 03/01/2016, Melanie Hussong, Ph.D. and Jean-Noel Billaud, Ph.D.
- 68. Sample to Insight 68 Jean-Noel Billaud, Ph.D. Principal Scientist. Bioinformatics Melanie Hussong, Ph.D. Scientist, NGS QIAseq RNA Part 3: Molecular Insight into Gene Expression using Digital RNAseq: Data Analy sis Tutorial, 03/01/2016, Melanie Hussong, Ph.D. and Jean-Noel Billaud, Ph.D.
- 69. Sample to Insight 69QIAseq RNA Part 3: Molecular Insight into Gene Expression using Digital RNAseq: Data Analy sis Tutorial, 03/01/2016, Melanie Hussong, Ph.D. and Jean-Noel Billaud, Ph.D.
- 70. Sample to Insight 70QIAseq RNA Part 3: Molecular Insight into Gene Expression using Digital RNAseq: Data Analy sis Tutorial, 03/01/2016, Melanie Hussong, Ph.D. and Jean-Noel Billaud, Ph.D.
Notas do Editor
- Dr. so and so did a …. Found a … follow up with NGS on…. Gene Expression profiling is central to many biological process such as: Immune profiling, Cell Cycle Research, Cancer Research, Biomarker development.
- It is an open the box and use integrated system that counts reads and how many original molecules / original RNAs you have. It is engineered to produce results that are both accurate and precise. We can guide you if need be in experimental design and number of samples etc… QIAGEN has been developing panels for years that are diseased and pathway focused that have leveraged External databases and papers and been curated by PhDs. Scientist know what genes they are interested in. For example genes in cancer, differentiation, development, immunity or signal transduction you as a research already have these in mind.
- The only sample-to-insight digital RNAseq solution for unbiased gene expression profiling using NGS. Integrated library preparation Works with any RNA sample type Amplicons are short so it is compatible with FFPE (on average about 97 bp) Compatible with most sequencers Single read Complementary data analysis tool for fold change analysis Easy enough for first time NGS users
- 1st Strand cDNA Synthesis Random hexamers and oligo-dT primed. Everything needed to go from RNA to a Sequence Ready Library in one kit in one day. MT consisting of 12 random bases, therefore providing 412 = 16777216 unique molecular tags for each BC primer The gene specific primers are never in the same reaction which minimizes primer dimers. Schematic – Notice we never do highly multiplex PCR with both 5’ and 3’ primers. Limited number of gene specific extensions, then universal PCR and sample indexing. Amplicons rigorously restricted in size and Tm to make this extremely uniform.
- 170+ pathway and disease focused panels for humans (84 gene panels) Make a Custom Panel by selecting from over 500 pathway maps. Customize the content to address your research questions.
- Shows the total reads per sample
- Shows the primer dimers. So if this is high then it suggests that there may have been a problem in the clean-up steps.
- Reads used for MT counting. Counting the number of unique molecular tags delivers an accurate representation of the starting amounts of RNA when compared to counting reads.
- Row 11: MTs: Number of unique tags per sample Row 12: reads per MT mean: Indicates the unique capture read times so aim to have between 2 – 3. This seems to plateau at about 10 and hence you see diminished returns.
- We see the Gene ID and Gene Symbol, Gene Strand Chromosome location and coordinates Control Type Single exon indicates if the amplicon that is designed is across an exon (indicated by 0) or within an exon (indicated by a 1)
- The gDNA control amplicons are spread out on the genome in transcriptionally dead regions. These will get flagged if the MT counts are high suggesting gDNA background.
- The reference housekeeping genes were chosen because they are expressed at a moderate level. The inclusion of the Housekeeping Reference Genes in a QIAseq RNA Panel means that they can be used to normalize the data and to make sample-to-sample and run-to run comparisons conceivable.
- The QIASeq Targeted RNA Panel Secondary Data Analysis Webportal analyzes molecular tag counts to normalize the data and calculate the changes in gene expression.
- The “Uploaded Data” page displays the molecular tag counts, Sample name, and defined Groups. Confirm that the data was uploaded and labeled correctly.
- On the “Sample Manager” page, assign “Samples” to their different “Groups”, with at least one “Control Group” and at least one “Group 1”, or choose to “Exclude Sample” using the dropdown menu for each Sample. Click the “Update” button when finished. For Custom and Extended Panels, use the “Select Housekeeping Genes” to identify the desired housekeeping/reference genes.
- Review the “Data QC” page to ensure that each Sample has passed the Genomic DNA Contamination quality control.
- Unique MTs: Normalization to Total MTs is used in a panel where a majority of genes are stably expressed or majority of MTs originate from stable genes. In general, Total MTs used with samples originating from the same cell type or tissue type. Equal loading of RNA sample into cDNA reaction and BC reaction. P-values and volcano plots are only generated if replicates are performed in the experiment.
- This method simply uses the sum of the molecular tag counts in each sample as the normalization factor. However, it assumes that equal amounts of RNA were used in the analysis and that a majority of the genes are expressed at a relatively stable level across the Samples. Therefore, the software performs a quality control test on the percentage of relatively expressed genes in each Sample before recommending whether or not this method should be used. It also assumes that the samples originate from the same cells or tissue type. Upon selecting “Total Molecular Tags” from the “Choose your preferred method of analysis” dropdown menu, the software provides a table listing for each Samples “Stably Expressed Genes” molecular tag count, “Total” molecular tag count, “% Stably Expressed Genes”, and “QC Check”. If more than half (> 50 %) of the molecular tag counts are derived from stably expressed genes in a Sample, then the “QC Check” column reports “OK” for that Sample; otherwise, it reports “Caution”.
- GeNorm ranks expression from low to high. Genes that have a stability factor of less than 1.5 are more stably expressed. If you use all of the housekeeping genes you will get a fold change that is slightly an under estimated value when compared to using only the top three ranked genes which gives you a more accurate fold change. Upon selecting “Average Reference Genes' Molecular Tags” from the “Choose your preferred method of analysis” dropdown menu, a table is provided of the reference genes that demonstrate a GeNorm Stability Factor less than 1.5. Checkboxes are provided to de-select or re-select genes as desired based on their stability factor ranking. The normalization factor, calculated as the average molecular tag count for the selected reference genes in each Sample and in each Group, is provided for evaluation to insure its stability across Samples and Groups.
- Review the “Fold Regulation” and “Fold Change” pages for the final results processed by the software from the inputted data.
- Define “Groups” to be compared. Choose the fold-change boundary (threshold) of interest. Mouse over the right-hand table entries to highlight symbols on the plot. Click check boxes to remove genes from or add genes to plot. Click the “Export Data” button to download the results as an Excel file. To save the figure, mouse over and click on the options available from the top right icon.
- Define “Groups” to be compared. Choose the fold-change boundary (threshold) of interest. Mouse over the right-hand table entries to highlight symbols on the plot. Click check boxes to remove genes from or add genes to plot. Click the “Export Data” button to download the results as an Excel file. To save the figure, mouse over and click on the options available from the top right icon.
- Define “Groups” to be compared. Choose the fold-change boundary and p-value thresholds. Mouse over the right-hand table entries to highlight symbols on the plot. Click check boxes to remove genes from or add genes to plot. Click the “Export Data” button to download the results as an Excel file. To save the figure, mouse over and click the options available from the top right icon.
- The clustergram performs non-supervised hierarchical clustering of the entire dataset to display a heat map with dendrograms indicating co-regulated genes across Groups or individual Samples. With Targeted RNA Panel data, the clustergram provides an overview of what genes may be co-regulated by a common factor, e.g. a transcription factor, miRNA, methylation status, etc.
- Fold change is calculated as the average ratio of normalized molecular tag counts (or relative gene expression) between the Control Group and each Test Group. Numbers greater than 1 indicate upregulated or increased gene expression, numbers between 0 and 1 indicate down regulated or decreased gene expression, and a fold change of 1 indicates no change. Fold-change results greater than 2 or less the 0.5 are highlighted in red.
- For all fold-change values greater than 1, the fold-regulation and fold-change values are the same. For all fold-change values (X) less than 1, the fold regulation is the negative inverse of the fold change (–1/X). For example, a fold-change value of 0.25 corresponds with a fold regulation of –4.0. Fold-regulation values greater than 1 indicate upregulated or increased gene expression; fold-regulation values less than zero indicate down regulated or decreased gene expression. Fold-regulation results greater than 2 or less the –2 are highlighted in red.
- Content powers advanced data analysis and interpretation Quality of manual curation Proprietary databases plus best in class public domain databases offer as comprehensive as possible view of characterized variants
- Workflow using Claudin Low To define: Bioprofiler -> to Pathway RNA seq -> Claudin Low