North Carolina Industry Structure and Growth
•
1 gostou•414 visualizações

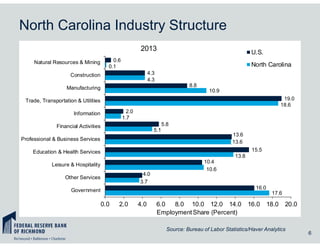
The document analyzes key economic indicators and industry structure for North Carolina. It shows that in 2013, North Carolina's largest industries by employment share were trade/transportation/utilities (19%), government (16%), and manufacturing (13.6%). It also provides data on employment growth, wages, housing permits, prices, and delinquency rates to compare North Carolina's economic performance to national trends from 2003 to 2014.

Recomendados
Recomendados
Mais conteúdo relacionado
Semelhante a North Carolina Industry Structure and Growth
Semelhante a North Carolina Industry Structure and Growth (20)
Mais de PublicFinanceTV
Mais de PublicFinanceTV (20)
Último
Último (20)
North Carolina Industry Structure and Growth
- 1. North Carolina Industry Structure 6 0.6 4.3 8.8 19.0 2.0 5.8 13.6 15.5 10.4 4.0 16.0 0.1 4.3 10.9 18.6 1.7 5.1 13.6 13.8 10.6 3.7 17.6 0.0 2.0 4.0 6.0 8.0 10.0 12.0 14.0 16.0 18.0 20.0 Natural Resources & Mining Construction Manufacturing Trade, Transportation & Utilities Information Financial Activities Professional & Business Services Education & Health Services Leisure & Hospitality Other Services Government EmploymentShare (Percent) 2013 U.S. North Carolina Source: Bureau of Labor Statistics/Haver Analytics
- 2. North Carolina Industry Growth Percent Change in Employment from a Year Ago, NSA 13 1.5 3.4 2.6 0.5 1.9 -2.5 0.8 3.7 1.5 2.9 0.6 -0.2 1.4 0.0 2.5 0.0 2.2 0.7 1.0 3.4 1.1 0.8 2.5 0.0 -4.0 -2.0 0.0 2.0 4.0 6.0 Total Natural Resources & Mining Construction Manufacturing Trade, Transportation & Utilities Information Financial Activities Professional & Business Services Education & Health Services Leisure & Hospitality Other Services Government Percent February 2014 U.S. North Carolina Source: Bureau of Labor Statistics/Haver Analytics
- 3. North Carolina Payroll Employment 20 -7.0 -6.0 -5.0 -4.0 -3.0 -2.0 -1.0 0.0 1.0 2.0 3.0 4.0 5.0 2004 2005 2006 2007 2008 2009 2010 2011 2012 2013 2014 2015 YoY%Chg U.S. North Carolina February 2014 US: 1.6% NC: 1.2% Source: Bureau of Labor Statistics/Haver Analytics
- 4. North Carolina Unemployment Rate 27 0.0 1.0 2.0 3.0 4.0 5.0 6.0 7.0 8.0 9.0 10.0 11.0 12.0 2004 2005 2006 2007 2008 2009 2010 2011 2012 2013 2014 2015 Percent U.S. North Carolina February 2014 US: 6.7% NC: 6.4% Source: Bureau of Labor Statistics/Haver Analytics
- 5. North Carolina Initial Unemployment Claims 34 0 20,000 40,000 60,000 80,000 100,000 120,000 140,000 160,000 2004 2005 2006 2007 2008 2009 2010 2011 2012 2013 2014 2015 Source: Bureau of Labor Statistics/Haver Analytics
- 6. North Carolina Real Personal Income 48 -4.0 -3.0 -2.0 -1.0 0.0 1.0 2.0 3.0 4.0 5.0 6.0 2003 2004 2005 2006 2007 2008 2009 2010 2011 2012 2013 2014 YoY%Chg U.S. North Carolina 4Q: 2013 US: 0.4% NC: 0.9% Source: Bureau of Economic Analysis/Haver Analytics
- 7. North Carolina Wages and Salaries 55 -6.0 -4.0 -2.0 0.0 2.0 4.0 6.0 8.0 10.0 2003 2004 2005 2006 2007 2008 2009 2010 2011 2012 2013 2014 YoY%Chg U.S. North Carolina 4Q: 2013 US: 2.1% NC: 2.8% Source: Bureau of Economic Analysis/Haver Analytics
- 8. North Carolina Building Permits Single-Family Homes 62 -60.0 -40.0 -20.0 0.0 20.0 40.0 60.0 2004 2005 2006 2007 2008 2009 2010 2011 2012 2013 2014 2015 YoY%Chg 3-monthmovingaverage U.S. North Carolina February 2014 US: 3.0% NC: -0.3% Source: US Census Bureau/Haver Analytics
- 9. North Carolina House Price Index—FHFA 69 -9.0 -6.0 -3.0 0.0 3.0 6.0 9.0 12.0 15.0 2003 2004 2005 2006 2007 2008 2009 2010 2011 2012 2013 2014 YoY%Chg U.S. North Carolina 4Q: 2013 US: 4.8% NC: 1.1% Source: Federal Housing Finance Agency/Haver Analytics
- 10. North Carolina Housing Starts 75 0 500 1000 1500 2000 2500 0 20 40 60 80 100 120 140 2004 2005 2006 2007 2008 2009 2010 2011 2012 2013 2014 2015 SAAR,thousands SAAR,thousands North Carolina (Left Axis) United States (Right Axis) Source: Bank of Tokyo-Mitsubishi UFJ/Haver Analytics
- 11. North Carolina Mortgage Delinquency Rate 90+ days delinquent 82 0.0 2.0 4.0 6.0 8.0 10.0 12.0 14.0 2003 2004 2005 2006 2007 2008 2009 2010 2011 2012 2013 2014 Percent Subprime Mortgages Total Mortgages Prime Mortgages 4Q: 2013 Subprime:10.2% Total: 2.6% Prime: 1.2% Source: Mortgage Bankers Association/Haver Analytics
- 12. North Carolina Foreclosure Inventory Rate 89 0.0 2.0 4.0 6.0 8.0 10.0 12.0 2003 2004 2005 2006 2007 2008 2009 2010 2011 2012 2013 2014 Percent Subprime Mortgages Total Mortgages Prime Mortgages 4Q: 2013 Subprime:6.0% Total: 1.7% Prime: 1.0% Source: Mortgage Bankers Association/Haver Analytics
- 13. North Carolina Foreclosure Starts Rate 96 0.0 0.5 1.0 1.5 2.0 2.5 3.0 3.5 4.0 2003 2004 2005 2006 2007 2008 2009 2010 2011 2012 2013 2014 Percent Subprime Mortgages Total Mortgages Prime Mortgages 4Q: 2013 Subprime:1.6% Total: 0.5% Prime: 0.3% Source: Mortgage Bankers Association/Haver Analytics