Renewables revolutionizing international trade through geographic diversification
•
0 gostou•214 visualizações

Díaz, P., Masó, J. (2013). The importance of geospatial data to calculate the optimal distribution of renewable energies. Poster in EGU General Assembly 2013, Session ERE – Energy, Resources and the Environment, Vienna, April 2013.
Recomendados

Recomendados
Mais conteúdo relacionado
Mais procurados
Mais procurados (20)
Destaque
Destaque (17)
Semelhante a Renewables revolutionizing international trade through geographic diversification
Semelhante a Renewables revolutionizing international trade through geographic diversification (20)
Mais de Paula Díaz
Mais de Paula Díaz (11)
Último
Último (20)
Renewables revolutionizing international trade through geographic diversification
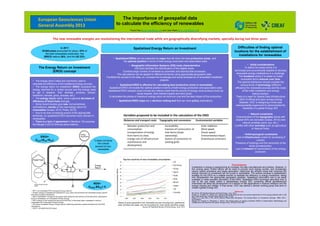
- 1. The new renewable energies are revolutioning the international trade while are geographically diversifying markets, specially during last three years The importance of geospatial data to calculate the efficiency of renewables Difficulties of finding optimal locations for the establishment of installations for renewables Paula Díaz (paula.diaz@uab.cat) and Joan Masó (joan.maso@uab.cat) In 2011 EU&Eurasia accounted for about 43% of the total renewables production, the BRICS nations 26%, and the US 23%. Spatialized Energy Return on Investment • Spatialized EROIs can be presented as maps that will show the best productive zones and the optimal position in terms of both energy production and associated costs. European Geosciences Union General Assembly 2013 • The energy return ratios are commonly used to calculate the efficiency of the traditional energy sources. • The energy return on investment (EROI) compares the energy returned for a certain source and the energy used to get it (explore, find, develop, produce, extract, transform, harvest, grow, process, etc.). • The energy return ratios show a general decrease of efficiency of fossil fuels and gas. • Some recent studies give new, but sometimes contradictory, results on the real energy return for renewables (Grassi, 2012; Prieto, 2013). • Due to an ever increasing scarce of the appropriate • Initial considerations To define the areas where it is technically and economically feasible to develop renewable energy installations is a challenge. The locations where it is easier to install renewable farms reduces over time. The optimal distribution should consider the various kinds of technology (different efficiency) for renewable sources and the costs of the initial installation and energy interconnection. There is a need for Spatial Data Infrastructure (SDI) of official and open access energy datasets. OGC is designing a three year interoperability experiment to demonstrate the feasibility of a global Energy SDI. • Natural constraints The Energy Return on Investment (EROI) concept the optimal position in terms of both energy production and associated costs. • Geographic Information Systems (GIS) tools characteristics GIS tools facilitate the identification of the eligible areas. Combine large number of variables by automatic and reproducible processes. The calculations can be applied to different territories using appropriate geographic data. Facilitate the access to the data, so, increase the knowledge and social acceptance of renewable installation projects. • Spatialized EROI is effective for calculating best productive zones in renewables Spatialized EROI will enable the optimal position in terms of both energy production and associated costs Spatialized EROI analysis could include any indirect costs that the source of energy could produce (such as visual impacts, food market impacts and land price). It calculates the places of maximum energy return at minimum cost and the less impact of the production. • Spatialized EROI maps are a decision making tool that can have policy implications Conclusions • Due to an ever increasing scarce of the appropriate territories, an spatialized EROI becomes more relevant in renewables. • There is a lack of agreement in literature. We propose the Raugei’s (2012) formula (show bellow). • Natural constraints Characteristics of the topography (lands with slopes>20% are excluded (Grassi, 2012)) and natural variables (wind, sun, etc.). Conflict with other activities such as agriculture or Natural Parks. • Anthropological constraints Lack of infrastructure (roads for accessing of cranes). Presence of buildings and the ownership of the lands (private/public). Lack of network for transmission of the energy produced. Distances and transport costs Topography and connexions Environmental variables Between production and consumption: transportation of energy from farms to cities. Energy cost of infrastructure maintenance and development. Accessibility. Easiness of construction of new farms (slope ownership). System of connection to existing grids. Solar radiation. Wind speed. Ocean speed. Environmental impact. Greenhouse emissions. Variables proposed to be included in the calculation of the EROI EROI= EOUT/(EED+EPP) It does not show the overall amount of non- renewable Conclusions Investment in energy is experiencing an increase, but also manufactures and policies. However, in the coming years, further efforts will be need to provide more energy access, and increasingly reduce carbon emissions and waste generation. Determine the efficient areas that maximize the energy returned on investment will be crucial in renewables. The authors propose a spatialization strategy for the EROI as a reliable solution to facilitate the efficiency in energy investment, taking into consideration the appropriate geospatial variables. Spatialized information has to be easily available to make possible calculation of the EROI. Spatialized EROI technique described here is one of the use cases where a standardized Energy SDI, containing official georeferenced information will allow the development of a milliard of new applications in science research and the energy industry and utilities. In that sense, OGC has started a domain working group that aims to create a global Energy SDI. References BP (2012). BP Statistical Review of World Energy. June, 2012. Grassi, S., Chokani, N., Abhari, R.S. (2012) Large scale technical and economical assessment of wind energy potential with a GIS tool, Case study Iowa. Energy Policy 45(2012), pp. 73–85. Prieto, P. A. and Hall, C.A.S. (2013) Spain's Photovoltaic Revolution: The Energy Return on Investment. Springer. ISBN: 978-1- 4419-9436-3 Raugei, M., Fullana, P., Fthenakis, V. (2012). The energy return on energy investment (EROI) of photovoltaics: Methodology and comparisons with fossil fuel life cycles. Energy Policy, 45 (2012) 576–582 REN= EFEED &EED= 0 • EFF= non-renewable PES in the ground (e.g.crude oil) • EFeed= energy of extracted and delivered EC (e.g. heavy fuel oil)=direct non-renewable energy input for electricity production (feedstock) • EED= Feed/EROIF =energy for the supply chain (extraction and delivery) of the feed stock, expressed in terms of (renewable+non-renewable) Primary Energy • EPP= energy for the construction and end-of-life (EoL) of the power plant, expressed in terms of (renewable+non-renew-able) Primary Energy • ER= direct renewable Primary Energy input for electricity production (usually excluded from the EROI calculations) • EOUT= net electricity (EC) output Based on gross generation from renewable sources including wind, geothermal, solar, biomass and waste, and not accounting for cross border electricity supply. Source: BP Statistical Review of World Energy. June, 2012