
Recomendados
Recomendados
Mais conteúdo relacionado
Mais procurados
Mais procurados (17)
Destaque
Destaque (12)
Semelhante a GROUP PROJECT REPORT_FY6055_FX7378
Semelhante a GROUP PROJECT REPORT_FY6055_FX7378 (20)
Mais de Parag Kapile
GROUP PROJECT REPORT_FY6055_FX7378
- 1. GROUP PROJECT REPORT ON BIG DATA ANALYTICS PARAG KAPILE – FX7378 ABHISHEK ANAND – FY6055 Abstract “BIG DATA” is the buzzword of the day. In today’s ever-growing business and increased complexity, supply chain professionals have been inundated with data, motivating new ways to organize and analyze the produced data. The increase collaboration between companies, organizations and governmental organizations on one hand and the availability of individual product for customers in the vast and growing market has led to certain issues, especially that of handling such vast amounts of complex data. In this paper we as supply chain students would be focusing on how big data analytics would help in not only handling these data but also help the companies in analyzing and forecasting based on these so called data, thus helping them in optimizing their supply chains through easing off the decision making process and handling risks and interruptions in supply chain. Introduction Big Data is more than a faddish fuzz and rather carries with it the ability to not only change the business model of organizations but also help them in the day-to-day decision making process through data analytics and predictive analysis. This growing combination of the available data, the tools and applications play an important role in the field of supply chain management and present us with challenges and opportunities that would eventually help in revolutionizing supply chain to benefit the mankind. In fact if sources are to be believed, in the past two years more data have been recorded than in the history of mankind. With the growth in not only the quantity but the diversity of data, the conventional management tools that were used to manage data have become outdated and incapableof handling suchlarge amounts of data. In order to manage these invaluabledata sets which actas a driver for any business thus leading them to profitability, we have new methods of data science and applications in the form of predictive analytics. Many also believe that competition between markets has now shifted to competition between supply chains which has put all the more focus on the organizations supply chain, thus forcing the managers to rethink their strategy in order to survive and sustain in this competitive market and be ahead of the competition. Thus many have sought to the option of winning with data and in factmany organization are seeking to capitalizeon data analytics as ameans to gainadvantage. Thus data science, predictive analysis and “big Data” are thought to be a part of the emerging competitive area which would help in transforming the way in which our supply chains are managed and designed. This emerging field of data science combines the mathematical, statistical, behavioral science and computer science in order to get an insight from the enterprise data while predictive analytics helps the organizations with the future outcome predictions through data sciencetools. It has also been found out that the top performing organizations use analytics five times more
- 2. than lower performing organizations. Additionally companies in top third of their industry that used data driven decision making were 5% more productive and 6% more profitable than their competitors. This thus adds to existing evidence and importance of big data and why it should be used in supply chain or rather as tool in supply chain. Big Data term definition Big data is a way of collecting, managing and analyzing large amounts of data sets that are too complex to be handled by traditional data processing applications are inadequate to deal with. Big data is mostly reference with the three Vs which are volume, velocity and variety. Volume describes the large amount of data that is being collected and stored in the respective IT infrastructure of the organizations. The amount of data itself poses challenge for the IT infrastructure to store and later retrieve such largeamounts of data. It alsomeans having enough storage space and proper accessibility to it. Velocity describes the large amount of data which is received in real time in an irregular manner. This fast arriving data that is received need to be analyzed and handled and further usage is to be planned. The third V is variety which is the type and the nature of data. This large amount of data that is received in various structures is to be used in big data. This data that is received is either based on a structure or is unstructured. Knowing the type or variety of data helps the people who are analyzing it to get a better insight of the result obtained. Data Production While we are now aware of what big data is and what it means we also need to know and understand how this data is produced, its sources and how it plays an important role in supply chain management. A good way to understand this is to take an analogy between big data production and a manufacturing process. Even though there are many similarities between big data production and a manufacturing process, but there are certain differences that too exist between these two. Fig 1: Analogy between Big data production and manufacturing process.
- 3. While in a manufacturing process raw materials are the input to the process and the finished product is the output, the raw materials deplete as the products are produced. But in big data production the raw material or the input is data which is then processed and the transformed data product is the resulting output. Unlike a manufacturing process where in the raw material depletes, in bid data production the data does not deplete through the production process. Additionally a bad batch of data that was used would remain in the system unless and until is cleaned up or removed actively. Still the biggest difference between the two is that while the quality of products in a manufacturing process can be measured, it is difficult to measure the quality of intangible data. As is said “you cannot improve what you cannot measure”. Thus there is a need to implement some method in order to measure the data quality. Data Sources The data sources are mainly divided into two categories, namely internal and external data. The internal data is available through business IT systems and data bases like the ERP system. It is also available through internal communication systems as data streams like radio frequency identification devices (RFID). The external data sources are available as data streams, like data sets from Facebook or other social media. The difference being that the data sets available from social media are unstructured unlike internal data sources. Also the data semantic of these data sources is various and continuously changing. Additionally social media data is not directly accessible, like twitter gives access to only a limited number of tweets and thus companies like data sift offer purchasable data sets. The external data sources from the search engines are also not structured but the provided APIs are free to use. Open data sources are free for commercial and noncommercial use and contain statistics, geo and political information of regions and countries. Through the open data portals these sources can be accessedand these then further open up to other open data sources. Next there are many platforms which offer closeddata. The closeddata that are availableeither need to be purchased or elseare licensedor need access tobe acquired. Example factualwhich offers services likedata mapping and ad targeting, Microsoft Azure data market which gives access to data sets provided by different companies or organizations. Data Management and Analytics Due to high amount of data and various structures new architectural designs are required in data management and analytics. As conventional architectural; components, like SQL databases cannot handle these amounts of data and the existing enterprise architecture which are designed without these data centric characteristics we need a new design for these structures. Also these modern enterprises have to focus on data to enable big data analytics. As the data now a days are structured way too individually, new database concepts have been developed to store and manage these individually structured data and are generally known as NoSQL(Not only SQL). The focus of these databases lies on distributes accessibilityandscalability. As these NoSQL graph databases have close relation to applications like transport schedule
- 4. optimization, navigation systems or socialnetwork these are an attractive option for supply chain modelling and solutions.Thesedatabases organize the data model within a graph structure which comparable to a road network and the information in the graph database are stored within these nodes. This additional information is defined as properties to describe node. Thus a link establishes a connection between different database entries. The data analytic approach to handle such big data rare linked to the right data management concepts as these large distributed data storages are required by batch analytics. Thus we can say that the batch analytics are working in tandem with distributed tasks on large data storages to search and extract information. Through the large scale processing framework these batch analytics are executed and managed and the Apache Hadoop framework is one such example of it. This system has two parts one which handle the vast amounts of data and the other which is for executing the analytics as characterized. One of the main challenges faced in data analytics is to analyze irregular data that arrive at irregular time intervals and these data streams are often characterized as real time data. Thus to solve this issue Lambda Architecture has been designed in addition to batch analytics as described before. Dimensions of Data Quality As we know the data quality consists of various dimensions but the two main categories of it are intrinsic and contextual. Intrinsic data refers to the attributes that are objective and native t the data, while contextual data refers to the attributes that are dependent on the context on which the data is being used. The dimensions included in the later are relevancy, value added, quantity, believability, accessibility and reputation of data. These data have been measured through self- report surveys and questionnaire. The contextual data quality is inclined or includes more about information than data as these are more situation or problem specific and are relevant in those contexts only. As stated earlier, we would be considering the motion of data similar to that of a production facility, we would be focusing on intrinsic data quality than contextual data quality. Fig 2: Dimensions of Data Quality
- 5. In this paper we would be describing the intrinsic data quality on four parameters or dimensions namely – accuracy, timeliness, consistency and completeness. 1. Accuracy – this dimension refers to the degree to which a particular data is equivalent to its corresponding real value or in other words it refers to the correctness of the data compared to the actual value. This can be measured by comparing the data gained with the external values that are known to be correct. For example we could consider the data record in a customer relationship management system.Here we check whether the street address of the customer in the systemmatches with the street address where he resides. The accuracy in this case can be assessed by validating the shipping address on the recent purchase order. The accuracy of such data is self-dependent and no value judgment is needed. 2. Timeliness – this dimension refers to the degree to which the data is up to date. It can be further divided into two dimensions which are currency and volatility. Currency is the length of time since the data has been last updated and volatility is the frequency of updates. Even data which is correct when assessed but has been updated infrequently can also hamper managerial decisions as errors that may have occurred in the data may have been missed due to less frequent data updating. As an example we could consider using currency and volatility together to determine timeliness. Currency is calculated using the time the data was entered and the age of the delivery. 3. Consistency– this dimension refers to the degree to which the related data records match in terms of format and structure. It is defined as when the representation of the data values is the same in all cases. Consistency is developed on the notion of intra-relation and inter-relation constraints. The former asses the adherence of the data to a range of possiblevalues while the former assess howwell the data are represented using the same structure. For example a person currently alive would have year of birth as a possible range of 1900 to 2013, while the persons record in two different data sets would have a field for birth year and both these represent the persons year of birth in the same format. 4. Completeness – this dimension refers to the degree to which data are full and complete in content without any missing data. This dimension describes the minimal amount of data that has been captured or all the data values that have been captured. All the data is needed in order to understand what the data actually is trying to convey. For example, if a particular customer’s record includes his name and street address but no state, city and zip code then such data is considered incomplete and the minimum amount of data needed for a complete address is missing. Using the ratio of completeness to incompleteness we could further for a potential measure of completeness. Using these data quality measure one can monitor the improvement or adherence to data quality standards. For example if we tag a particular data as inaccurate then in the long run its accuracy should be monitored to keep a tab on it. This way combining all the other three data quality dimensions would help ensure that the records in the data set are accurate, timely, complete and consistent.
- 6. Controlling data Quality with SPC Until now we have understood about the various data quality aspects which can be used to determine the quality of the data at the end of the line or after the completion of the whole process. Like the production line, there exists aneed to not only assess thequality of the data at the end but also keep controlling the quality throughout the process flow. For the very same reason we would be discussing a few data quality control methods mainly about SPC. This would help in addressing the deficiencies in real time and be corrected before they have a cascading effect. Emphasis is laid on the importance of maintaining a process focus when considering data quality using simple tools such as histogram, fishbone diagram, Pareto chart, for cleaning up a data production process. After the initial quality efforts have helped in improving the current state of the data quality thus bringing it into an in-control state, ongoing process monitoring methods can be used in order to maintain the quality of the data. Advanced co0ntrol chart methods have been used traditionally for monitoring and controlling production quality. Even though SPC methods have been used in supply chain to improve quality, but have not been used to improve the data quality in supply chain and thus we propose using SPC as a method to improve the quality of data used in supply chain management. SPC hasn’t been used traditionally to control data quality not 0only due to lack of awareness but also because SPC methods were developed based on the assumptions relevant to actual processes themselves and by the data used by the managers to control these processes. In this paper we would be focusing on the data production process that includes data collection, storage, retrieve and processing and consider the output of this process as data sets similarto the product manufactures in aproduction facility.We would be examining how the data production process can be effectively monitored, controlled and improved through control charts for improving the quality of the data which are used by the supply chain mangers to manage their process. As we know Shewart introduced the control charts in order to monitor the quality of the products in a production facility and these methods were later popularized by Deming to aid Japanese in rebuilding their manufacturing base. Following is the figure of Shewarts control chart. In the figure the dotted lines represent UCL and LCL which are the upper control limits and the lower control limits which are based on the statistical nature of the process under consideration.
- 7. Fig 3: Shewart-type control chart showing an in-control process Each of the data series that have been plotted over time represent a measure of a process characteristic and the values that fall between the UCL and LCL are considered subject to usual or common cause process variation. When all of the points plotted fall in between the control limits that is UCL and LCL then the process is considered to be in control. Those points which lie outside of the control region are considered as signals to potential out of control process or are subject to some external force that isn’t expected in the usual confines of the process. Whenever a control chart depicts an out of control event, the root cause of the problem is found out by the process operators. Now-a-days advanced forms of the control charts are being used and almost replaced the Shewarts chart. Examples are the Cumulative Sum control chart (CUSUM), Exponentially Weighted Moving Average (EWMA) multivariate Shewart-type control charts such as T2 chart, multivariate versions of the CUSUM and EWMA and many others. Also there are process charts that have been developed to monitor categorical and discrete process characteristics. These different types of control charts described have been designed to work in different scenarios.
- 8. Even though there are different types of control charts these are not used widely for controlling the quality of data in the SCM context. With the increase success of supply chain in today’s business we suggest using these control charts for monitoring and controlling the supply chain data quality. We would now be demonstrating how these methods can be used to enhance the data quality in supply chain setting. Use of SPC to monitor and control supply chain data: An example case study In this case study the data management program of an organization that remanufactures jet engines and related components has been examined and the control chart methods have been introduced in order to enhance the quality of the data. This particular data management systemis used for real-time monitoring of the closed loop jet engine inventory for one cargo aircraft. The repair status and the engine location are some of the most important data that has been tracked in this database. The data products that are derived from this system are used by the line managers, mid-level managers and the senior managers for various decision making purposes, like determining if a particular aircraft is currently capable to deploy overseas which means that none of its engines require extensive maintenance or inspections that the deployed location is not capable of providing or conducting. We would be limiting our examination to data records of jet engine compressors that is a sub-component of jet engine. As seen in the above table, records for eight different compressors have been captured in real time and additionally to maintain brevity in our example, we would focusing on one of the four intrinsic data quality dimension, i.e., completeness. Completeness was measured at the record level and has been defined as
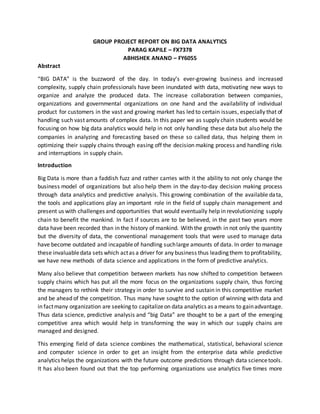
- 9. For i = 1… 8, compressors and k = 1… NR , part records. Thus, we have eight binary variables describing completeness. The first 400 samples taken can be used as the reference sample and the above table shows the phi coefficients estimating the correlation among the eight completeness variables. The values along the diagonal are the estimated proportion of incomplete records. Fig 4: Bernoulli CUSUM chart of completeness of component 6 for aircraft maintenance database. The above figure shows the completeness scores for the next 204 observations for compressor 6. As can be seen we have used Bernoulli CUSUM control chart to monitor the incomplete records as each record was determined either incomplete(1) or complete(0) and the data can be well modeled by a Bernoulli distribution. Using the Bernoulli CUSUM for monitoring dichotomous quality characteristics would lead to a faster detection of process changes because it eliminates the need to accumulate a large subgroup of observations prior to plotting a control chart statistic. From the chart it is evident that the out of control signals
- 10. were giveon observations 445 – 448 following aseries of incomplete records. Using this chart managers were able to detect a data quality problem and corrective actions were taken that included retraining the data entry workforce. After this the CUSUM chart was reset and process controlled in an in-control state. Potential Benefits of Big Data Analysis The application of big data analytics can contribute to various fields and benefit them. These sections or fields can be divided into operational efficiency, customer experience and new business model. AlsoBig DataAnalytics would enable new business models and help generate new revenue streams. Operational efficiency based on Big Data capabilities use data for better decision making and improvement in terms of process quality, performance or resource consumption. The other section which is customer experience is mainly assigned to marketing. Big data benefits can be measured through specific IT related Key Performance Indicators. TheseKPIs refer to qualitative and quantitative aspectwhich is either time, quality or financially oriented. CapGemini identifies M2M as an issue that gained a lot of importance. M2M enables automatic information exchange between different objects e.g., vending machines, camera, transport vehicles, containers and their corresponding database. Possible use cases can contain activities likemonitoring areas and machines, increasing the maintenance of facilities and an automatic ordering when demand is recognized. The M2M will enable new business models and has the potential to highly increase the operational efficiency. The use of RFID readers would help increase the transparency of freight deliveries between companies. When a handling unit is detected read points are generated which are available I real time and enable better transparency and thus speed up the process.This can be achieved through planning optimization of deliveries and supported detection of bottlenecks and risks. Use cases with regard to anticipatory shipping intention will help speed up delivery times of goods and increase the utilization ratio of distribution capacities. For example DHL’s volume forecast with predictive capacity utilization and planning is one such use case example. The parcel volume analysis helps to improve the prediction accuracy of expected parcel and freight within their network. This can be realized by correlating data from different sources and with different degree of privacy protection. Another example is Amazon’s US patent for anticipatory shipping from December 2013. The aim of this is to ship goods prior to customers order to reduce delivery time. A prediction of the upcoming orders is the key element of the patent which enables several applications. First a shipment is sent to the destination area without knowing the complete shipment address. Then in the meantime the complete shipment address is obtained and the shipment is sent to the specific address. This helps in reducing the overall lead time and thus helps in improving customer satisfaction. Additionally Amazon even collects data from the customers
- 11. shopping process which then helps it to forecast the demand and also help generate the delivery data for it. Conclusion With the ever-growing supply chain system and the increasing revenue being generated through Supply Chain Management, the emphasis on finding new solutions and implementing those is the need of the hour. Big data has a key role to play in this aspect as Big Data Analytics not only help improve the quality of the data gathered through various tools it alsoleads to influencing business models and can further lead to new business models , as shown by Amazon. In this paper, we have discussed about the ongoing research work for developing new solutions for increasing supply chain visibility based on data source classification and its potential benefits. It would help in the future if various companies build Big Data ecosystems for gaining new business models and providing new services to customers. Even though it would lead to an increased complexity in supply chain, the use of IT systems and designing solutions would help overcome it. Also discussed are the data quality issues and how various statistical tools could be used to improve the quality of data being gathered and processed. The increasing importance of data to supply chain mangers should lead to an amplified awareness and sensitivity to their need for high quality data products as the results based on poor quality data could be costly for an organization. Thus supply chain mangers should start looking at the quality of the data produced in the same way as they look at the quality of the product produced. References 1. Data quality for data science, predictive analytics, and big data in supply chain management : An introduction to the problem and suggestions for research and applications by – Benjamin T. Hazen, Christopher A. Bone, Jeremy D. Ezell, L. Allison Jones-Farmer 2. Arnold, S.E., 1992, Information manufacturing: the road to database quality. 3. Barton, D., Court, D., 2012. Making advanced analytics work for you. Harvard Business. 4. Big data Analytics for Supply Chain Management by – Jens Leveling, Matthias Edelbrock, Boris Otto. 5. Data Science, Predictive Analytics, and Big Data: A Revolution That Will Transform Supply ChainDesignand Management by - Matthew A. Waller and Stanley E. Fawcett. 6. Big Data, Analytics and the Path From Insights to Value