SlideShare uma empresa Scribd logo
1 de 23
Baixar para ler offline
Page 1
WIPAC MONTHLYThe Monthly Update from Water Industry Process Automation & Control
	www.wipac.org.uk												Issue 4/2017 - April 2017
Page 2
In this Issue
	 From the Editor....................................................................................................................	 3
	 Industry News.....................................................................................................................	 4 - 9		
	 Highlights of the news of the month from the global water industry centred around the successes of a few of the
	 companies in the global market.
	 The Art & Importance of Calibration.................................................................................. 	10-12
	 In this month’s feature article, group manager - Oliver Grievson, writes about the “Art” of calibration and what is a
	 very important part of the industry now and what will become and even more important part of the future of the
	 Water Industry as we enter the Smart/Digital Age
	
	 The need for Water Service Resilience................................................................................. 	13-14
	 In this article written by Shirley Ben-Dak of the Smart Water Networks forum we look at the four pillars of Resilience in
	 the supply of potable water
	 How digitisation has opened up new opportunities in industrial measurement................... 	15-16
	 Alan Hunt from ABB discusses in this article how the digitisation of instrumentation has led to improvements in the way
	 that instrumentation is used including the elimination of problems like scaling and the use of Hart & Bus protocols in
	 this fascinating look into the opportunities that are available.
	 Anglian Water uses mapping tool for retrofit SUDS........................................................... 	 17
	 This article discusses the collaboration between Anglian Water & engineering company, Atkins in identifying parts of
	 the Anglian Water business that would benefit from sustainable urban drainage systems (SUDS) using the modelling
	 tool SuDS Studio
	 The measurment of Turbidty.......................................................................................... 	 18-21
	 In this White Paper by ABB the measurement of turbidity in the wastewater industry is discussed including the principals
	 of the measurement technique as well as the challenges of getting accurate measurement and ensuring that it stays
	 accurate by using calibration techniques.
	
	 Workshops, Conferences & Seminars................................................................................... 	22-23	
	 The highlights of the conferences and workshops in the coming months
	
WIPAC Monthly is a publication of the Water Industry Process Automation & Control Group. It is produced by the group
manager and WIPAC Monthly Editor, Oliver Grievson. This is a free publication for the benefit of the Water Industry and please feel
free to distribute to any who you may feel benefit.
All enquires about WIPAC Monthly, including those who want to publish news or articles within these pages, should be directed 		
to the publications editor, Oliver Grievson at olivergrievson@hotmail.com
Page 3
From the Editor
					
In a few weeks time the Water Industry Process & Automation & Control Group will celebrate its 6th
anniversary and at
these times I like to look back and see what the group has done and what it has contributed towards the Water Industry
other than the 67 editorials that have featured in the front of every issue of WIPAC Monthly. All of this makes me look
back at the discussions that we have had as a group of people and the direction that the industry is heading in.
Looking back I think it fits to parody the Gartner Hype Cycle with something I’d like to phrase as the WIPAC information
cycle. Whereas Gartner moves from a technology trigger through hype, expectations, disillusionment, enlightenment and
productivity for me the journey of instrumentation to data to information also follows a cycle. Let me explain my thoughts
and the stages that we go through.
Firstly we have the initial trigger, the installation of instrumentation and we have data. Its exciting we can know what is
going on through the day and night without having to take measurements all of the time. Believe it or not this can be
right for a treatment plant or distribution/collection network. Instrumentation isn’t always the answer but if you want to act as we do in the modern water
industry and have a “production factory” approach then you are bound to go down this line at some point. The second stage of course is receiving all of this
data mirroring Gartner’s “Peak of Inflated Expectations.”
From here we enter “the resistance to the effective use of instrumentation, the data isn’t valued as there is literally too much of it and we head towards a
crucial point in time which is of course valuing the data. If the data isn’t used and isn’t valued then you might as well not have instrumentation. This is of course
where things can fall down as if the data isn’t valued then the instruments stop working and we are forever stuck in “The Resistance phase”
Stage four very much “The definition of Information,” knowing what we want to know and defining it bringing the data together and creating the information
that we either need or we want to run our “production factories” efficiently which leads to the fifth and last stage the “plateau of informed decision making”
where we are in a situation where the data & information are used in such a way that we have all the information that we need to hand to make the best
decisions.
The question is why aren’t we developing into a Smart Digitally based Water Industry quicker than we are at the moment. Perhaps its because there are areas
of the industry that haven’t been through the cycle or perhaps its a case of differing development rates across the industry driven by differing needs. What it is
safe to say is that some have been through and are starting to develop a Smart Digital way of working the case studies are starting to develop and the benefits
of taking the approach is starting to be understood. For some it has been a journey that started more than six years ago and some people within the business
have been working at it for the best part of forty years and the development of the first real instrumentation in the industry and it is possible that the journey
that is starting to be taken will still be going in another forty years. The important thing to bear in mind though is that the first steps have been taken and as
one step follows another then the industry will develop towards a Smart Digital age.
What can drive us into a faster and faster pace? Case studies, understanding the benefits events like the ones that are happening in June with ATI in
Manchester and in September with the Sensors for Water Interest Group. We are in exciting time with a journey to be taken and of course WIPAC will be with
the industry every step of the way
Have a good month
Oliver
NIVUS Wins Water Dragon Award 2016
Water industry BIM initiative short-listed for award
After winning the regional heat at Severn Trent’s Headquarters back in
September the manufacturer of high accurate flow measurement
systems wins the national UK Innovation Award with their Cross
Correlation Pipe Sensor. The NIVUS team picked up its award at the Future
Water Association’s annual lunch which was held at the Pump Rooms in
Leamington Spa on 23rd February 2017.
The award winning flow sensor measures the flow directly within the pipe
which is far superior to regular Clamp-On-Systems which can only meas-
ure from the outside. Why go to the concert and only listen behind the
door? Nivus advanced technology and superior signal quality equals more
reliable measurement results. Considered a game changer the NIVUS solu-
tion proves to be smart. Benefits are numerous, easy installation without
shutting down the flow is distinctly advantageous as well as delivering a low
carbon footprint.
The judges were impressed by the unique flow sensing technology developed by NIVUS which creates an audio image of particles within the wastewater to
increase the flow measurement accuracy. Furthermore they gave recognition for the easy installation which allows the insertion/removal without the need for
‘pipe shutdown’ as well as delivering the Totex based solution for the application favorably compared to existing flow measurement devices. And not least the
judges also commended Alison Southwood and David Miles for a strong presentation clearly defining the business case.
David Miles, Business Manager for NIVUS in the UK explains the importance of winning this award, “This recognition for our Cross Correlation Pipe Sensor
comes at an exciting time for NIVUS as we are seeing some fantastic results on sites throughout the UK on both fresh and waste water systems. Combining our
technology with existing applications is proving highly successful as for the first there is now a method for achieving a true and accurate measurement of flow”
NIVUS UK Innovation Manager, Alison Southwood, convinced the audience with the advantages of the pipe sensor solution. She states, “Winning the
Innovation Award is a reward for all the efforts we put in developing the high accurate and easy to handle measurement system. Now we are looking forward
to using this valuable endorsement to promote the advantages of our smart flow measurement solution to a wider audience.”
A whole-sector initiative to clarify the meaning of BIM in the water industry has been short-listed for a Utility Week Star Award for collaboration. Every water and
sewerage company (WaSC) in England, Wales, Scotland and Northern Ireland joined trade association British Water and BIM4Water, a specialist volunteer group,
to set a water industry framework for building information modelling (BIM).
The WaSCs, responding to comments from the supply chain, worked together to review the national BIM standards and document an agreed definition of what
BIM means to them as clients. The draft BIM Guidance for the Water Industry Owner Operator was formally launched for industry review at the 4th British Water
BIM conference on 30 March 2017.
BIM4Water and British Water represent members from across the water sector including WaSCs, equipment suppliers, designers and contractors. Since 2013,
members have been grappling with the meaning of BIM and in particular what BIM means for water companies and their customers.
Data sharing
Andrew Cowell, chair of BIM4Water said, “BIM and the new Guidance are about information management and how the water industry gears up to sharing data
and operating in a digital environment. It is significant that water utilities have pulled together and are recognising the push for clarification from the supply chain.
“It is about a different way of working, with opportunities for efficiency in design, delivery and on-going maintenance and asset management. Better information
can create more resilient business plans and support scenario planning.
“Water companies are acknowledging that while there is no regulatory mandate for BIM, improving data sets will help them meet Ofwat regulatory targets and
that there is a lot of value to be gained from having a strong digital strategy.”
Paul Mullord, British Water’s UK Director says, “Suppliers have sent a consistent message to the utilities about the efficiency savings to be had if they adopt a
more coherent and consistent approach to the information they require to operate and maintain their assets across the lifecycle. They have listened and, with
this document, demonstrated what extraordinary leaps can be achieved when the whole sector works together.”
The draft BIM Guidance can be downloaded here
Page 4
Industry News
First Of Its Kind Interactive Map Brings Together 40 Years Of
Water Quality Data
A new U.S. Geological Survey interactive map provides a comprehensive, long-term look at changes in the quality of our nation’s rivers and streams over the
last four decades. For the first time, monitoring data collected by the USGS and 73 other organizations at almost 1,400 sites have been combined to provide
a nationwide look at changes in the quality of our rivers and streams between the 1972 passage of the Clean Water Act and 2012.
Federal, state, and local agencies have invested billions of dollars since passage of the Act to reduce the amount of pollution entering rivers and streams that
millions of Americans rely on for drinking water, recreation, and irrigation. Tracking changes in the quality of these waterways over multiple decades is crucial
for evaluating the effectiveness of pollution control efforts and protecting the nation’s water resources into the future.
The interactive map can be used to see whether 51 water-quality constituents, like nutrients and pesticides, and 38 aquatic-life metrics, like the types
and numbers of fish, macroinvertebrates, and algae, have increased, decreased, or remained the same at nearly 1,400 sites between 1972 and 2012. For
example, the phaseout of the insecticide diazinon for residential and some agricultural uses was initiated in 2000 and has led to widespread reductions in
concentrations in U.S. streams, which can be seen on the map during the trend period from 2002 to 2012.
The map summarizes the first phase of the study — in which the USGS identifies streams that have been monitored consistently for long periods and reports
the trends in those streams. In the second phase, to take place over the next several years, the USGS will assess whether and where billions in investments in
pollution control have been effective, identify major causes of trends in U.S. stream quality, provide details on which chemicals are increasing or decreasing,
and highlight whether any drinking water sources or aquatic ecosystems are at increased risk.
A new USGS interactive map provides a long-term look at changes in the quality of our nation’s rivers and streams, using data from over 70 organizations. Go
online and see how 51 water-quality metrics and 38 aquatic-life metrics at nearly 1,400 sites have changed over the last 40 years.
This map was developed by the USGS National Water-Quality Assessment Project, which conducts regional and national assessments of the nation’s water
quality to provide an understanding of current water-quality conditions, whether conditions are getting better or worse over time, and how natural processes
and human activities affect those conditions.
Page 5
Welsh Water rolls out smart meter trial as part of EU-funded
WISDOM project
Welsh Water is installing 250 new digital “smart” meters in Grangetown, Cardiff – with plans for another 3,000 to be fitted over the next three months – as
part of an EU-funded water usage project involving partners from across Europe. The meters will measure water usage wirelessly at selected properties in
Cardiff, sending information back to the customers every hour so that they can monitor how much they are using, see peak usage times and help manage their
household utility costs. The information also gets sent back to Welsh Water who will be able to detect if any leaks or bursts have occurred at the property and
get the leak repaired much more quickly, reducing wastage and saving customers money.
Andy Blackhall, Water Demand Manager at Welsh Water said:
“In our recent customer engagement surveys, customers have informed us that they would like to see us trialling new and innovative ways to help reduce the
demand for water, and to help customers manage their bills.”
“We will use the results of the trial to help inform our future long-term business planning activity, and ensure we understand fully the costs and benefits of
delivering a world-class service to our customers.”
“All customers in the Grangetown trial will be offered a free water efficiency and usage survey, along with installation of free water saving products, such as a
water butt or more efficient shower head where required.”
The new smart metres will be the latest innovation used by Welsh Water in a bid to reduce costs and keep customers’ bills low. Reducing wastage is one of
the company’s top priorities with leakage rates halved since the early 1990s from 400 megalitres per day (Ml/d) to around 180 Ml/d. Welsh Water find and
fix around 26,000 leaks a year .
Moti Reuben at Channel View in Cardiff
The smart meter trial is part of a wider EU funded WISDOM project - Water Analytics & Intelligent Sensing For Demand Optimised Management - which has
received funding from the European Union’s Seventh Framework Programme for research, technological development and demonstration.
As part of the project funded the utility came together with ARAD Water Metering Group under the direction of UK Director Simon Ogden and The City of
Cardiff Council to implement SMART Metering. As part of this ARAD sent their signal specialist Moti Reuben from their headquarters in Israel to help survey
the Cardiff Pilot Area for the best signal setup. The WISDOM project has developed and tested an intelligent ICT system that enables “just in time” actuation
and monitoring of the water value chain from water abstraction to discharge, in order to optimise the management of water resources.
Other WISDOM pilots undertaken in Wales include:
•	 A study of WISDOM’s applicability to the problem of optimizing clean water networks by attempting to optimize, in real time, pumping schedules and
service reservoir levels so as to reduce energy consumption.
•	
•	 How WISDOM can enable the application of data driven modelling techniques to water network data – the specific focus in the trial was predicting
the occurrence of combined sewer overflows (CSOs) in waste water networks.
Click here for more information about the WISDOM project
TaKaDu Signs First US Contract With Knoxville Utilities Board
(KUB), Tennessee, USA
TaKaDu, a global leader in Integrated Event Management solutions for the water industry, announced recently that Knoxville Utilities Board (KUB) has signed a
contract with TaKaDu, following a public tender, as part of its concerted efforts to improve customer service and reduce non-revenue water (NRW). The project
is being managed by Matchpoint, one of TaKaDu’s distributors in the North American region.
KUB provides electric, gas, water, and wastewater services to Knoxville and parts of seven surrounding counties in the East Tennessee Valley. KUB invests
heavily in enhancing its infrastructure. In its water distribution system, for example, it has created District Metered Areas (DMAs) to partition the network,
added many sensors and meters for flow and pressure monitoring, and replaced other assets. The next natural step was to decide how to transform data on
the water system into operational knowledge, and TaKaDu was chosen to manage the vast volumes of sensor data providing near real-time analysis and
alerts for network incidents of multiple types. TaKaDu’s automated cloud-based service enables utilities to detect, analyze and manage network events and
incidents such as leaks, bursts, faulty assets, telemetry and data issues, operational failures and more. Converting raw data into knowledge, TaKaDu provide
greater visibility and actionable insights for the faster resolution of events.
Barry Hales, President, Matchpoint, said, “Matchpoint is honoured to bring KUB and TaKaDu together. We challenge ourselves to accurately define and fully
comprehend the needs of our clients. The KUB/TaKaDu solution will translate information into knowledge, thus providing a mutually beneficial relationship for
years to come.”
“We’re delighted to announce this important opportunity with KUB, representing the first US utility to join TaKaDu’s worldwide customer base across eleven
countries. KUB’s progressive approach to data evaluation and eagerness to improve its efficiency fits perfectly with the culture change TaKaDu is enabling,” said
Amir Peleg, TaKaDu’s Founder & CEO.
Page 6
PermaNet+ Leak Detectors Chosen For 3.6 Million Person Water
Utility
United Utilities turns to market to explore operational
technology options
Thames awards Siemens meter data software deal
Thames Water has agreed a contract with Siemens for an industry-specific software package to store and manage readings from all its customer meters. The
utility went out to tender for a new Meter Data Management System (MDMS), including software licences and licence maintenance, which will act a central
hub for data from the water company’s entire metering base (AMI, AMR & Manual). At the time of the procurement Thames said it would consider both cloud-
based and on-premise software products.
The new system is required to support Thames Water’s ambitious Smart Metering programme, launched in 2015, which will see the roll-out of 1,000,000 Smart
AMI Meters by the end of 2020, with the long-term objective that all customers should be equipped with smart meters.
The water company said out the outset that it intended to procure all products and services from a single supplier. The implementation and integration of the
future system with Thames Water back-end systems was not covered under the contract.
Siemens was one of three companies in the bidding for the work. No information has been disclosed on the value of the work under the contract.
Page 7
Britain’s largest water-only utility has partnered with multi-utility monitoring and telemetry specialist HWM (known as FCS in the United States) to target
significant reduction in leakage rates. In May 2017, Affinity Water will complete installation of 20,000 PermaNet+ fixed network telemetry systems to protect
its network, which currently serves 3.6 million people.
PermaNet+ permanently monitors water network infrastructure without extensive site visits, identifying leaks more quickly than traditional methods and
allowing for rapid deployment to fix any leaks that occur. This significantly reduces both water loss and the cost of identifying leaks within a water network.
“Using the HWM PermaNet+ solution, we can continuously monitor 25 percent of our network, identifying leaks in a matter of hours, rather than the days it
takes using conventional techniques and technologies,” said Drew Ritchie, managing director of wholesale operations at Affinity Water.
Data generated by the device is automatically sent to the user through a combination of GPRS cellular communication or SMS, removing the need to visit
sites for data collection. The unit also sends an audio file for remote monitoring and correlation to pinpoint the leak position. PermaNet+ installs entirely
underground, making it less intrusive and more practical for large-scale deployment.
“Of all the UK water companies, at Affinity Water we’ve set ourselves the largest percentage leakage reduction over the current five-year [AMP6] planning
period,” said Ritchie. “We’re achieving this with HWM’s PermaNet+, challenging industry thinking and methodologies to change the economics of finding leaks.”
United Utilities Operational Technology (OT) department has turned to the supply chain to explore the market for operational technology options – the depart-
ment’s role is to ensure that infrastructure is in place to automate, monitor and remote control UU’s field assets in line with operational requirements.
The water company looking to suppliers to understand the current market place and the delivery routes available to support delivery of OT projects and works.
The scope and scale of the works United Utilities is seeking vary from simple ICA (Instrumentation, Control and Automation)installations through to large
complex design and build projects including first time install, upgrade, development, integration and optimisation of existing OT infrastructure.
The company’s high level OT requirement is to have access to a number of 3rd party framework suppliers covering Support, Design & Build Expertise with de-
monstrable experience in a number of competence areas.
The frameworks will drive the delivery of new OT infrastructure and its associated installation, commissioning, testing and handover back to operational sites.
United Utilities has issued a Periodic Indicative Notice (PIN) seeking to gather information from suppliers with a capability to provide the services they need
either in part or in whole. At this stage the PIN is a request for information only. A future procurement is planned with a possible issue of a contract notice in
September followed by the start of award procedures in April 2018.
Expected initial contract duration will be 3 years with up to 5 extensions of a single year. The framework will involve the delivery of a wide range of contracts
valued between £20,000 and £3 million each.
The firm is proposing to hold a Supplier engagement day, dependent on the responses received.
Nivus launch new hybrid flow measurement sensor
Nivus, the specialist flow measurement supplier have recently launched their new
NivuFlow 7550 the measurement systems manufacturer from now on provides a
hybrid metering system for flow rate detection besides measurement systems based on
ultrasound and radar technology. In addition to flow velocity determination using radar
the transmitter is designed to detect velocities by using the ultrasonic cross
correlation method. So the complete measurement system is equipped with two flow
velocity sensors, one level sensor and the NivuFlow 7550 hybrid transmitter.
Depending on the sensor installation position and the filling level there are two basic
applications for hybrid metering: hybrid metering as measurement range extension (e.g.
impounding in canals) to make sure the measurement covers the entire range and hybrid
metering as redundant systems to increase accuracy.
The hybrid measurement system benefits from the advantages of both technologies.
Thanks to the ultrasonic cross correlation method the velocities are measured in various
flow levels. This not only enables to map the flow profile but also to increase the accuracy
of the entire system. The radar sensor is installed outside of or above the medium and
hence is ideally suited for applications featuring sedimentation. Measuring the surface
velocity using radar moreover helps to increase the determination of the hydraulic model
prevailing. Upon request the complete system is also available for use in Ex zone 1.
The compact transmitter design permits easy and space-saving installation in control cabinets using DIN rails. A field enclosure is available for outdoor use.
The graphic display and the transmitter’s intuitive operating concept allow quick and easy commissioning of the flow measurement system. Thanks to
extended diagnostic options running processes can be analysed professionally directly on site. Flow rates are calculated based on latest fluid-dynamical
models. Furthermore the unit provides remote maintenance options via Internet
Honeywell’s New Satellite-Based Connected Worker Solution
Keeps Remote Workers Safe
Honeywell recently announced a new satellite-based connected solution to help governments, companies and other organizations monitor the location and
safety of workers in remote locations.
Honeywell’s Personal Tracker utilizes Iridium’s low-earth orbit satellite network, the only satellite constellation that provides pole-to-pole coverage, which is
necessary for effective remote asset and personnel tracking. The mobile device allows companies to communicate with their workers or track assets anywhere
in the world – across oceans, airways and even polar regions.
“Those responsible for employees in remote locations, especially lone workers who may be performing risky work, increasingly need a reliable method to stay
connected to those workers to keep them safe and secure,” said Taylor Smith, president of Honeywell’s Workflow Solutions business. “Honeywell’s connected
worker technology and Iridium’s proven platform enable satellite communications from anywhere on Earth. This offers remote workers, such as workers on
offshore oil platforms or forestry service workers, peace-of-mind and provides their employers with a valuable communication and search-and-rescue tool for
emergency situations.”
Emergency services, maritime, military and oil and gas workers can share their location with GPS coordinates and send text messages using the enterprise-grade,
ultra-rugged device, which is certified to function in hazardous environments where explosions or a fire may occur due to flammable liquids or vapours. It can
be used as a stand-alone, two-way communications device or can be clipped to a backpack to serve as a tracking beacon. It can also be paired with an iPhone
so that users can access a Honeywell mobile app that offers features such as interactive SOS, messaging, push notifications, trip information and situational
awareness.
For example, in the event of an emergency, an organization can send push notifications to alert its workers – regardless of their location – and then track their
locations and provide updates as they seek shelter.
The Personal Tracker is exclusive to the Iridium® network. With Iridium’s two-way communication capabilities, even when used as a stand-alone alerting and
tracking beacon, the Personal Tracker can receive current location requests and configuration updates over the air.
“We are proud to work with Honeywell in enabling their connected worker technology, and support their commitment to lone worker safety,” said Bryan Hartin,
executive vice president of sales and marketing at Iridium. “This partnership comes at an exciting time for us as we are launching our next-generation global
constellation, Iridium NEXT, and continue to expand our growing portfolio of satellite-based solutions for the Internet of Things. The unique architecture of our
constellation makes it a natural fit over other providers for mobile applications, especially where safety is concerned. Providing reliable coverage is critical for
companies tracking employees and assets located in remote areas, and Honeywell’s new Personal Tracker will make that possible.”
The mobile device supports Honeywell’s ViewPoint software, a web-based platform that provides organizations with real-time visibility for tracking and
monitoring high-value assets such as vehicle fleets and cargo containers. The ViewPoint platform offers organizations and government users advanced features,
such as a 90-day tracking history, geofencing, scheduling reports, alert management and messaging.
Page 8
Water UK sets out cyber security principles
Servelec Technologies, a leading provider of business optimisation solutions has completed pioneering asset management research for the UK Water industry
on behalf of UKWIR (UK Water Industry Research). UKWIR’s ‘Long Term Investment in Infrastructure’ project began in May 2016 with the aim of presenting a
body of evidence for the long-term infrastructure needs of the UK water industry. The project, undertaken by asset management specialist George Heywood,
his team from Servelec Technologies and colleagues from Frontier Economics and Atkins Global, seeks to raise awareness of the issues with government and
industry stakeholders.
The report, which will be published by UKWIR soon, will show that UK water companies need to significantly increase levels of expenditure in infrastructure,
both in the medium and long-term if current service standards are to be maintained. Without increased expenditure in infrastructure the 350,000km of water
mains and 625,000km of sewers in the UK will begin to fail more often, the research shows.
Increased expenditure requires financing, which will need to be achieved through increases in consumer bills. Using a model of the way water companies are
financed in England and Wales, colleagues from Frontier Economics used Servelec Technologies’ analysis to estimate the effect the additional investment will
have on bills to be an additional 0.7% increase year-on-year to 2050.
Using Servelec Technologies’ asset management software PIONEER as an analytical tool, the project team was able to determine an acceptable level of invest-
ment based on a variety of short and long-term scenarios which included the effects of social and climatic changes and the potential benefits of future technol-
ogies.
Following the completion of the report, Technical Director George Heywood said: “We are pleased with the body of evidence we have provided to the UKWIR
Steering Group and we hope that the UK water industry as a whole will benefit from this research.
“The report will advise UK water companies, the Government and industry authorities of the level of investment that is required to achieve the replacement and
rehabilitation needed to offset deterioration of UK water networks due to age and use, and the subsequent impact on the consumer.
“The project team’s thorough analysis has made use of national asset databases, combined with deterioration, service, cost and optimisation models. It shows
that if the industry does not increase expenditure then bursts, interruptions, flooding and pollution will happen more regularly, in opposition to the increasing
service expectation of customers. Failing to increase expenditure now will result in significantly higher recovery costs in future years adding to the burden on the
consumer and network infrastructure.”
UK water companies will need to significantly increase
infrastructure investment, highlights Servelec Technologies
Page 9
Water UK, the body which represents all the UK water companies at both national and international level, has produced a set of principles and
recommendations to help its members address the risks posed to water and waste water services by cyber related threats.
Introducing the guidance, Water UK said the fast pace of the risks from and understanding of cyber threats means that the industry needs to be constantly
reviewing and revising its practices.
The report from the Water UK Cyber Security Good Practice Group, produced in collaboration with Defra and the National Cyber Security Centre, sets out six
good practice principles:
Principle 1: To have robust and accountable cyber security governance
Principle 2: To proactively manage cyber risk and compliance
Principle 3: To ensure all our people are cyber aware with suitable training and communication
Principle 4: To make best use of good threat intelligence
Principle 5: To improve incident response
Principle 6: To proactively manage procurement, third parties and the wider supply chain
Outside organisations pose “real and tangible threat to water industry”
Commenting on Principle 6, the guidance says that outside organisations pose a real and tangible threat to the water industry and its ability to remain resilient
to cyber-attack. This may be through partnerships or joint ventures, supply chain or sub-contractors or a more informal information sharing arrangement. Water
UK says it is important that the organisation concerned addresses these risks and manages their relationships with all third parties. Consideration should be
given to procurement, contract management and supply chain management. The consideration should include both an assessment of the suppliers with
greatest risks in both cyber and general information management.
Water UK went to explain that the UK water industry provides a unique challenge when it comes to implementing cyber security, commenting:
“The combination of critical national infrastructure, complex investment cycles and legacy hardware, alongside an evolving regulatory framework means that
most companies are now juggling priorities to address the risks identified alongside other significant investments. “
In March Defra separately published its Water Sector Cyber Security Strategy 2017-2021 summarising what water and sewerage companies need to do to
reduce the risks of cyber attacks. Click here to download Water UK’s Cyber security principles for the water industry
Feature Article:
The Art & Importance
of Calibration
Introduction
When I started my career, it was within an analytical laboratory and in that environment you are almost paranoid about calibration. Part of your job is make sure
that all of the tests that you are run are accurate. Everything has a calibration curve and samples are routine duplicated and check samples against standards
are run. It gets to a point that for some parameters you end up losing money as the cost of calibration standards used are so high, it’s necessary as the
consequences of getting a simple parameter such as pH wrong is absolutely unthinkable. Analytical Quality Control (AQC) becomes a part of your life and it is so
deeply ingrained in whatever you do that it becomes second nature. This is the life of someone within an analytical laboratory.
Moving to the Water Industry is a different way of thinking and this is especially the case within online instrumentation and yet getting things right isn’t just
about protecting your reputation and making sure that things are right it’s about protection both people and the environment. You can certainly argue that the
importance of getting an analysis down to a fraction of a decimal place is not so important as long as the end result is achieved and the product be it potable
water to customers or treated effluent to the environment is of good quality.
This is the importance of instrumentation and its calibration.
The principles of calibration
So, what is calibration?
If you ask a group of people you are bound to get a number of different answer so what do we actually mean when we say calibration. What’s the difference
between calibration and verification, when somebody says dry calibration and wet calibration then what exactly do they mean. Well to answer this let’s look at
an instrument and the path that data takes when it goes from what its actually measuring all the way to the screen which is undoubtedly in front of you right
now. Taking the instrument itself calibration is looking at what the instrument is actually measuring and comparing that against a national traceable standard
and checking what it is recording is actually correct. So, for example if we look at a very simple calibration procedure for flow measurement and look at a British
Standard Flume complete with a level based measurement device. In this application we can take, quite simply, a ruler and dip the fluid at the appropriate place
and ensure that what the level based device is recording is actually a true reflection of reality. If they both say the same depth then it can be said that the level
based measurement device (the secondary device) is calibrated, as long as the ruler that was used holds a calibration certificate that is in date. This is not to say
that the flow measurement installation is calibrated as the primary device (the flume itself) also needs to be checked for accuracy and uncertainty to check that
the flume is in good condition and is recording accurately.
This, at least to my understanding and definition, is what would be called a wet calibration. Albeit a simple one. Whether a ruler is used or with the greatest
accuracy a surveying kit is used as long as the reference device is of sufficient accuracy and is calibrated and traceable back to a national reference standard then
the calibration is valid.
What we are doing in this particular methodology is testing the accuracy of the measurement technique and making sure it is accurate as possible.
For on-line instrumentation this is of course not the end of the story as there are other factors that can affect the reading that is being produced. To understand
this error figure 1 shows a typical path of data from the sensor in the field to the screen in the office.
Figure 1 shows a very simplified diagram of the path of data from the medium that it is analysing, through the instrument, through the transmission from site
to office and to its eventual path to the telemetry system and the end users screen.
The initial sensing from the medium that is being measured to the instrument has been checked by the first stage of calibration, this is the accuracy of the
instrument itself. From the instrument the data gets converted to an electrical signal, most commonly an analogue signal ranging the data from an
electrical signal of 4mA to the maximum the instrument has been setup to read at 20mA. This electrical signal is transmitted through a communication route…
nowadays this can range from something as simple as a sim card and a GSM/GPRS signal to an on-site PLC system complete with telemetry outstation. This
transmits the electrical signal through a data collection system and converts the electrical signal back into an actual number in the telemetry system. For on-line
instrumentation, it is also necessary to calibrate this signal and check what is being received in the office location is the same as what is being recorded on site.
Figure 1: The path of data from sensor to screen
Page 10
This is what is commonly scaling calibration and is one of the techniques that would fall into a dry verification technique as it’s not actually testing the method
of measurement and the accuracy of the instrument itself it is testing the accuracy of the transmission method.
These are the simplest of all of the calibration methods but of course with some instrumentation it isn’t possible to use the simplest of techniques and it is
often necessary to use surrogate techniques. This is the case for electro-magnetic flow meters and if anyone has been lucky enough to go and see them being
made the accuracy of the measurement technique can quite clearly be understood. When each and every flow meter gets made the last step in the process is a
factory calibration. Electro-magnetic flow meter manufacturers spend vast amounts of money in ensuring the quality of their products are correct and the flow
rigs that are present in the factory are a work of supreme engineering. Every flow meter is basically calibrated with the same skill than an analytical chemist in
a laboratory uses when calibrating his or her equipment. This is the factory calibration and is hard wired into the instrument itself.
As it’s not possible to being a factory calibration into the field another method of calibration or what is termed verification is required. This verification is used
to determine whether or not an instrument is within tolerances of the original factory calibration and doesn’t actually check the accuracy of the flow meter
but checks that the meter is recording within specifications. The weakness of this technique is that the meter can be working within tolerances but not actually
recording accurately as the underlying conditions are not working. As a result it is necessary to use alternative methods of verifying the flow meter accuracy
are necessary to physically calibrate the instrument itself. Figure 3 shows two common methods which uses one flow meter to check the accuracy of the other.
With analytical instruments it is often necessary to employ different techniques again depending upon the type of analysis that is being employed for example
where a wet chemical method is being employed then a number of techniques can be used including using a traceable standard of known concentration which
is a technique that is often used in laboratories around the world or as per the technique using for electro-magnetic flow meter using a traceable instrument to
check an instrument. A lot of these instruments self-calibrate with a standard of known concentration but it is still necessary to check against an independent
standard from time to time.
The importance, cost and benefits of calibration
We’ve talked about the how to do calibration and the importance for it to be back to a known standard, preferably a national/international standard but the
question is why? Is it that important to be able to measure to an absolute accuracy or is “near enough” a case of being good enough. Is it really that important
to be absolutely accurate in what you measure.
Figure 2: A typical factory calibration certificate for an electro-magnetic flow meter
Figure 3: Two methods of electro-magnetic flow meter verification
Page 11
The answer is well not all of the time but it depends what you do and what you are using your instrument for. My general principle for instrumentation is if
its measuring something then the number that is being measured should be accurate but then I’m an engineer and I know that when it comes to designing
things the value of the data that is collected can vastly alter the designs of things. As an instrumentation specialist I am aware of this fact and so I do think that
instrumentation that actually produces a number should reflect the true situation or of course be marked as “For Indication Only”
A few scenarios to prove the point:
•	 A wastewater treatment works has a single dissolved oxygen probe (relatively common on single oxidation ditch sites) and the dissolved oxygen probe
hasn’t been calibrated. The reading is low by a single milligram per litre and the blowers are controlled by the dissolved oxygen reading. The consumption
of power and hence cost is significantly increased because of a 10 -minute calibration job.
•	 An electro-magnetic flow meter is electronically-verified every year and appears to be ok. An independent verification using a different flow meter reveals
a significant difference between the check meter and the in-situ meter. Investigation reveals that the line size has reduced by 20% due to fouling. After
cleaning the check meter and the in-situ meter agree.
•	 A level meter is reading the level in a wet well and the float probes that act as a backup are up for replacement and are not working. The level rises and
because somebody has made an error in the empty distance of the probe the wet well overflows as what was 100% in the past is only 80% now.
•	 A level-based flow meter has had its empty distance set on installation. A fresh calibration hasn’t happened two weeks later after a typical settling period.
As a result after he initial 2 week period the meter has bedded in and is now reading 2mm off, the primary measurement device is a 120° V notch as a result
the site appears to be flowing much higher than reality.
All of these scenarios are fabricated but a simple 10-minute calibration and verification of the measured result means that the data that is collected is trusted
to be accurate and can actually save thousands of pounds.
There is a cost to calibration and the equipment that a water operator has to buy and keep accurate can mount up with costs in the tens of thousands of pounds
per annum to ensure that the instrumentation is operating correctly however the cost of not ensuring that instrumentation is correct mounts up and by far
outweighs the cost of not undertaking calibration routines.
Discussion
Instrumentation and keeping it maintained and recording correctly is a specialist skill and instrumentation is a specialism in its own right. One of the most
dangerous situation in any industry is for an instrument to be in place and for that instrument to be unknowingly recording incorrectly. This is especially the
case as the Water Industry (and industry in general) is moving more and more towards a “Smart” or “Digital” era.
The cost of ensuring that instrumentation is recording correctly is relatively high when you consider the costs of purchase, installation, maintenance, calibration
and replacement but what this of course should drive is increasing the value of the instrumentation that we have and potentially decreasing the amount of
instrumentation so that the data and information that is gleaned from the asset base of instrumentation is as accurate as it needs to be to assist in increasing
the operational efficiency of the industry as it heads towards a new digital/smart age.
Suez wins Smart Water Company of the year at
Global Water Awards
Suez, the International Water Company, has recently won the Global Water Award for the Smart Water
Company 2017. The ceremony was held at Palacio de Cibeles, Madrid on 24th April. The winners were
announced in a ceremony presented by Nassim Nicholas Taleb.
The prize was collected by Carlos Campos, the Chief Operating Officer of Suez Advanced Solutions. Xylem
was given a distinction in the Smart Water Company Category.
Other winners on the night included
•	 Acciona for Water Company of the Year
•	 Water Planet for Breakthrough Water Technology Company of the Year
•	 Nairobi City Water and Sewerage Company for the Water Leaders Award
•	 Mattershift for the Water Idol Award
At the awards Mr Nassim Nicholas Taleb Former Trader, Risk Specialist and Author, delivered an informative speech on the subject of antifragile, stressing the
importance of “evolution, adaption and improvement from small mistakes”. Drawing from his experience as a trader, Taleb suggest we should “train mentally to face
a big, unforeseen crisis by being exposed to small mistakes and disruptions”. He was also joined on stage by Ron Keating, CEO of Evoqua.
Awards were presented to The Leading Utilities of the World, the latest initiative of the Global Water Leaders Group and is the Gold Standard for utility
performance. The Inaugural Meeting took place on 24 April sponsored by CH2M, where 6 utilities presented their achievements and were accepted into the
network by an advisory board - all of whom represent utilities that have an unimpeachable record of innovation and performance. Trophies were awarded to Mr.
Howard Neukrug, Advisory Board Chair of The Global Water Leaders Group advisory board and the new members accepted into The Leading Utilities of the World
Network this afternoon.
Page 12
Article:
The Need for Water Service Resilience
The need for adopting sustainable water resilience strategies is becoming more apparent than ever. By 2050, the global population living in cities will
increase from 50% today to 70%. A McKinsey study on transforming water economies reveals that cities are already facing increasing water stress, with
demand expanded to outstrip supply by 40% by 2030. On this note, according to Arup’s recent publication, Water Resilience for Cities, “Ensuring a
resilient water supply as climate patterns change and populations grow requires cities to introduce active water resource management measures.”
With this mind, city officials and water operators will need to take into account long-term thinking and planning, support the deployment and
implementation of ICT and smart water technologies, as well as collaborate with global industry stakeholders. As the Global Resilience Partnership
explains in their piece on fresh water resilience, “A 21st century approach to water and to development is one that builds resilience. This means that we
look for ways in which people at risk could actually thrive under recurrent water challenges – to anticipate, mitigate and rise above floods, rather than
being swept away from them.”
Let’s take a closer look at what’s involved in developing a resilient water management plan.
Defining Resilience
Common definitions of “water resilience” focus mostly on climate change and mitigating the impact of natural disasters. For example, according to the
UK water regulator, Ofwat, resilience is “the ability to cope with and recover from disruption, and anticipate trends and variability in order to maintain
services for people and protect the natural environment, now and in the future.”
Another key component highlighted by SWAN, the Smart Water Networks Forum, relates to “water service resilience,” which can be broken down into
four, key pillars and applied to both the water and wastewater sectors: (1) Safe Water – Quality; (2) Reliable Service – Customers; (3) Secure Systems – IT;
and (4) Efficient Operations – O&M.
The Four Key Pillars of Water Service Resilience
The above pillars can all be optimised by transforming collected network data into actionable information using smart water and wastewater
technologies, explored further below.
Pillar 1: Safe Water – Quality
Traditional water quality sampling relies on time consuming and often costly monitoring techniques such as ‘grab’ sampling and field/laboratory analysis.
However, there are now online sensors, which can communicate real-time data about various quality parameters to a software platform to rapidly locate
the source and spread of contamination. Such efforts help manage and avoid quality issues before customers are impacted. This is also relevant to the
wastewater industry, as there are technologies preventing harmful sewage overflows through the deployment of data technologies.
Pillar 2: Reliable Service – Customers
The concept of water service resilience doesn’t only refer to the infrastructure and the network itself, but also the end users that can be impacted
by water flow and quality – namely the customers themselves. More and more water utilities are already seeing the importance of improving online
customer engagement and are embracing the advent of smart water meter solutions and relevant smart leak detection technologies such as fixed,
acoustic sensors and remote alert systems.
Page 13
Pillar 3: Secure Systems – IT
When discussing water service resilience and the transition towards smart water networks, we must consider the importance of securing our systems from
an IT perspective. The move to smart water networks is supported by ICT, as automation and cybersecurity technologies and systems are helping reduce risks
involved in moving towards digital water and connected grids.
Pillar 4: Efficient Operations – O&M
Improving water service resilience will require utilities to maximise their operational resilience, including making strides towards adopting robust hardware,
predictive modelling systems, and making intelligence decisions that are based on data collected and analysed. These and similar efforts are essential when
looking to provide for more efficient O&M of water networks.
Securing Resilience
Building a sustainable water future will require not only understanding the now, but will require planning strategies 20-25 years down the line. According
to a joint Arup-Siemens report, to become resilient, cities will need to think in terms of robustness, redundancy, diversity and flexibility, responsiveness and
coordination. To help streamline the process, water utilities and policymakers should first consider defining their main water service resilience indicators and
goals, and then determine which individuals and/or team members will be needed in order to meet certain milestones. As this undertaking will require both
management and employee support and collaboration, it should be neither rushed nor launched from a top-down approach.
To effectively secure resilience, forming industry partnerships and collaborative platforms will be essential. By taking into account different global perspec-
tives and learning from best practices worldwide, cities and water utilities will be better equipped to handle the main shocks and stresses that infrastructure
networks are facing due to both climate change and increasing water demand.
Gaining a Global Perspective
We encourage all those interested in learning more and exploring the topic of water resilience to join us for the upcoming SWAN 2017 Conference from 9th
-10th
May in London. This will be the leading smart water conference of the year featuring 20 global water utility speakers from 13 different countries. Participants
will have the opportunity to hear about more in depth case studies about the four key pillars of water service resilience as well as contribute their own insights
on this increasingly important topic.
HydroNET Water Control Room wins prestigious Partner for
Water award 2017
The HydroNET Water Control Room in South Africa won the Partners for Water award 2017. The online water control room has been developed and implemented
by a Dutch- South African consortium, led by HydroLogic.
As a result of the successful introduction, over 25 South African organisations are currently using the HydroNET Water Control Room to monitor the current
situation of water systems and to respond to expected water usage and quality.
The Partners for Water award 2017 was handed to Leanne Reichard (right on top photo) and Bas Boterman (second left) of Hydrologic during the Waterproof
event in Maarssen, the Netherlands, on 13 April.
Partners for Water is a programme by the Dutch government to stimulate the use of Dutch innovative water-related solutions in foreign urban deltas and their
water supply systems. Over 80 projects funded by this programme competed for the prestigious ‘best project’ award.
Managing scarce water resources
South Africa suffers from water stress. Fresh-water demand is expected to exceed water availability by 2025. To efficiently manage the available water resources
and reduce the impacts, water managers need access to historic, current and forecasted water and weather information. The online HydroNET Water Control
Room translates terabytes of data from radars, satellites, and other monitoring sources into easy to understand online decision-support dashboards.
These dashboards empower water managers to make well-informed and transparent decisions for the sustainable management of their water systems.
The jury explained: “This consortium provided a measurable contribution to solving world-water problems”.
In her reaction to receiving the award Leanne Reichard, leader of the consortium and business director at Hydrologic, mentioned the importance of an online
control room in general: “It provides water authorities with the right data at the right time so they can take well informed decisions”.
Page 14
Remember when TVs were operated using analogue? Remember the vast difference it made when your television went over to digital – reception details like
the picture quality, number of channels and less programme interruptions?
In the same way the movement from analogue to digital in the world of television has delivered immense benefits, industrial instrumentation has had its fair
share of the same. Ease of communication and set up are just two. Others include familiar graphical displays which make it easier for users to operate their
devices.
Previous to the digital era, operators would simply get a fault light or a reading but no explanation of what was causing it. Today it is possible to get much more
information on what particular function is experiencing an issue. Digital instruments automatically self-check the validity of their data, helping operators to
pinpoint and report any difficulties encountered.
Digital communications vs Traditional communications
Digital communications have overcome the traditional issues caused with analogue transmission signals regarding scaling.
An electronic signal would have been, as a matter of fact, an electrical signal which represented a particular measurement range, such as 0 – 500 ml/s in a
flow metering application for example. The problem was that often there was a mismatch between the transmitting range of an instrument and the input
scaling range of the receiving instrument. This would create incorrect readings and could cause operators to waste their time being confused because there
were apparently lost measurements unaccounted for.
Digital values eliminate this problem. By sending zeroes and ones from A to B, the displayed value will always be a faithful representation of what’s happening
in the process being measured.
Another advantage of digital protocols is that you can combine multiple different values into the signal - with traditional analogue only one signal could be sent
at one time. Through digital, additional measurements can be sent along with the primary measurement such as density, temperature or pressure for example.
Data is king
Digital communications also enable operators to access rich diagnostics data which indicates whether an instrument needs servicing or not. An example is ABB’s
AquaMaster 3 with WITS DNP3, which enables remote access to diagnostics and configuration changes. So like a speedy doctor that writes a fast prescription,
if there are any problems with power management, or a sensor coil or sensor cable is broken, then the time the issue occurred and the exact location of the
affected device is sent to an engineer. In this way, engineers are only deployed as and when necessary, saving both time and money and reducing the effort
needed to track down and rectify a fault.
Have HART, you’re halfway there
Most instruments make a measurement, amplify it, convert it and then transmit it. In the past, there were possibilities of errors being introduced at each stage.
Digital technology means that the measurement is converted into a digital signal as quickly as possible so that the possibility of errors creeping in is reduced.
Unable to completely upgrade your system to digital? Fear not. It may be that your instruments include HART. HART stands for Highway Addressable
Remote Transducer and represents an ideal halfway house solution for organisations that would like to get more from their instruments without having to
completely upgrade to a digital system. Essentially it works through a digital signal being superimposed onto an analogue signal which still relies on an
analogue measurement.
Getting on the bus
Everyone has benefitted from the transition from electronic to microelectronic. In terms of bus-based systems most top end industries have used or are using
bus systems in some way.
The problem with bus-based protocols is their complexity. In traditional systems it was easy to test the signal. However, bus-based systems rely on being
correctly set up from the start. Making just one mistake anywhere when setting up a digital system could mean it won’t work.
Tracing the root of the problem can incur a lot of extra cost and time as operators will need to check everything. This may not be a problem for big companies
which have the resources in place to deal with such issues but it can present a major hurdle for smaller users where the right skills aren’t readily available.
A solution to this problem comes in the form of communication. Some engineers may be familiar with writing programs for PLCs but they won’t be familiar with
instrumentation. Likewise a lot of people who work with instruments are not familiar with PLCs. If these two distinct skill-sets can communicate about their
requirements then companies can further explore the possibilities that digital technology can offer.
Article:
How digitisation has opened up
new possibilities for
industrial measurement
Page 15
Living the future today
Future systems will differ. In fact if you’re wondering what future industrial technology will look like just have a look at the technology we use in our everyday
private lives. It is likely that industrial technology will go the same way, subject to careful analysis of the security implications.
In ABB’s own range of products, such developments are already apparent with features such as GSM technology which allows users to dial in to their flowmeter
remotely to obtain data and make configuration changes. This has been incorporated into ABB’s AquaMaster 3 flowmeter.
The use of smart portable devices for instrument configuration makes setting up hard devices in the field faster, simpler and less costly. Take the DHH805
handheld configurator for example, which has 2GB memory and a rechargeable battery with over 80 hours of battery life between charges.
The inclusion of simplified Human-Machine Interface based around mobile phone controls improves usability, making training and maintenance much quicker.
Whether you’re a process engineer, contractor or an instrumentation engineer, all ABB equipment will operate in the same way. Watch the video below to find
out more.
The inclusion of Windows interface technology on instruments also makes it easy to scroll through menus, make and change settings and navigate between
different data views. The SM500F has this format making it easy to master setting up and configuration.
Summary
Ultimately, digital technology is steadily helping to make life easier, giving us insights into what is being measured but a whole host of other operating
parameters and we can communicate with instrumentation with increasing simplicity. This in turn allows industry to make more intelligent decisions based
upon the digitisation of industry as a whole.
ABB and IBM partner in industrial artificial intelligence solutions
ABB and IBM have recently announced a strategic collaboration that brings together ABB’s industry leading digital offering, ABB Ability, with IBM Watson Internet
of Things cognitive capabilities to unlock new value for customers in utilities, industry and transport & infrastructure.
Customers will benefit from ABB’s deep domain knowledge and extensive portfolio of digital solutions combined with IBM’s expertise in artificial intelligence and
machine learning as well as different industry verticals. The first two joint industry solutions powered by ABB Ability and Watson will bring real-time cognitive
insights to the factory floor and smart grids.
“This powerful combination marks truly the next level of industrial technology, moving beyond current connected systems that simply gather data, to industrial
operations and machines that use data to sense, analyze, optimize and take actions that drive greater uptime, speed and yield for industrial customers,” said ABB
CEO Ulrich Spiesshofer. “With an installed base of 70 million connected devices, 70,000 digital control systems and 6,000 enterprise software solutions, ABB is a
trusted leader in the industrial space, and has a four decade long history of creating digital solutions for customers. IBM is a leader in artificial intelligence and
cognitive computing. Together, IBM and ABB will create powerful solutions for customers to benefit from the Fourth Industrial Revolution.”
New suite of breakthrough solutions
The new suite of breakthrough solutions developed by ABB and IBM will help companies address in a completely new way some of their biggest industrial
challenges, such as improving quality control, reducing downtime and increasing speed and yield of industrial processes. These solutions will move beyond
current connected systems that simply gather data, to cognitive industrial machines that use data to understand, sense, reason and take actions supporting
industrial workers to help eliminate inefficient processes and redundant tasks.
“This important collaboration with ABB will take Watson even deeper into industrial applications – from manufacturing, to utilities, to transportation and more,”
said Ginni Rometty, IBM Chairman, president and CEO. “The data generated from industrial companies’ products, facilities and systems holds the promise of
exponential advances in innovation, efficiency and safety. Only with Watson’s broad cognitive capabilities and our platform’s unique support for industries can
this vast new resource be turned into value, with trust. We are eager to work in partnership with ABB on this new industrial era.”
Bringing real-time cognitive insights to the factory floor
For example, ABB and IBM will leverage Watson’s artificial intelligence to help find defects via real-time production images that are captured through an ABB
system, and then analyzed using IBM Watson IoT for Manufacturing. Previously, these inspections were done manually, which was often a slow and error-prone
process. By bringing the power of Watson’s real time cognitive insights directly to the shop floor in combination with ABB’s industrial automation
technology, companies will be better equipped to increase the volume flowing through their production lines while improving accuracy and consistency. As parts
flow through the manufacturing process, the solution will alert the manufacturer to critical faults – not visible to the human eye – in the quality of assembly. This
enables fast intervention from quality control experts. Easier identification of defects impacts all goods on the production line, and helps improve a company’s
competitiveness while helping avoid costly recalls and reputational damage.
Bringing real-time cognitive insights to smart grids
In another example, ABB and IBM will apply Watson’s capabilities to predict supply patterns in electricity generation and demand from historical and weather
data, to help utilities optimize the operation and maintenance of today’s smart grids, which are facing the increased complexity created by the new balance of
conventional as well as renewable power sources. Forecasts of temperature, sunshine and wind speed will be used to predict consumption demand, which will
help utilities determine optimal load management as well as real-time pricing.
Page 16
Case Study:
Anglian Water uses mapping
tool for retrofit SuDS
As part of its plans to shape and develop its surface water management strategy, Anglian Water has been working with a specialist team at engineering and
design consultancy, Atkins, to look at the opportunities for installing Sustainable Drainage Systems (SuDS) within existing communities to manage surface water.
SuDS are increasingly being explored as a chosen option for managing surface water by water companies due to the range of wider benefits that they can
provide including the energy savings from the reduced pumping costs; the increase in green space improving local amenity; carbon reduction; and creating
headroom in the water infrastructure to allow for growth.
The Atkins team used its SuDS Studio toolkit to analyse 1,900km2
of catchments in the Anglian Water region to identify locations where SuDS could help manage
surface water.
The SuDS Studio toolkit is a unique geospatial tool that identifies feasible SuDS and then selects the most cost-beneficial feasible solution. It does this by
inputting a range of GIS data that defines the geospatial relationship between sources and runoff and locations that SuDS could be installed. The approach also
includes datasets on constraints (such as flood zones, listed buildings, topography etc.) to ensure the assessment is robust. It is different to other mapping tools
as it eliminates solutions using engineering criteria.
As a rapid assessment tool, it is a much more cost effective than the traditional approach, whereby areas previously had to be assessed individually by hand
/ boots on the ground. The tool also prioritises the opportunities for SuDS, which is extremely helpful to those using the tool, and provides information on
constraints associated with each site.
Using SuDS Studio at Anglian
In the case of Anglian Water, 16 different types of SuDS solutions were included as part of the assessment, along with the unit costs for each type of
solution. This ensured that Anglian Water was shown the most cost-effective solution for each site as the preferred option. To ensure the SuDS options would
be future-proofed from climate change and unpredictable weather, a number of climate change scenarios (including a 100 year plus climate change scenario)
were run through the model.
Representatives from Anglian Water were consulted throughout the course of project. The dataset, highlighting the options for SuDS retrofit opportunities, is
now available for staff at Anglian Water to use to help match the best solutions to the need, and shape its overall surface water strategy.
Not only can the tool be run quickly, saving time and money, it can also be re-run very easily. The key benefit for Anglian Water was that it was able to see all
the opportunities for SuDS across its entire operating area, enhancing its ability to make decisions about the best opportunities for the implementation of SuDS
and prioritising investment.
The scope of the SuDS Studio was demonstrated by providing the opportunity for Anglian Water to see not only where surface water could be removed but
also how to maximise the benefits of SuDS at the same time, such as how to improve the water or air quality, reduce noise or heat island effects and improve
biodiversity and amenity. Whilst these are tertiary requirements for SuDS, they are important aspects that add value to Anglian Water’s overall surface water
strategy.
The SuDS Studio project produced the following results for the water company:
•	 13.5 million feasible SuDS solutions were identified and mapped;
•	 Over 5.5 million cost effective SuDS solutions were short-listed;
•	 Analysis was undertaken of SuDS opportunities across different catchment types across Anglian Water’s entire operating region;
•	 As the model can rapidly scan large areas it has meant that SuDS solutions could be fast tracked for engineering and modelling; and
•	 The tool ensured the solutions identified would be resilient to climate change.
Next steps
The SuDS Studio outputs have given Anglian Water a much better understanding of the surface water removal potential for its entire region. This will support it
with its long-term strategy planning, and look at the opportunities for mitigating the future demands of growth, climate change and catchment creep together
with reducing flood risk, energy usage and improving water quality.
The data from the SuDS Studio project is now being incorporated and utilised by their scheme delivery teams to look for surface water removal opportunities
for a number of new projects.
Anglian Water sees that an essential and hugely important part of its plans is to work closely with their other flood risk partners, including lead local flood
authorities and district councils. Consequently Anglian Water will be sharing the opportunities highlighted by SuDS Studio with these partners to enable the
delivery of partnership funded opportunities.
A key part of its future plans is also the involvement of its customers. Implementing SuDS will be a sea-change from more traditional engineering solutions, and
it is a journey that they want their customers to understand and be involved with.
Page 17
Article:
The measurement of turbidity
& solids in wastewater
The measurement of turbidity is one of the most common parameters in the wastewater industry from its measurement as a surrogate parameter for
suspended solids in final effluent to its measurement as a surrogate for mixed liquor in activated sludge plant it forms the fundamental basis of the majority
of the operational solids measurement in the wastewater industry.
Why is Water turbid - a brief introduction
We say that a particular water sample is turbid when the sample is hazy
or cloudy. The main effect of the haziness is that we cannot see clearly
through the sample after a certain distance, as the distance over which it
is possible to see clearly decreases as the turbidity increases.
Turbidity is caused by material suspended in the water, which can
scatter or absorb light travelling through the water. Scattering is the
process by which light travelling in one direction is deflected by particles
in suspension into a different direction of travel.
Absorption is the reduction in the intensity of light as it travels through
the sample. In general the effect of turbidity is to increase the
amount of light seen at an angle with respect to the propagation of the
illumination, and a reduction in the amount of light seen through the
sample, as shown in Fig. 1.
In general, light is scattered by particles in suspension, such as sand,
organic particles, or microorganisms, whereas absorption is due to
dissolved materials. The presence of dissolved materials that absorb light is generally indicated by colour in the sample. The presence of absorbing material
affects the light equally in all directions, and has the effect of reducing the light intensity measured in any given direction for the particular wavelengths at
which the material absorbs, while other wavelengths are unaffected. This selective absorption leads to the brownish colour of water that contains a significant
amount of dissolved organic matter, because the dissolved organic matter absorbs the light in the blue end of the spectrum, leaving the red unaffected.
Scattering, on the other hand, is a somewhat more complicated phenomenon. When we illuminate a sample that contains particles in suspension (scatterers)
with a beam of light, some of the light will be deviated and re-emitted in different directions, leading to a distribution of light intensity that depends on the
angle at which we measure the light with respect to the direction of illumination. This is shown in Fig. 2.
The actual intensity of the scattered light, that is, how much of the incident light is scattered away from the direction of illumination, depends on the
refractive index difference between the particles and the water, and how many particles there are. We would expect that if we put the same number of silicon
dioxide particles and titanium dioxide particles in water, we would get a lot more scattered light from the titanium dioxide suspension than the silicon dioxide
suspension, because the refractive index of titanium dioxide is 2.5, while the refractive index of silicon dioxide is 1.45, and the refractive index of water is 1.33.
Another factor that influences the total amount of scattered light is the wavelength of the light used to illuminate the sample; shorter wavelengths are
scattered more effectively, and will produce a larger signal than longer wavelengths for the same sample.
Another feature of interest is the angular distribution of the scattered intensity, that is, how much light would we expect to see at a given scattering angle.
The main factor affecting the angular distribution of the scattered light is the relative size of the particles to the wavelength of the light used to illuminate
the particles. Fig. 3 shows the expected light distribution with angle when we illuminate a sample with a wavelength of 850 nm, the refractive index of the
particles is 1.45 and the refractive index of the medium (water) is 1.33. The x axis is the scattering angle measured as in Fig. 2, where 0° corresponds to light
that travels straight through the sample, and 180° corresponds to light that is scattered back towards the source. The y axis represents the relative intensity
of light at each angle.
Figure 1: Transmission, absorption and scattering of light by a turbid sample
Figure 2: Geomerty of Light Scattering
Page 18
Particles larger than the wavelength of the light (a 10 μm particle is used for this example), produce an intensity pattern that varies quite rapidly with the
scattering angle, with high peaks and deep troughs, but on the whole, most of the light is scattered in the forward direction. As the particle size changes, the
position of the peaks and troughs varies and the intensity of the forward-scattered light increases.
For particles of about the same size as the wavelength of light, the variation of the scattered intensity with angle is much slower (1 μm particle), and for
particles much smaller than the wavelength (100 nm particle), there is no angular dependency for the scattered light.
In a real sample, we would have a mixture of materials with different refractive indices and particle size distributions, as well as dissolved absorbing materials.
The total turbidity in such a system could be defined as the amount of light measured at a given angle. Defined in this way, the turbidity would be a result of
the amount of light scattered in that direction by each of the particles according to their size and refractive index, minus the light absorbed by the dissolved
materials.
Measuring Turbidity in Practice
In the previous section, we described how the turbidity of a water sample could be determined by illuminating the sample, and measuring the amount of light
scattered at a given angle. The problem, then, is to define a unit of turbidity that can be used to compare measurements from different devices and to design
devices that produce results that are directly comparable.
As we have seen the amount of light scattered in a given direction will depend on the refractive index of the particles in suspension, the distribution of
sizes of the particles, the wavelength of the light and the presence of material that absorbs the light used to illuminate the system. To be able to compare the
measurements from two instruments, we need to ensure that the same sample produces the same amount of light on the detector of both instruments. There
are these factors to consider:
•	 Sensitivity: both instruments must produce the same output when illuminated with the same amount of light
•	 Angular response: both instruments must be designed to collect light over the same angular aperture
•	 Illumination: both instruments must use a light source with the same wavelength distribution, so that they produce the same angular distribution of
scattered light, and are affected equally by absorption of light by the sample
Originally, instruments such as the Jackson turbidimeter aimed to produce a system that was repeatable in terms of sensitivity, by referring to a certain
standard sample, first the Jackson silica standard, and then the Formazin standard. However, with the advent of photoelectric detectors, the actual optical
design of the instrument became an important factor in the standardization of the measurement of turbidity.
Two standards aimed at helping the production of turbidimeters that are comparable to each other are currently available specifically, the EPA 180.11 method
and the ISO7027 standard. The purpose of these standards is to ensure that results obtained with a turbidimeter that has been designed to meet the standard
guidelines are comparable to the results of any other turbidimeter that meets the same guidelines.
Both standards use a scattering angle of 90°, which is called nephelometric arrangement, but each of them use a different wavelength and different
prescriptions on the geometry of the illumination and detection. Using detection at 90° reduces the effect of stray light and absorption.
The EPA standard was designed to harmonize the design of turbidimeters that used incandescent light sources, with illumination wavelengths peaking in the
green region of the spectrum. These devices work well at low turbidity values, owing to the shorter wavelength. However, they suffer some limitations when
significant amounts of dissolved organic matter are present, as shorter wavelengths are absorbed quite effectively by the dissolved organics.
The ISO standard, on the other hand, stipulates the use of light in the near infrared region. Using a longer wavelength reduces the effect of absorption by
organic contaminants on the measurement significantly. Another advantage of the ISO design is that the spectral distribution of the illumination source is more
Figure 3: Angular distribution of light scattered by particles of different sizes.
Page 19
tightly defined, as well as the optical layout, reducing the possibility of differences in reading between instruments designed to this standard.
Using turbidity to measure suspended solids
We have described how the turbidity of a sample is measured as the intensity of light scattered by the material suspended in the sample, and how the scattered
light intensity is proportional to the number of suspended particles, the suspended solids. Based on this, we should be able to use the turbidity of a sample to
infer the mass of particles in suspension that produce that level of turbidity. For a given sample, all that is needed is to produce a calibration curve that relates
the mass of suspended solids to the turbidity. This relation will be linear, as shown in Fig. 4.
In a general case, the slope of the linear relation will be sample dependent, as shown in Fig. 4 and that slope would be very difficult to calculate theoretically,
so it is normally determined by calibration.
Traditionally, the laboratory-based gravimetric procedure has been used for obtaining the data needed for calibration in accordance with ASTM method
D5907-103. In this procedure, the solids are filtered out from the water before being dried and then weighed to produce a value in mg/l for total suspended
solids. This measurement is then correlated with the turbidity measurement, with the resulting data being used to produce the calibration curve.
The problem of achieving a reliable calibration
Whilst the gravimetric procedure can be useful when trying to establish a relationship between total suspended solids and turbidity, a single sample based on
the technique will not, by itself, provide a complete or reliable picture of overall conditions. First and foremost, as a ‘one-off’ measurement, it will only ever
be representative of a certain set of conditions at a certain moment in time. A measurement obtained using the technique will therefore only be effective as a
general guide to an ideal set of conditions, which may not apply universally.
It is important to remember also that suspended solids levels can vary independently of the turbidity measurement. Turbidity, which is measured in NTU,
provides a measurement of the impact of suspended solids on the passage of light through water. Total suspended solids, which is measured in mg/l, is a
quantitative measurement of the concentration of suspended particles in a given sample. As such there is no single way of recognising the differences in the
size and/or composition of the suspended particles, or the impact that those particles may have on measuring turbidity.
A quantity of coal dust, for example, would have a different impact on turbidity than an identical quantity of silt, as they will scatter and absorb light in different
ways. For a given sample, it is possible to build a calibration curve to convert the turbidity value to a suspended solids value, as shown in Fig. 4.
This has a particular impact on processes with changing conditions that could affect the composition of the sample. Such changes will have a direct bearing on
the calculation of the coefficients in the calibration curve. If the composition or the particle size distribution of the sample changes, the slope will also change
and a new calibration will be required.
Calibration in practice
In a typical installation, the user will take grab samples from the process water, record the turbidity reading at the time, and measure the suspended solids
content of the grab sample using a laboratory method such as ASTM D5907-10.
The turbidity reading taken at the time the grab sample was obtained and the suspended solids value from the laboratory method can then be used to calculate
a conversion coefficient from turbidity to suspended solids as follows.
					 C = TSS
					 Turb
Figure 4: Relationship between suspended solids and turbidity for Fullers earth and kaolin.
Page 20
In this equation, c is the conversion coefficient, TSS is the suspended solids content and Turb
is the turbidity reading. Fig. 5 shows the values of laboratory measured TSS plotted against
the turbidity values read when the sample was taken for a large set of samples over several
months at a waste water treatment plant. Rather than sitting on a straight line, the points
form a cloud around a line of best fit. Using any single point from the cloud to calculate the
calibration coefficient would introduce a significant bias.
The user might be tempted to recalculate the conversion factor every time a new grab
sample is taken, in an effort to improve the accuracy of the suspended solids value inferred
from the turbidity reading.
In Fig. 6 (green triangles),
we show the value of the
c coefficient that would have
been obtained after each of
the individual measurements.
We can clearly see from this
figure that the conversion factor varies quite widely from measurement to measurement. The
variation of the conversion factor is a result of a combination of several factors, such as
sampling error when obtaining the grab sample, the repeatability error of the turbidity reading,
the laboratory error on the suspended solids value and so on.
If we were to recalculate the conversion factors after each measurement, there would be sudden
jumps in the inferred values of TSS from turbidity when the change in coefficient is applied as
shown in Fig. 7.
A better approach to the calculation of a reliable conversion factor would be to keep a history of
all pairs of turbidity/TSS readings, and recalculate the slope after each new point is obtained (the
black line in Fig. 6). However, such a process requires a certain level of skill from the operator, and
a process in place to update the calculation every time a grab sample is taken. The red line shows
the application of an adaptive filter that follows the trend of the raw data.
Obtaining a reliable TSS calibration for improved process control
Innovations in measurement technology are helping to overcome
the problems associated with obtaining a reliable calibration. The
‘Adaptive TSS calibration’ feature in ABB’s ATS430 turbidity sensor,
for example, provides a means to approximate the quality of the
coefficient obtained by progressively building up the calibration
coefficient every time an in-process calibration is performed.
Every time a new TSS value is input to the ATS430 sensor, a new
coefficient is calculated as a weighted average of the current
coefficient plus the new coefficient. Using the adaptive calibration
has the advantage that the calibration coefficient follows changes in
the process, but smooths out sudden jumps in the coefficient that
are more likely to be due to normal variations in the process, or
errors in the determination Fig. 7 shows the effect of using the
different approaches to calculating the conversion factor on the
value of TSS reported by the sensor. The orange line is the TSS
value that would be obtained if the factor was calculated only using
the point measurement as taken; the black line shows the TSS value
that would be obtained if the coefficient was built from a progressive
linear fit of the data, and the dark green line shows the TSS value
obtained using the adaptive fitting.
From the results shown in Fig. 7, it is easy to see that the adaptive
fitting provides a smoother time response of the process variable,
while at the same time following long term changes in the process.
Figure 5: Suspended solids content versus turbidity in an aeration lane at a
municipal waste water treatment plant.
Figure 6: Different strategies to calculate the suspended solids cali-
bration using the data from Fig. 5.
Figure 7: Effect of the change of calibration coefficient in the reported suspended solids value.
Page 21
May/ June 2017
Specification & Installation of Sensors
3rd
May 2017
Principality Stadium, Cardiff, Wales
Hosted by the Sensors for Water Interest Group
SWAN Conference 2017
9th
-10th
May 2017
Tower Hotel, London UK
Hosted by the SWAN Forum
Leakage
24rd
May 2017
NEL, Glasgow, Scotland
Hosted by the Sensors for Water Interest Group
12th
Specialized Conference in ICA
11th
-14th
June 2017
Quebec City, Canada
Hosted by the International Water Association
The Journey towards a Smart Water Network
22nd
June 2017
Etihad Stadium, Manchester
Hosted by ATi
July 2017
Low Cost Sensors
5rd
July 2017
University of Southampton, UK
Hosted by the Sensors for Water Interest Group
September 2017
Sensing in Water 2017
27th
-28th
September 2017
Nottingham Belfry, Nottingham, UK
Hosted by the Sensors for Water Interest Group
WEFTEC
30th September - 4th October 2017
McCormick Place, Chicago USA
Hosted by the Water Environment Federation
October 2017
Wetsus Congress
9th
- 10th
October 2017
Leeuwarden, Holland
Hosted by Wetsus
Page 22
Conferences, Events,
Seminars & Studies
Conferences, Seminars & Events
Specification & Installation of Sensors: Giving the
sensor the best chance
Where: 	 Principality Stadium, Cardiff
When: 		 3rd
May 2017
Getting reliable data from sensors and instruments relies on three key
steps – getting the right instrument for the job, installing it correctly and
performing appropriate on-going maintenance and calibration. This event
focuses on the first two steps. To get the right instrument needs a good
specification and understanding of the application. We will look at the role of
Standards, from MCERTS to ISOs, from the viewpoints of users and suppliers,
exploring whether they can be a barrier or an aide in improving quality and
innovation. We will also look at the role that robust technical evaluation can
play in procurement of instrumentation against a user specification for a
particular application. Good installation practice is also key to good
performance. Some of the latest findings related to installation of flowmeters
and other instruments will be presented.
Leakage
Where: 	 NEL Glasgow
When: 		 24rd
May 2017
Leakage of water from the distribution network continues to challenge the
water industry. Water companies are focussed on managing leakage to levels
that are acceptable to customers and justifiable on economic grounds. The
industry is also concerned about the long term resilience of water supply, and
see the need for lower levels of leakage to improve resilience. At the same
time, many water companies have incentivised targets to reduce leakage
further.
Therefore, there is a need for reliable and accurate measurement of leakage
in the distribution system; from the point of abstraction, through the treat-
ment process, and up to the customers’ stop tap. Improved measurements are
needed in terms of quantifying leakage in different areas, accurately pinpoint-
ing leakage in the network, and prioritising leakage repairs.
Sensors, measurement systems and data analytics play an important part
in managing and reducing leakage. This workshop will bring together water
companies, researchers and the supply chain to explore how new technologies
and systems can help to reduce leakage and save water.
Don’t miss the upcoming SWAN 7th Annual Conference to be held 9th
-10th
May, 2017 at the Tower Hotel in London. This
year’s conference will focus on creating smart, resilient water and wastewater systems, encompassing four key pillars:
•	 Safe water quality
•	 Reliable service
•	 Secure systems
•	 Efficient operations
This two-day event will feature 20 leading, global water utilities, including speakers from Veolia, Suez, PUB, American
Water, Unitywater, Essbio, AEGEA, FCC Aqualia, Vitens, City of Dakar, Taiwan Water Corporation, and the OECD.
SWAN is pleased to offer conference attendees a special rate of £185 inc VAT (inc breakfast) at the Tower Hotel. Note,
this rate will only be available until March 10th.
View the agenda here
Register here
Proudly Sponsored by
Page 23

Mais conteúdo relacionado

Mais procurados

Mais procurados (20)

WIPAC Monthly - June 2021
WIPAC Monthly - June 2021WIPAC Monthly - June 2021
WIPAC Monthly - June 2021
 
WIPAC Monthly - January 2021
WIPAC Monthly - January 2021WIPAC Monthly - January 2021
WIPAC Monthly - January 2021
 
WIPAC Monthly April 2021
WIPAC Monthly April 2021WIPAC Monthly April 2021
WIPAC Monthly April 2021
 
WIPAC Monthly - May 2021
WIPAC Monthly - May 2021WIPAC Monthly - May 2021
WIPAC Monthly - May 2021
 
WIPAC Monthly - January 2022
WIPAC Monthly - January 2022WIPAC Monthly - January 2022
WIPAC Monthly - January 2022
 
WIPAC Monthly - December 2020
WIPAC Monthly - December 2020WIPAC Monthly - December 2020
WIPAC Monthly - December 2020
 
WIPAC Monthly - February 2021
WIPAC Monthly - February 2021WIPAC Monthly - February 2021
WIPAC Monthly - February 2021
 
WIPAC Monthly July 2021
WIPAC Monthly July 2021WIPAC Monthly July 2021
WIPAC Monthly July 2021
 
3rd New Developments in IT & Water Conference - Final Conference Programme
3rd New Developments in IT & Water Conference - Final Conference Programme3rd New Developments in IT & Water Conference - Final Conference Programme
3rd New Developments in IT & Water Conference - Final Conference Programme
 
WIPAC Monthly February 2018
WIPAC Monthly   February 2018WIPAC Monthly   February 2018
WIPAC Monthly February 2018
 
Wipac monthly 49th edition october 2015
Wipac monthly 49th edition  october 2015Wipac monthly 49th edition  october 2015
Wipac monthly 49th edition october 2015
 
Yuval Lichi Intreview
Yuval Lichi IntreviewYuval Lichi Intreview
Yuval Lichi Intreview
 
Wipac Monthly 42nd edition February 2015
Wipac Monthly 42nd edition  February 2015Wipac Monthly 42nd edition  February 2015
Wipac Monthly 42nd edition February 2015
 
WIPAC Monthly - July 2017
WIPAC Monthly - July 2017WIPAC Monthly - July 2017
WIPAC Monthly - July 2017
 
WIPAC Monthly - March 2021
WIPAC Monthly - March 2021WIPAC Monthly - March 2021
WIPAC Monthly - March 2021
 
WIPAC Monthly - August 2017
WIPAC Monthly - August 2017WIPAC Monthly - August 2017
WIPAC Monthly - August 2017
 
WIPAC Monthly - September 2017
WIPAC Monthly - September 2017WIPAC Monthly - September 2017
WIPAC Monthly - September 2017
 
WIPAC Monthly July 2020
WIPAC Monthly July 2020WIPAC Monthly July 2020
WIPAC Monthly July 2020
 
WIPAC Monthly - November 2017
WIPAC Monthly - November 2017WIPAC Monthly - November 2017
WIPAC Monthly - November 2017
 
Sales Presentation
Sales PresentationSales Presentation
Sales Presentation
 

Semelhante a WIPAC Monthly - April 2017

Rapport veille salon-mobile IT & bigdata
Rapport veille salon-mobile IT & bigdataRapport veille salon-mobile IT & bigdata
Rapport veille salon-mobile IT & bigdataViedoc
 

Semelhante a WIPAC Monthly - April 2017 (20)

WIPAC Monthly - December 2016
WIPAC Monthly - December 2016WIPAC Monthly - December 2016
WIPAC Monthly - December 2016
 
WIPAC Monthly - May 2017
WIPAC Monthly - May 2017WIPAC Monthly - May 2017
WIPAC Monthly - May 2017
 
WIPAC Monthly October 2016
WIPAC Monthly October 2016WIPAC Monthly October 2016
WIPAC Monthly October 2016
 
WIPAC Monthly - July 2016
WIPAC Monthly - July 2016WIPAC Monthly - July 2016
WIPAC Monthly - July 2016
 
WIPAC Monthly - July 2023.pdf
WIPAC Monthly - July 2023.pdfWIPAC Monthly - July 2023.pdf
WIPAC Monthly - July 2023.pdf
 
WIPAC Monthly - January 2016
WIPAC Monthly - January 2016WIPAC Monthly - January 2016
WIPAC Monthly - January 2016
 
WIPAC Monthly - January 2023.pdf
WIPAC Monthly - January 2023.pdfWIPAC Monthly - January 2023.pdf
WIPAC Monthly - January 2023.pdf
 
WIPAC Monthly - May 2018
WIPAC Monthly - May 2018WIPAC Monthly - May 2018
WIPAC Monthly - May 2018
 
WIPAC Monthly - February 2020
WIPAC Monthly - February 2020WIPAC Monthly - February 2020
WIPAC Monthly - February 2020
 
WIPAC Monthly Magazine - February 2024
WIPAC Monthly Magazine  -  February 2024WIPAC Monthly Magazine  -  February 2024
WIPAC Monthly Magazine - February 2024
 
WIPAC Monthly August 2020
WIPAC Monthly August 2020WIPAC Monthly August 2020
WIPAC Monthly August 2020
 
WIPAC Monthly - November & December 2023
WIPAC Monthly - November & December  2023WIPAC Monthly - November & December  2023
WIPAC Monthly - November & December 2023
 
WIPAC Monthly January 2019
WIPAC Monthly  January 2019WIPAC Monthly  January 2019
WIPAC Monthly January 2019
 
WIPAC Monthly October 2018
WIPAC Monthly  October 2018WIPAC Monthly  October 2018
WIPAC Monthly October 2018
 
WIPAC Monthly May 2019
WIPAC Monthly May 2019WIPAC Monthly May 2019
WIPAC Monthly May 2019
 
Rapport veille salon-mobile IT & bigdata
Rapport veille salon-mobile IT & bigdataRapport veille salon-mobile IT & bigdata
Rapport veille salon-mobile IT & bigdata
 
WIPAC Monthly - September 2023
WIPAC Monthly - September 2023WIPAC Monthly - September 2023
WIPAC Monthly - September 2023
 
WIPAC Monthly - October 2023
WIPAC Monthly - October 2023WIPAC Monthly - October 2023
WIPAC Monthly - October 2023
 
WIPAC Monthly March 2020
WIPAC Monthly March 2020WIPAC Monthly March 2020
WIPAC Monthly March 2020
 
WIPAC Monthly April 2020
WIPAC Monthly April 2020WIPAC Monthly April 2020
WIPAC Monthly April 2020
 

Mais de Water Industry Process Automation & Control

Mais de Water Industry Process Automation & Control (19)

Water Industry Process Automation & Control Monthly - April 2024
Water Industry Process Automation & Control Monthly - April 2024Water Industry Process Automation & Control Monthly - April 2024
Water Industry Process Automation & Control Monthly - April 2024
 
WIPAC Monthly - January 2024.pdf
WIPAC Monthly - January 2024.pdfWIPAC Monthly - January 2024.pdf
WIPAC Monthly - January 2024.pdf
 
WIPAC Monthly - August 2023.pdf
WIPAC Monthly - August 2023.pdfWIPAC Monthly - August 2023.pdf
WIPAC Monthly - August 2023.pdf
 
WIPAC Monthly - June 2023.pdf
WIPAC Monthly - June 2023.pdfWIPAC Monthly - June 2023.pdf
WIPAC Monthly - June 2023.pdf
 
WIPAC Monthly - May 2023.pdf
WIPAC Monthly - May 2023.pdfWIPAC Monthly - May 2023.pdf
WIPAC Monthly - May 2023.pdf
 
WIPAC Monthly - April 2023.pdf
WIPAC Monthly - April 2023.pdfWIPAC Monthly - April 2023.pdf
WIPAC Monthly - April 2023.pdf
 
WIPAC Monthly - March 2023.pdf
WIPAC Monthly - March 2023.pdfWIPAC Monthly - March 2023.pdf
WIPAC Monthly - March 2023.pdf
 
WIPAC Monthly - February 2023.pdf
WIPAC Monthly - February 2023.pdfWIPAC Monthly - February 2023.pdf
WIPAC Monthly - February 2023.pdf
 
WIPAC Monthly - December 2022.pdf
WIPAC Monthly - December 2022.pdfWIPAC Monthly - December 2022.pdf
WIPAC Monthly - December 2022.pdf
 
WIPAC Monthly - October 2022.pdf
WIPAC Monthly - October 2022.pdfWIPAC Monthly - October 2022.pdf
WIPAC Monthly - October 2022.pdf
 
WIPAC Monthly - September 2022.pdf
WIPAC Monthly - September 2022.pdfWIPAC Monthly - September 2022.pdf
WIPAC Monthly - September 2022.pdf
 
WIPAC Monthly - August 2022.pdf
WIPAC Monthly - August 2022.pdfWIPAC Monthly - August 2022.pdf
WIPAC Monthly - August 2022.pdf
 
WIPAC Monthly - July 2022.pdf
WIPAC Monthly - July 2022.pdfWIPAC Monthly - July 2022.pdf
WIPAC Monthly - July 2022.pdf
 
WIPAC Monthly - June 2022.pdf
WIPAC Monthly - June 2022.pdfWIPAC Monthly - June 2022.pdf
WIPAC Monthly - June 2022.pdf
 
WIPAC Monthly - May 2022
WIPAC Monthly - May 2022WIPAC Monthly - May 2022
WIPAC Monthly - May 2022
 
WIPAC Monthly - April 2022.pdf
WIPAC Monthly - April 2022.pdfWIPAC Monthly - April 2022.pdf
WIPAC Monthly - April 2022.pdf
 
WIPAC Monthly - March 2022
WIPAC Monthly - March 2022WIPAC Monthly - March 2022
WIPAC Monthly - March 2022
 
WIPAC Monthly - February 2022
WIPAC Monthly - February 2022WIPAC Monthly - February 2022
WIPAC Monthly - February 2022
 
WIPAC Monthly - December 2021
WIPAC Monthly - December 2021WIPAC Monthly - December 2021
WIPAC Monthly - December 2021
 

Último

Extrusion Processes and Their Limitations
Extrusion Processes and Their LimitationsExtrusion Processes and Their Limitations
Extrusion Processes and Their Limitations120cr0395
 
Call Girls Service Nashik Vaishnavi 7001305949 Independent Escort Service Nashik
Call Girls Service Nashik Vaishnavi 7001305949 Independent Escort Service NashikCall Girls Service Nashik Vaishnavi 7001305949 Independent Escort Service Nashik
Call Girls Service Nashik Vaishnavi 7001305949 Independent Escort Service NashikCall Girls in Nagpur High Profile
 
Top Rated Pune Call Girls Budhwar Peth ⟟ 6297143586 ⟟ Call Me For Genuine Se...
Top Rated  Pune Call Girls Budhwar Peth ⟟ 6297143586 ⟟ Call Me For Genuine Se...Top Rated  Pune Call Girls Budhwar Peth ⟟ 6297143586 ⟟ Call Me For Genuine Se...
Top Rated Pune Call Girls Budhwar Peth ⟟ 6297143586 ⟟ Call Me For Genuine Se...Call Girls in Nagpur High Profile
 
University management System project report..pdf
University management System project report..pdfUniversity management System project report..pdf
University management System project report..pdfKamal Acharya
 
Call Girls Service Nagpur Tanvi Call 7001035870 Meet With Nagpur Escorts
Call Girls Service Nagpur Tanvi Call 7001035870 Meet With Nagpur EscortsCall Girls Service Nagpur Tanvi Call 7001035870 Meet With Nagpur Escorts
Call Girls Service Nagpur Tanvi Call 7001035870 Meet With Nagpur EscortsCall Girls in Nagpur High Profile
 
UNIT-III FMM. DIMENSIONAL ANALYSIS
UNIT-III FMM.        DIMENSIONAL ANALYSISUNIT-III FMM.        DIMENSIONAL ANALYSIS
UNIT-III FMM. DIMENSIONAL ANALYSISrknatarajan
 
Java Programming :Event Handling(Types of Events)
Java Programming :Event Handling(Types of Events)Java Programming :Event Handling(Types of Events)
Java Programming :Event Handling(Types of Events)simmis5
 
Russian Call Girls in Nagpur Grishma Call 7001035870 Meet With Nagpur Escorts
Russian Call Girls in Nagpur Grishma Call 7001035870 Meet With Nagpur EscortsRussian Call Girls in Nagpur Grishma Call 7001035870 Meet With Nagpur Escorts
Russian Call Girls in Nagpur Grishma Call 7001035870 Meet With Nagpur EscortsCall Girls in Nagpur High Profile
 
Booking open Available Pune Call Girls Pargaon 6297143586 Call Hot Indian Gi...
Booking open Available Pune Call Girls Pargaon  6297143586 Call Hot Indian Gi...Booking open Available Pune Call Girls Pargaon  6297143586 Call Hot Indian Gi...
Booking open Available Pune Call Girls Pargaon 6297143586 Call Hot Indian Gi...Call Girls in Nagpur High Profile
 
MANUFACTURING PROCESS-II UNIT-1 THEORY OF METAL CUTTING
MANUFACTURING PROCESS-II UNIT-1 THEORY OF METAL CUTTINGMANUFACTURING PROCESS-II UNIT-1 THEORY OF METAL CUTTING
MANUFACTURING PROCESS-II UNIT-1 THEORY OF METAL CUTTINGSIVASHANKAR N
 
Introduction to IEEE STANDARDS and its different types.pptx
Introduction to IEEE STANDARDS and its different types.pptxIntroduction to IEEE STANDARDS and its different types.pptx
Introduction to IEEE STANDARDS and its different types.pptxupamatechverse
 
VIP Call Girls Ankleshwar 7001035870 Whatsapp Number, 24/07 Booking
VIP Call Girls Ankleshwar 7001035870 Whatsapp Number, 24/07 BookingVIP Call Girls Ankleshwar 7001035870 Whatsapp Number, 24/07 Booking
VIP Call Girls Ankleshwar 7001035870 Whatsapp Number, 24/07 Bookingdharasingh5698
 
The Most Attractive Pune Call Girls Budhwar Peth 8250192130 Will You Miss Thi...
The Most Attractive Pune Call Girls Budhwar Peth 8250192130 Will You Miss Thi...The Most Attractive Pune Call Girls Budhwar Peth 8250192130 Will You Miss Thi...
The Most Attractive Pune Call Girls Budhwar Peth 8250192130 Will You Miss Thi...ranjana rawat
 
Sheet Pile Wall Design and Construction: A Practical Guide for Civil Engineer...
Sheet Pile Wall Design and Construction: A Practical Guide for Civil Engineer...Sheet Pile Wall Design and Construction: A Practical Guide for Civil Engineer...
Sheet Pile Wall Design and Construction: A Practical Guide for Civil Engineer...Dr.Costas Sachpazis
 
MANUFACTURING PROCESS-II UNIT-5 NC MACHINE TOOLS
MANUFACTURING PROCESS-II UNIT-5 NC MACHINE TOOLSMANUFACTURING PROCESS-II UNIT-5 NC MACHINE TOOLS
MANUFACTURING PROCESS-II UNIT-5 NC MACHINE TOOLSSIVASHANKAR N
 
(SHREYA) Chakan Call Girls Just Call 7001035870 [ Cash on Delivery ] Pune Esc...
(SHREYA) Chakan Call Girls Just Call 7001035870 [ Cash on Delivery ] Pune Esc...(SHREYA) Chakan Call Girls Just Call 7001035870 [ Cash on Delivery ] Pune Esc...
(SHREYA) Chakan Call Girls Just Call 7001035870 [ Cash on Delivery ] Pune Esc...ranjana rawat
 
College Call Girls Nashik Nehal 7001305949 Independent Escort Service Nashik
College Call Girls Nashik Nehal 7001305949 Independent Escort Service NashikCollege Call Girls Nashik Nehal 7001305949 Independent Escort Service Nashik
College Call Girls Nashik Nehal 7001305949 Independent Escort Service NashikCall Girls in Nagpur High Profile
 
Coefficient of Thermal Expansion and their Importance.pptx
Coefficient of Thermal Expansion and their Importance.pptxCoefficient of Thermal Expansion and their Importance.pptx
Coefficient of Thermal Expansion and their Importance.pptxAsutosh Ranjan
 
result management system report for college project
result management system report for college projectresult management system report for college project
result management system report for college projectTonystark477637
 

Último (20)

Extrusion Processes and Their Limitations
Extrusion Processes and Their LimitationsExtrusion Processes and Their Limitations
Extrusion Processes and Their Limitations
 
Call Girls Service Nashik Vaishnavi 7001305949 Independent Escort Service Nashik
Call Girls Service Nashik Vaishnavi 7001305949 Independent Escort Service NashikCall Girls Service Nashik Vaishnavi 7001305949 Independent Escort Service Nashik
Call Girls Service Nashik Vaishnavi 7001305949 Independent Escort Service Nashik
 
Top Rated Pune Call Girls Budhwar Peth ⟟ 6297143586 ⟟ Call Me For Genuine Se...
Top Rated  Pune Call Girls Budhwar Peth ⟟ 6297143586 ⟟ Call Me For Genuine Se...Top Rated  Pune Call Girls Budhwar Peth ⟟ 6297143586 ⟟ Call Me For Genuine Se...
Top Rated Pune Call Girls Budhwar Peth ⟟ 6297143586 ⟟ Call Me For Genuine Se...
 
University management System project report..pdf
University management System project report..pdfUniversity management System project report..pdf
University management System project report..pdf
 
Call Girls Service Nagpur Tanvi Call 7001035870 Meet With Nagpur Escorts
Call Girls Service Nagpur Tanvi Call 7001035870 Meet With Nagpur EscortsCall Girls Service Nagpur Tanvi Call 7001035870 Meet With Nagpur Escorts
Call Girls Service Nagpur Tanvi Call 7001035870 Meet With Nagpur Escorts
 
(INDIRA) Call Girl Aurangabad Call Now 8617697112 Aurangabad Escorts 24x7
(INDIRA) Call Girl Aurangabad Call Now 8617697112 Aurangabad Escorts 24x7(INDIRA) Call Girl Aurangabad Call Now 8617697112 Aurangabad Escorts 24x7
(INDIRA) Call Girl Aurangabad Call Now 8617697112 Aurangabad Escorts 24x7
 
UNIT-III FMM. DIMENSIONAL ANALYSIS
UNIT-III FMM.        DIMENSIONAL ANALYSISUNIT-III FMM.        DIMENSIONAL ANALYSIS
UNIT-III FMM. DIMENSIONAL ANALYSIS
 
Java Programming :Event Handling(Types of Events)
Java Programming :Event Handling(Types of Events)Java Programming :Event Handling(Types of Events)
Java Programming :Event Handling(Types of Events)
 
Russian Call Girls in Nagpur Grishma Call 7001035870 Meet With Nagpur Escorts
Russian Call Girls in Nagpur Grishma Call 7001035870 Meet With Nagpur EscortsRussian Call Girls in Nagpur Grishma Call 7001035870 Meet With Nagpur Escorts
Russian Call Girls in Nagpur Grishma Call 7001035870 Meet With Nagpur Escorts
 
Booking open Available Pune Call Girls Pargaon 6297143586 Call Hot Indian Gi...
Booking open Available Pune Call Girls Pargaon  6297143586 Call Hot Indian Gi...Booking open Available Pune Call Girls Pargaon  6297143586 Call Hot Indian Gi...
Booking open Available Pune Call Girls Pargaon 6297143586 Call Hot Indian Gi...
 
MANUFACTURING PROCESS-II UNIT-1 THEORY OF METAL CUTTING
MANUFACTURING PROCESS-II UNIT-1 THEORY OF METAL CUTTINGMANUFACTURING PROCESS-II UNIT-1 THEORY OF METAL CUTTING
MANUFACTURING PROCESS-II UNIT-1 THEORY OF METAL CUTTING
 
Introduction to IEEE STANDARDS and its different types.pptx
Introduction to IEEE STANDARDS and its different types.pptxIntroduction to IEEE STANDARDS and its different types.pptx
Introduction to IEEE STANDARDS and its different types.pptx
 
VIP Call Girls Ankleshwar 7001035870 Whatsapp Number, 24/07 Booking
VIP Call Girls Ankleshwar 7001035870 Whatsapp Number, 24/07 BookingVIP Call Girls Ankleshwar 7001035870 Whatsapp Number, 24/07 Booking
VIP Call Girls Ankleshwar 7001035870 Whatsapp Number, 24/07 Booking
 
The Most Attractive Pune Call Girls Budhwar Peth 8250192130 Will You Miss Thi...
The Most Attractive Pune Call Girls Budhwar Peth 8250192130 Will You Miss Thi...The Most Attractive Pune Call Girls Budhwar Peth 8250192130 Will You Miss Thi...
The Most Attractive Pune Call Girls Budhwar Peth 8250192130 Will You Miss Thi...
 
Sheet Pile Wall Design and Construction: A Practical Guide for Civil Engineer...
Sheet Pile Wall Design and Construction: A Practical Guide for Civil Engineer...Sheet Pile Wall Design and Construction: A Practical Guide for Civil Engineer...
Sheet Pile Wall Design and Construction: A Practical Guide for Civil Engineer...
 
MANUFACTURING PROCESS-II UNIT-5 NC MACHINE TOOLS
MANUFACTURING PROCESS-II UNIT-5 NC MACHINE TOOLSMANUFACTURING PROCESS-II UNIT-5 NC MACHINE TOOLS
MANUFACTURING PROCESS-II UNIT-5 NC MACHINE TOOLS
 
(SHREYA) Chakan Call Girls Just Call 7001035870 [ Cash on Delivery ] Pune Esc...
(SHREYA) Chakan Call Girls Just Call 7001035870 [ Cash on Delivery ] Pune Esc...(SHREYA) Chakan Call Girls Just Call 7001035870 [ Cash on Delivery ] Pune Esc...
(SHREYA) Chakan Call Girls Just Call 7001035870 [ Cash on Delivery ] Pune Esc...
 
College Call Girls Nashik Nehal 7001305949 Independent Escort Service Nashik
College Call Girls Nashik Nehal 7001305949 Independent Escort Service NashikCollege Call Girls Nashik Nehal 7001305949 Independent Escort Service Nashik
College Call Girls Nashik Nehal 7001305949 Independent Escort Service Nashik
 
Coefficient of Thermal Expansion and their Importance.pptx
Coefficient of Thermal Expansion and their Importance.pptxCoefficient of Thermal Expansion and their Importance.pptx
Coefficient of Thermal Expansion and their Importance.pptx
 
result management system report for college project
result management system report for college projectresult management system report for college project
result management system report for college project
 

WIPAC Monthly - April 2017

  • 1. Page 1 WIPAC MONTHLYThe Monthly Update from Water Industry Process Automation & Control www.wipac.org.uk Issue 4/2017 - April 2017
  • 2. Page 2 In this Issue From the Editor.................................................................................................................... 3 Industry News..................................................................................................................... 4 - 9 Highlights of the news of the month from the global water industry centred around the successes of a few of the companies in the global market. The Art & Importance of Calibration.................................................................................. 10-12 In this month’s feature article, group manager - Oliver Grievson, writes about the “Art” of calibration and what is a very important part of the industry now and what will become and even more important part of the future of the Water Industry as we enter the Smart/Digital Age The need for Water Service Resilience................................................................................. 13-14 In this article written by Shirley Ben-Dak of the Smart Water Networks forum we look at the four pillars of Resilience in the supply of potable water How digitisation has opened up new opportunities in industrial measurement................... 15-16 Alan Hunt from ABB discusses in this article how the digitisation of instrumentation has led to improvements in the way that instrumentation is used including the elimination of problems like scaling and the use of Hart & Bus protocols in this fascinating look into the opportunities that are available. Anglian Water uses mapping tool for retrofit SUDS........................................................... 17 This article discusses the collaboration between Anglian Water & engineering company, Atkins in identifying parts of the Anglian Water business that would benefit from sustainable urban drainage systems (SUDS) using the modelling tool SuDS Studio The measurment of Turbidty.......................................................................................... 18-21 In this White Paper by ABB the measurement of turbidity in the wastewater industry is discussed including the principals of the measurement technique as well as the challenges of getting accurate measurement and ensuring that it stays accurate by using calibration techniques. Workshops, Conferences & Seminars................................................................................... 22-23 The highlights of the conferences and workshops in the coming months WIPAC Monthly is a publication of the Water Industry Process Automation & Control Group. It is produced by the group manager and WIPAC Monthly Editor, Oliver Grievson. This is a free publication for the benefit of the Water Industry and please feel free to distribute to any who you may feel benefit. All enquires about WIPAC Monthly, including those who want to publish news or articles within these pages, should be directed to the publications editor, Oliver Grievson at olivergrievson@hotmail.com
  • 3. Page 3 From the Editor In a few weeks time the Water Industry Process & Automation & Control Group will celebrate its 6th anniversary and at these times I like to look back and see what the group has done and what it has contributed towards the Water Industry other than the 67 editorials that have featured in the front of every issue of WIPAC Monthly. All of this makes me look back at the discussions that we have had as a group of people and the direction that the industry is heading in. Looking back I think it fits to parody the Gartner Hype Cycle with something I’d like to phrase as the WIPAC information cycle. Whereas Gartner moves from a technology trigger through hype, expectations, disillusionment, enlightenment and productivity for me the journey of instrumentation to data to information also follows a cycle. Let me explain my thoughts and the stages that we go through. Firstly we have the initial trigger, the installation of instrumentation and we have data. Its exciting we can know what is going on through the day and night without having to take measurements all of the time. Believe it or not this can be right for a treatment plant or distribution/collection network. Instrumentation isn’t always the answer but if you want to act as we do in the modern water industry and have a “production factory” approach then you are bound to go down this line at some point. The second stage of course is receiving all of this data mirroring Gartner’s “Peak of Inflated Expectations.” From here we enter “the resistance to the effective use of instrumentation, the data isn’t valued as there is literally too much of it and we head towards a crucial point in time which is of course valuing the data. If the data isn’t used and isn’t valued then you might as well not have instrumentation. This is of course where things can fall down as if the data isn’t valued then the instruments stop working and we are forever stuck in “The Resistance phase” Stage four very much “The definition of Information,” knowing what we want to know and defining it bringing the data together and creating the information that we either need or we want to run our “production factories” efficiently which leads to the fifth and last stage the “plateau of informed decision making” where we are in a situation where the data & information are used in such a way that we have all the information that we need to hand to make the best decisions. The question is why aren’t we developing into a Smart Digitally based Water Industry quicker than we are at the moment. Perhaps its because there are areas of the industry that haven’t been through the cycle or perhaps its a case of differing development rates across the industry driven by differing needs. What it is safe to say is that some have been through and are starting to develop a Smart Digital way of working the case studies are starting to develop and the benefits of taking the approach is starting to be understood. For some it has been a journey that started more than six years ago and some people within the business have been working at it for the best part of forty years and the development of the first real instrumentation in the industry and it is possible that the journey that is starting to be taken will still be going in another forty years. The important thing to bear in mind though is that the first steps have been taken and as one step follows another then the industry will develop towards a Smart Digital age. What can drive us into a faster and faster pace? Case studies, understanding the benefits events like the ones that are happening in June with ATI in Manchester and in September with the Sensors for Water Interest Group. We are in exciting time with a journey to be taken and of course WIPAC will be with the industry every step of the way Have a good month Oliver
  • 4. NIVUS Wins Water Dragon Award 2016 Water industry BIM initiative short-listed for award After winning the regional heat at Severn Trent’s Headquarters back in September the manufacturer of high accurate flow measurement systems wins the national UK Innovation Award with their Cross Correlation Pipe Sensor. The NIVUS team picked up its award at the Future Water Association’s annual lunch which was held at the Pump Rooms in Leamington Spa on 23rd February 2017. The award winning flow sensor measures the flow directly within the pipe which is far superior to regular Clamp-On-Systems which can only meas- ure from the outside. Why go to the concert and only listen behind the door? Nivus advanced technology and superior signal quality equals more reliable measurement results. Considered a game changer the NIVUS solu- tion proves to be smart. Benefits are numerous, easy installation without shutting down the flow is distinctly advantageous as well as delivering a low carbon footprint. The judges were impressed by the unique flow sensing technology developed by NIVUS which creates an audio image of particles within the wastewater to increase the flow measurement accuracy. Furthermore they gave recognition for the easy installation which allows the insertion/removal without the need for ‘pipe shutdown’ as well as delivering the Totex based solution for the application favorably compared to existing flow measurement devices. And not least the judges also commended Alison Southwood and David Miles for a strong presentation clearly defining the business case. David Miles, Business Manager for NIVUS in the UK explains the importance of winning this award, “This recognition for our Cross Correlation Pipe Sensor comes at an exciting time for NIVUS as we are seeing some fantastic results on sites throughout the UK on both fresh and waste water systems. Combining our technology with existing applications is proving highly successful as for the first there is now a method for achieving a true and accurate measurement of flow” NIVUS UK Innovation Manager, Alison Southwood, convinced the audience with the advantages of the pipe sensor solution. She states, “Winning the Innovation Award is a reward for all the efforts we put in developing the high accurate and easy to handle measurement system. Now we are looking forward to using this valuable endorsement to promote the advantages of our smart flow measurement solution to a wider audience.” A whole-sector initiative to clarify the meaning of BIM in the water industry has been short-listed for a Utility Week Star Award for collaboration. Every water and sewerage company (WaSC) in England, Wales, Scotland and Northern Ireland joined trade association British Water and BIM4Water, a specialist volunteer group, to set a water industry framework for building information modelling (BIM). The WaSCs, responding to comments from the supply chain, worked together to review the national BIM standards and document an agreed definition of what BIM means to them as clients. The draft BIM Guidance for the Water Industry Owner Operator was formally launched for industry review at the 4th British Water BIM conference on 30 March 2017. BIM4Water and British Water represent members from across the water sector including WaSCs, equipment suppliers, designers and contractors. Since 2013, members have been grappling with the meaning of BIM and in particular what BIM means for water companies and their customers. Data sharing Andrew Cowell, chair of BIM4Water said, “BIM and the new Guidance are about information management and how the water industry gears up to sharing data and operating in a digital environment. It is significant that water utilities have pulled together and are recognising the push for clarification from the supply chain. “It is about a different way of working, with opportunities for efficiency in design, delivery and on-going maintenance and asset management. Better information can create more resilient business plans and support scenario planning. “Water companies are acknowledging that while there is no regulatory mandate for BIM, improving data sets will help them meet Ofwat regulatory targets and that there is a lot of value to be gained from having a strong digital strategy.” Paul Mullord, British Water’s UK Director says, “Suppliers have sent a consistent message to the utilities about the efficiency savings to be had if they adopt a more coherent and consistent approach to the information they require to operate and maintain their assets across the lifecycle. They have listened and, with this document, demonstrated what extraordinary leaps can be achieved when the whole sector works together.” The draft BIM Guidance can be downloaded here Page 4 Industry News
  • 5. First Of Its Kind Interactive Map Brings Together 40 Years Of Water Quality Data A new U.S. Geological Survey interactive map provides a comprehensive, long-term look at changes in the quality of our nation’s rivers and streams over the last four decades. For the first time, monitoring data collected by the USGS and 73 other organizations at almost 1,400 sites have been combined to provide a nationwide look at changes in the quality of our rivers and streams between the 1972 passage of the Clean Water Act and 2012. Federal, state, and local agencies have invested billions of dollars since passage of the Act to reduce the amount of pollution entering rivers and streams that millions of Americans rely on for drinking water, recreation, and irrigation. Tracking changes in the quality of these waterways over multiple decades is crucial for evaluating the effectiveness of pollution control efforts and protecting the nation’s water resources into the future. The interactive map can be used to see whether 51 water-quality constituents, like nutrients and pesticides, and 38 aquatic-life metrics, like the types and numbers of fish, macroinvertebrates, and algae, have increased, decreased, or remained the same at nearly 1,400 sites between 1972 and 2012. For example, the phaseout of the insecticide diazinon for residential and some agricultural uses was initiated in 2000 and has led to widespread reductions in concentrations in U.S. streams, which can be seen on the map during the trend period from 2002 to 2012. The map summarizes the first phase of the study — in which the USGS identifies streams that have been monitored consistently for long periods and reports the trends in those streams. In the second phase, to take place over the next several years, the USGS will assess whether and where billions in investments in pollution control have been effective, identify major causes of trends in U.S. stream quality, provide details on which chemicals are increasing or decreasing, and highlight whether any drinking water sources or aquatic ecosystems are at increased risk. A new USGS interactive map provides a long-term look at changes in the quality of our nation’s rivers and streams, using data from over 70 organizations. Go online and see how 51 water-quality metrics and 38 aquatic-life metrics at nearly 1,400 sites have changed over the last 40 years. This map was developed by the USGS National Water-Quality Assessment Project, which conducts regional and national assessments of the nation’s water quality to provide an understanding of current water-quality conditions, whether conditions are getting better or worse over time, and how natural processes and human activities affect those conditions. Page 5
  • 6. Welsh Water rolls out smart meter trial as part of EU-funded WISDOM project Welsh Water is installing 250 new digital “smart” meters in Grangetown, Cardiff – with plans for another 3,000 to be fitted over the next three months – as part of an EU-funded water usage project involving partners from across Europe. The meters will measure water usage wirelessly at selected properties in Cardiff, sending information back to the customers every hour so that they can monitor how much they are using, see peak usage times and help manage their household utility costs. The information also gets sent back to Welsh Water who will be able to detect if any leaks or bursts have occurred at the property and get the leak repaired much more quickly, reducing wastage and saving customers money. Andy Blackhall, Water Demand Manager at Welsh Water said: “In our recent customer engagement surveys, customers have informed us that they would like to see us trialling new and innovative ways to help reduce the demand for water, and to help customers manage their bills.” “We will use the results of the trial to help inform our future long-term business planning activity, and ensure we understand fully the costs and benefits of delivering a world-class service to our customers.” “All customers in the Grangetown trial will be offered a free water efficiency and usage survey, along with installation of free water saving products, such as a water butt or more efficient shower head where required.” The new smart metres will be the latest innovation used by Welsh Water in a bid to reduce costs and keep customers’ bills low. Reducing wastage is one of the company’s top priorities with leakage rates halved since the early 1990s from 400 megalitres per day (Ml/d) to around 180 Ml/d. Welsh Water find and fix around 26,000 leaks a year . Moti Reuben at Channel View in Cardiff The smart meter trial is part of a wider EU funded WISDOM project - Water Analytics & Intelligent Sensing For Demand Optimised Management - which has received funding from the European Union’s Seventh Framework Programme for research, technological development and demonstration. As part of the project funded the utility came together with ARAD Water Metering Group under the direction of UK Director Simon Ogden and The City of Cardiff Council to implement SMART Metering. As part of this ARAD sent their signal specialist Moti Reuben from their headquarters in Israel to help survey the Cardiff Pilot Area for the best signal setup. The WISDOM project has developed and tested an intelligent ICT system that enables “just in time” actuation and monitoring of the water value chain from water abstraction to discharge, in order to optimise the management of water resources. Other WISDOM pilots undertaken in Wales include: • A study of WISDOM’s applicability to the problem of optimizing clean water networks by attempting to optimize, in real time, pumping schedules and service reservoir levels so as to reduce energy consumption. • • How WISDOM can enable the application of data driven modelling techniques to water network data – the specific focus in the trial was predicting the occurrence of combined sewer overflows (CSOs) in waste water networks. Click here for more information about the WISDOM project TaKaDu Signs First US Contract With Knoxville Utilities Board (KUB), Tennessee, USA TaKaDu, a global leader in Integrated Event Management solutions for the water industry, announced recently that Knoxville Utilities Board (KUB) has signed a contract with TaKaDu, following a public tender, as part of its concerted efforts to improve customer service and reduce non-revenue water (NRW). The project is being managed by Matchpoint, one of TaKaDu’s distributors in the North American region. KUB provides electric, gas, water, and wastewater services to Knoxville and parts of seven surrounding counties in the East Tennessee Valley. KUB invests heavily in enhancing its infrastructure. In its water distribution system, for example, it has created District Metered Areas (DMAs) to partition the network, added many sensors and meters for flow and pressure monitoring, and replaced other assets. The next natural step was to decide how to transform data on the water system into operational knowledge, and TaKaDu was chosen to manage the vast volumes of sensor data providing near real-time analysis and alerts for network incidents of multiple types. TaKaDu’s automated cloud-based service enables utilities to detect, analyze and manage network events and incidents such as leaks, bursts, faulty assets, telemetry and data issues, operational failures and more. Converting raw data into knowledge, TaKaDu provide greater visibility and actionable insights for the faster resolution of events. Barry Hales, President, Matchpoint, said, “Matchpoint is honoured to bring KUB and TaKaDu together. We challenge ourselves to accurately define and fully comprehend the needs of our clients. The KUB/TaKaDu solution will translate information into knowledge, thus providing a mutually beneficial relationship for years to come.” “We’re delighted to announce this important opportunity with KUB, representing the first US utility to join TaKaDu’s worldwide customer base across eleven countries. KUB’s progressive approach to data evaluation and eagerness to improve its efficiency fits perfectly with the culture change TaKaDu is enabling,” said Amir Peleg, TaKaDu’s Founder & CEO. Page 6
  • 7. PermaNet+ Leak Detectors Chosen For 3.6 Million Person Water Utility United Utilities turns to market to explore operational technology options Thames awards Siemens meter data software deal Thames Water has agreed a contract with Siemens for an industry-specific software package to store and manage readings from all its customer meters. The utility went out to tender for a new Meter Data Management System (MDMS), including software licences and licence maintenance, which will act a central hub for data from the water company’s entire metering base (AMI, AMR & Manual). At the time of the procurement Thames said it would consider both cloud- based and on-premise software products. The new system is required to support Thames Water’s ambitious Smart Metering programme, launched in 2015, which will see the roll-out of 1,000,000 Smart AMI Meters by the end of 2020, with the long-term objective that all customers should be equipped with smart meters. The water company said out the outset that it intended to procure all products and services from a single supplier. The implementation and integration of the future system with Thames Water back-end systems was not covered under the contract. Siemens was one of three companies in the bidding for the work. No information has been disclosed on the value of the work under the contract. Page 7 Britain’s largest water-only utility has partnered with multi-utility monitoring and telemetry specialist HWM (known as FCS in the United States) to target significant reduction in leakage rates. In May 2017, Affinity Water will complete installation of 20,000 PermaNet+ fixed network telemetry systems to protect its network, which currently serves 3.6 million people. PermaNet+ permanently monitors water network infrastructure without extensive site visits, identifying leaks more quickly than traditional methods and allowing for rapid deployment to fix any leaks that occur. This significantly reduces both water loss and the cost of identifying leaks within a water network. “Using the HWM PermaNet+ solution, we can continuously monitor 25 percent of our network, identifying leaks in a matter of hours, rather than the days it takes using conventional techniques and technologies,” said Drew Ritchie, managing director of wholesale operations at Affinity Water. Data generated by the device is automatically sent to the user through a combination of GPRS cellular communication or SMS, removing the need to visit sites for data collection. The unit also sends an audio file for remote monitoring and correlation to pinpoint the leak position. PermaNet+ installs entirely underground, making it less intrusive and more practical for large-scale deployment. “Of all the UK water companies, at Affinity Water we’ve set ourselves the largest percentage leakage reduction over the current five-year [AMP6] planning period,” said Ritchie. “We’re achieving this with HWM’s PermaNet+, challenging industry thinking and methodologies to change the economics of finding leaks.” United Utilities Operational Technology (OT) department has turned to the supply chain to explore the market for operational technology options – the depart- ment’s role is to ensure that infrastructure is in place to automate, monitor and remote control UU’s field assets in line with operational requirements. The water company looking to suppliers to understand the current market place and the delivery routes available to support delivery of OT projects and works. The scope and scale of the works United Utilities is seeking vary from simple ICA (Instrumentation, Control and Automation)installations through to large complex design and build projects including first time install, upgrade, development, integration and optimisation of existing OT infrastructure. The company’s high level OT requirement is to have access to a number of 3rd party framework suppliers covering Support, Design & Build Expertise with de- monstrable experience in a number of competence areas. The frameworks will drive the delivery of new OT infrastructure and its associated installation, commissioning, testing and handover back to operational sites. United Utilities has issued a Periodic Indicative Notice (PIN) seeking to gather information from suppliers with a capability to provide the services they need either in part or in whole. At this stage the PIN is a request for information only. A future procurement is planned with a possible issue of a contract notice in September followed by the start of award procedures in April 2018. Expected initial contract duration will be 3 years with up to 5 extensions of a single year. The framework will involve the delivery of a wide range of contracts valued between £20,000 and £3 million each. The firm is proposing to hold a Supplier engagement day, dependent on the responses received.
  • 8. Nivus launch new hybrid flow measurement sensor Nivus, the specialist flow measurement supplier have recently launched their new NivuFlow 7550 the measurement systems manufacturer from now on provides a hybrid metering system for flow rate detection besides measurement systems based on ultrasound and radar technology. In addition to flow velocity determination using radar the transmitter is designed to detect velocities by using the ultrasonic cross correlation method. So the complete measurement system is equipped with two flow velocity sensors, one level sensor and the NivuFlow 7550 hybrid transmitter. Depending on the sensor installation position and the filling level there are two basic applications for hybrid metering: hybrid metering as measurement range extension (e.g. impounding in canals) to make sure the measurement covers the entire range and hybrid metering as redundant systems to increase accuracy. The hybrid measurement system benefits from the advantages of both technologies. Thanks to the ultrasonic cross correlation method the velocities are measured in various flow levels. This not only enables to map the flow profile but also to increase the accuracy of the entire system. The radar sensor is installed outside of or above the medium and hence is ideally suited for applications featuring sedimentation. Measuring the surface velocity using radar moreover helps to increase the determination of the hydraulic model prevailing. Upon request the complete system is also available for use in Ex zone 1. The compact transmitter design permits easy and space-saving installation in control cabinets using DIN rails. A field enclosure is available for outdoor use. The graphic display and the transmitter’s intuitive operating concept allow quick and easy commissioning of the flow measurement system. Thanks to extended diagnostic options running processes can be analysed professionally directly on site. Flow rates are calculated based on latest fluid-dynamical models. Furthermore the unit provides remote maintenance options via Internet Honeywell’s New Satellite-Based Connected Worker Solution Keeps Remote Workers Safe Honeywell recently announced a new satellite-based connected solution to help governments, companies and other organizations monitor the location and safety of workers in remote locations. Honeywell’s Personal Tracker utilizes Iridium’s low-earth orbit satellite network, the only satellite constellation that provides pole-to-pole coverage, which is necessary for effective remote asset and personnel tracking. The mobile device allows companies to communicate with their workers or track assets anywhere in the world – across oceans, airways and even polar regions. “Those responsible for employees in remote locations, especially lone workers who may be performing risky work, increasingly need a reliable method to stay connected to those workers to keep them safe and secure,” said Taylor Smith, president of Honeywell’s Workflow Solutions business. “Honeywell’s connected worker technology and Iridium’s proven platform enable satellite communications from anywhere on Earth. This offers remote workers, such as workers on offshore oil platforms or forestry service workers, peace-of-mind and provides their employers with a valuable communication and search-and-rescue tool for emergency situations.” Emergency services, maritime, military and oil and gas workers can share their location with GPS coordinates and send text messages using the enterprise-grade, ultra-rugged device, which is certified to function in hazardous environments where explosions or a fire may occur due to flammable liquids or vapours. It can be used as a stand-alone, two-way communications device or can be clipped to a backpack to serve as a tracking beacon. It can also be paired with an iPhone so that users can access a Honeywell mobile app that offers features such as interactive SOS, messaging, push notifications, trip information and situational awareness. For example, in the event of an emergency, an organization can send push notifications to alert its workers – regardless of their location – and then track their locations and provide updates as they seek shelter. The Personal Tracker is exclusive to the Iridium® network. With Iridium’s two-way communication capabilities, even when used as a stand-alone alerting and tracking beacon, the Personal Tracker can receive current location requests and configuration updates over the air. “We are proud to work with Honeywell in enabling their connected worker technology, and support their commitment to lone worker safety,” said Bryan Hartin, executive vice president of sales and marketing at Iridium. “This partnership comes at an exciting time for us as we are launching our next-generation global constellation, Iridium NEXT, and continue to expand our growing portfolio of satellite-based solutions for the Internet of Things. The unique architecture of our constellation makes it a natural fit over other providers for mobile applications, especially where safety is concerned. Providing reliable coverage is critical for companies tracking employees and assets located in remote areas, and Honeywell’s new Personal Tracker will make that possible.” The mobile device supports Honeywell’s ViewPoint software, a web-based platform that provides organizations with real-time visibility for tracking and monitoring high-value assets such as vehicle fleets and cargo containers. The ViewPoint platform offers organizations and government users advanced features, such as a 90-day tracking history, geofencing, scheduling reports, alert management and messaging. Page 8
  • 9. Water UK sets out cyber security principles Servelec Technologies, a leading provider of business optimisation solutions has completed pioneering asset management research for the UK Water industry on behalf of UKWIR (UK Water Industry Research). UKWIR’s ‘Long Term Investment in Infrastructure’ project began in May 2016 with the aim of presenting a body of evidence for the long-term infrastructure needs of the UK water industry. The project, undertaken by asset management specialist George Heywood, his team from Servelec Technologies and colleagues from Frontier Economics and Atkins Global, seeks to raise awareness of the issues with government and industry stakeholders. The report, which will be published by UKWIR soon, will show that UK water companies need to significantly increase levels of expenditure in infrastructure, both in the medium and long-term if current service standards are to be maintained. Without increased expenditure in infrastructure the 350,000km of water mains and 625,000km of sewers in the UK will begin to fail more often, the research shows. Increased expenditure requires financing, which will need to be achieved through increases in consumer bills. Using a model of the way water companies are financed in England and Wales, colleagues from Frontier Economics used Servelec Technologies’ analysis to estimate the effect the additional investment will have on bills to be an additional 0.7% increase year-on-year to 2050. Using Servelec Technologies’ asset management software PIONEER as an analytical tool, the project team was able to determine an acceptable level of invest- ment based on a variety of short and long-term scenarios which included the effects of social and climatic changes and the potential benefits of future technol- ogies. Following the completion of the report, Technical Director George Heywood said: “We are pleased with the body of evidence we have provided to the UKWIR Steering Group and we hope that the UK water industry as a whole will benefit from this research. “The report will advise UK water companies, the Government and industry authorities of the level of investment that is required to achieve the replacement and rehabilitation needed to offset deterioration of UK water networks due to age and use, and the subsequent impact on the consumer. “The project team’s thorough analysis has made use of national asset databases, combined with deterioration, service, cost and optimisation models. It shows that if the industry does not increase expenditure then bursts, interruptions, flooding and pollution will happen more regularly, in opposition to the increasing service expectation of customers. Failing to increase expenditure now will result in significantly higher recovery costs in future years adding to the burden on the consumer and network infrastructure.” UK water companies will need to significantly increase infrastructure investment, highlights Servelec Technologies Page 9 Water UK, the body which represents all the UK water companies at both national and international level, has produced a set of principles and recommendations to help its members address the risks posed to water and waste water services by cyber related threats. Introducing the guidance, Water UK said the fast pace of the risks from and understanding of cyber threats means that the industry needs to be constantly reviewing and revising its practices. The report from the Water UK Cyber Security Good Practice Group, produced in collaboration with Defra and the National Cyber Security Centre, sets out six good practice principles: Principle 1: To have robust and accountable cyber security governance Principle 2: To proactively manage cyber risk and compliance Principle 3: To ensure all our people are cyber aware with suitable training and communication Principle 4: To make best use of good threat intelligence Principle 5: To improve incident response Principle 6: To proactively manage procurement, third parties and the wider supply chain Outside organisations pose “real and tangible threat to water industry” Commenting on Principle 6, the guidance says that outside organisations pose a real and tangible threat to the water industry and its ability to remain resilient to cyber-attack. This may be through partnerships or joint ventures, supply chain or sub-contractors or a more informal information sharing arrangement. Water UK says it is important that the organisation concerned addresses these risks and manages their relationships with all third parties. Consideration should be given to procurement, contract management and supply chain management. The consideration should include both an assessment of the suppliers with greatest risks in both cyber and general information management. Water UK went to explain that the UK water industry provides a unique challenge when it comes to implementing cyber security, commenting: “The combination of critical national infrastructure, complex investment cycles and legacy hardware, alongside an evolving regulatory framework means that most companies are now juggling priorities to address the risks identified alongside other significant investments. “ In March Defra separately published its Water Sector Cyber Security Strategy 2017-2021 summarising what water and sewerage companies need to do to reduce the risks of cyber attacks. Click here to download Water UK’s Cyber security principles for the water industry
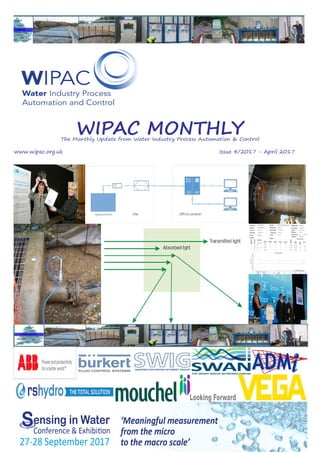
  • 10. Feature Article: The Art & Importance of Calibration Introduction When I started my career, it was within an analytical laboratory and in that environment you are almost paranoid about calibration. Part of your job is make sure that all of the tests that you are run are accurate. Everything has a calibration curve and samples are routine duplicated and check samples against standards are run. It gets to a point that for some parameters you end up losing money as the cost of calibration standards used are so high, it’s necessary as the consequences of getting a simple parameter such as pH wrong is absolutely unthinkable. Analytical Quality Control (AQC) becomes a part of your life and it is so deeply ingrained in whatever you do that it becomes second nature. This is the life of someone within an analytical laboratory. Moving to the Water Industry is a different way of thinking and this is especially the case within online instrumentation and yet getting things right isn’t just about protecting your reputation and making sure that things are right it’s about protection both people and the environment. You can certainly argue that the importance of getting an analysis down to a fraction of a decimal place is not so important as long as the end result is achieved and the product be it potable water to customers or treated effluent to the environment is of good quality. This is the importance of instrumentation and its calibration. The principles of calibration So, what is calibration? If you ask a group of people you are bound to get a number of different answer so what do we actually mean when we say calibration. What’s the difference between calibration and verification, when somebody says dry calibration and wet calibration then what exactly do they mean. Well to answer this let’s look at an instrument and the path that data takes when it goes from what its actually measuring all the way to the screen which is undoubtedly in front of you right now. Taking the instrument itself calibration is looking at what the instrument is actually measuring and comparing that against a national traceable standard and checking what it is recording is actually correct. So, for example if we look at a very simple calibration procedure for flow measurement and look at a British Standard Flume complete with a level based measurement device. In this application we can take, quite simply, a ruler and dip the fluid at the appropriate place and ensure that what the level based device is recording is actually a true reflection of reality. If they both say the same depth then it can be said that the level based measurement device (the secondary device) is calibrated, as long as the ruler that was used holds a calibration certificate that is in date. This is not to say that the flow measurement installation is calibrated as the primary device (the flume itself) also needs to be checked for accuracy and uncertainty to check that the flume is in good condition and is recording accurately. This, at least to my understanding and definition, is what would be called a wet calibration. Albeit a simple one. Whether a ruler is used or with the greatest accuracy a surveying kit is used as long as the reference device is of sufficient accuracy and is calibrated and traceable back to a national reference standard then the calibration is valid. What we are doing in this particular methodology is testing the accuracy of the measurement technique and making sure it is accurate as possible. For on-line instrumentation this is of course not the end of the story as there are other factors that can affect the reading that is being produced. To understand this error figure 1 shows a typical path of data from the sensor in the field to the screen in the office. Figure 1 shows a very simplified diagram of the path of data from the medium that it is analysing, through the instrument, through the transmission from site to office and to its eventual path to the telemetry system and the end users screen. The initial sensing from the medium that is being measured to the instrument has been checked by the first stage of calibration, this is the accuracy of the instrument itself. From the instrument the data gets converted to an electrical signal, most commonly an analogue signal ranging the data from an electrical signal of 4mA to the maximum the instrument has been setup to read at 20mA. This electrical signal is transmitted through a communication route… nowadays this can range from something as simple as a sim card and a GSM/GPRS signal to an on-site PLC system complete with telemetry outstation. This transmits the electrical signal through a data collection system and converts the electrical signal back into an actual number in the telemetry system. For on-line instrumentation, it is also necessary to calibrate this signal and check what is being received in the office location is the same as what is being recorded on site. Figure 1: The path of data from sensor to screen Page 10
  • 11. This is what is commonly scaling calibration and is one of the techniques that would fall into a dry verification technique as it’s not actually testing the method of measurement and the accuracy of the instrument itself it is testing the accuracy of the transmission method. These are the simplest of all of the calibration methods but of course with some instrumentation it isn’t possible to use the simplest of techniques and it is often necessary to use surrogate techniques. This is the case for electro-magnetic flow meters and if anyone has been lucky enough to go and see them being made the accuracy of the measurement technique can quite clearly be understood. When each and every flow meter gets made the last step in the process is a factory calibration. Electro-magnetic flow meter manufacturers spend vast amounts of money in ensuring the quality of their products are correct and the flow rigs that are present in the factory are a work of supreme engineering. Every flow meter is basically calibrated with the same skill than an analytical chemist in a laboratory uses when calibrating his or her equipment. This is the factory calibration and is hard wired into the instrument itself. As it’s not possible to being a factory calibration into the field another method of calibration or what is termed verification is required. This verification is used to determine whether or not an instrument is within tolerances of the original factory calibration and doesn’t actually check the accuracy of the flow meter but checks that the meter is recording within specifications. The weakness of this technique is that the meter can be working within tolerances but not actually recording accurately as the underlying conditions are not working. As a result it is necessary to use alternative methods of verifying the flow meter accuracy are necessary to physically calibrate the instrument itself. Figure 3 shows two common methods which uses one flow meter to check the accuracy of the other. With analytical instruments it is often necessary to employ different techniques again depending upon the type of analysis that is being employed for example where a wet chemical method is being employed then a number of techniques can be used including using a traceable standard of known concentration which is a technique that is often used in laboratories around the world or as per the technique using for electro-magnetic flow meter using a traceable instrument to check an instrument. A lot of these instruments self-calibrate with a standard of known concentration but it is still necessary to check against an independent standard from time to time. The importance, cost and benefits of calibration We’ve talked about the how to do calibration and the importance for it to be back to a known standard, preferably a national/international standard but the question is why? Is it that important to be able to measure to an absolute accuracy or is “near enough” a case of being good enough. Is it really that important to be absolutely accurate in what you measure. Figure 2: A typical factory calibration certificate for an electro-magnetic flow meter Figure 3: Two methods of electro-magnetic flow meter verification Page 11
  • 12. The answer is well not all of the time but it depends what you do and what you are using your instrument for. My general principle for instrumentation is if its measuring something then the number that is being measured should be accurate but then I’m an engineer and I know that when it comes to designing things the value of the data that is collected can vastly alter the designs of things. As an instrumentation specialist I am aware of this fact and so I do think that instrumentation that actually produces a number should reflect the true situation or of course be marked as “For Indication Only” A few scenarios to prove the point: • A wastewater treatment works has a single dissolved oxygen probe (relatively common on single oxidation ditch sites) and the dissolved oxygen probe hasn’t been calibrated. The reading is low by a single milligram per litre and the blowers are controlled by the dissolved oxygen reading. The consumption of power and hence cost is significantly increased because of a 10 -minute calibration job. • An electro-magnetic flow meter is electronically-verified every year and appears to be ok. An independent verification using a different flow meter reveals a significant difference between the check meter and the in-situ meter. Investigation reveals that the line size has reduced by 20% due to fouling. After cleaning the check meter and the in-situ meter agree. • A level meter is reading the level in a wet well and the float probes that act as a backup are up for replacement and are not working. The level rises and because somebody has made an error in the empty distance of the probe the wet well overflows as what was 100% in the past is only 80% now. • A level-based flow meter has had its empty distance set on installation. A fresh calibration hasn’t happened two weeks later after a typical settling period. As a result after he initial 2 week period the meter has bedded in and is now reading 2mm off, the primary measurement device is a 120° V notch as a result the site appears to be flowing much higher than reality. All of these scenarios are fabricated but a simple 10-minute calibration and verification of the measured result means that the data that is collected is trusted to be accurate and can actually save thousands of pounds. There is a cost to calibration and the equipment that a water operator has to buy and keep accurate can mount up with costs in the tens of thousands of pounds per annum to ensure that the instrumentation is operating correctly however the cost of not ensuring that instrumentation is correct mounts up and by far outweighs the cost of not undertaking calibration routines. Discussion Instrumentation and keeping it maintained and recording correctly is a specialist skill and instrumentation is a specialism in its own right. One of the most dangerous situation in any industry is for an instrument to be in place and for that instrument to be unknowingly recording incorrectly. This is especially the case as the Water Industry (and industry in general) is moving more and more towards a “Smart” or “Digital” era. The cost of ensuring that instrumentation is recording correctly is relatively high when you consider the costs of purchase, installation, maintenance, calibration and replacement but what this of course should drive is increasing the value of the instrumentation that we have and potentially decreasing the amount of instrumentation so that the data and information that is gleaned from the asset base of instrumentation is as accurate as it needs to be to assist in increasing the operational efficiency of the industry as it heads towards a new digital/smart age. Suez wins Smart Water Company of the year at Global Water Awards Suez, the International Water Company, has recently won the Global Water Award for the Smart Water Company 2017. The ceremony was held at Palacio de Cibeles, Madrid on 24th April. The winners were announced in a ceremony presented by Nassim Nicholas Taleb. The prize was collected by Carlos Campos, the Chief Operating Officer of Suez Advanced Solutions. Xylem was given a distinction in the Smart Water Company Category. Other winners on the night included • Acciona for Water Company of the Year • Water Planet for Breakthrough Water Technology Company of the Year • Nairobi City Water and Sewerage Company for the Water Leaders Award • Mattershift for the Water Idol Award At the awards Mr Nassim Nicholas Taleb Former Trader, Risk Specialist and Author, delivered an informative speech on the subject of antifragile, stressing the importance of “evolution, adaption and improvement from small mistakes”. Drawing from his experience as a trader, Taleb suggest we should “train mentally to face a big, unforeseen crisis by being exposed to small mistakes and disruptions”. He was also joined on stage by Ron Keating, CEO of Evoqua. Awards were presented to The Leading Utilities of the World, the latest initiative of the Global Water Leaders Group and is the Gold Standard for utility performance. The Inaugural Meeting took place on 24 April sponsored by CH2M, where 6 utilities presented their achievements and were accepted into the network by an advisory board - all of whom represent utilities that have an unimpeachable record of innovation and performance. Trophies were awarded to Mr. Howard Neukrug, Advisory Board Chair of The Global Water Leaders Group advisory board and the new members accepted into The Leading Utilities of the World Network this afternoon. Page 12
  • 13. Article: The Need for Water Service Resilience The need for adopting sustainable water resilience strategies is becoming more apparent than ever. By 2050, the global population living in cities will increase from 50% today to 70%. A McKinsey study on transforming water economies reveals that cities are already facing increasing water stress, with demand expanded to outstrip supply by 40% by 2030. On this note, according to Arup’s recent publication, Water Resilience for Cities, “Ensuring a resilient water supply as climate patterns change and populations grow requires cities to introduce active water resource management measures.” With this mind, city officials and water operators will need to take into account long-term thinking and planning, support the deployment and implementation of ICT and smart water technologies, as well as collaborate with global industry stakeholders. As the Global Resilience Partnership explains in their piece on fresh water resilience, “A 21st century approach to water and to development is one that builds resilience. This means that we look for ways in which people at risk could actually thrive under recurrent water challenges – to anticipate, mitigate and rise above floods, rather than being swept away from them.” Let’s take a closer look at what’s involved in developing a resilient water management plan. Defining Resilience Common definitions of “water resilience” focus mostly on climate change and mitigating the impact of natural disasters. For example, according to the UK water regulator, Ofwat, resilience is “the ability to cope with and recover from disruption, and anticipate trends and variability in order to maintain services for people and protect the natural environment, now and in the future.” Another key component highlighted by SWAN, the Smart Water Networks Forum, relates to “water service resilience,” which can be broken down into four, key pillars and applied to both the water and wastewater sectors: (1) Safe Water – Quality; (2) Reliable Service – Customers; (3) Secure Systems – IT; and (4) Efficient Operations – O&M. The Four Key Pillars of Water Service Resilience The above pillars can all be optimised by transforming collected network data into actionable information using smart water and wastewater technologies, explored further below. Pillar 1: Safe Water – Quality Traditional water quality sampling relies on time consuming and often costly monitoring techniques such as ‘grab’ sampling and field/laboratory analysis. However, there are now online sensors, which can communicate real-time data about various quality parameters to a software platform to rapidly locate the source and spread of contamination. Such efforts help manage and avoid quality issues before customers are impacted. This is also relevant to the wastewater industry, as there are technologies preventing harmful sewage overflows through the deployment of data technologies. Pillar 2: Reliable Service – Customers The concept of water service resilience doesn’t only refer to the infrastructure and the network itself, but also the end users that can be impacted by water flow and quality – namely the customers themselves. More and more water utilities are already seeing the importance of improving online customer engagement and are embracing the advent of smart water meter solutions and relevant smart leak detection technologies such as fixed, acoustic sensors and remote alert systems. Page 13
  • 14. Pillar 3: Secure Systems – IT When discussing water service resilience and the transition towards smart water networks, we must consider the importance of securing our systems from an IT perspective. The move to smart water networks is supported by ICT, as automation and cybersecurity technologies and systems are helping reduce risks involved in moving towards digital water and connected grids. Pillar 4: Efficient Operations – O&M Improving water service resilience will require utilities to maximise their operational resilience, including making strides towards adopting robust hardware, predictive modelling systems, and making intelligence decisions that are based on data collected and analysed. These and similar efforts are essential when looking to provide for more efficient O&M of water networks. Securing Resilience Building a sustainable water future will require not only understanding the now, but will require planning strategies 20-25 years down the line. According to a joint Arup-Siemens report, to become resilient, cities will need to think in terms of robustness, redundancy, diversity and flexibility, responsiveness and coordination. To help streamline the process, water utilities and policymakers should first consider defining their main water service resilience indicators and goals, and then determine which individuals and/or team members will be needed in order to meet certain milestones. As this undertaking will require both management and employee support and collaboration, it should be neither rushed nor launched from a top-down approach. To effectively secure resilience, forming industry partnerships and collaborative platforms will be essential. By taking into account different global perspec- tives and learning from best practices worldwide, cities and water utilities will be better equipped to handle the main shocks and stresses that infrastructure networks are facing due to both climate change and increasing water demand. Gaining a Global Perspective We encourage all those interested in learning more and exploring the topic of water resilience to join us for the upcoming SWAN 2017 Conference from 9th -10th May in London. This will be the leading smart water conference of the year featuring 20 global water utility speakers from 13 different countries. Participants will have the opportunity to hear about more in depth case studies about the four key pillars of water service resilience as well as contribute their own insights on this increasingly important topic. HydroNET Water Control Room wins prestigious Partner for Water award 2017 The HydroNET Water Control Room in South Africa won the Partners for Water award 2017. The online water control room has been developed and implemented by a Dutch- South African consortium, led by HydroLogic. As a result of the successful introduction, over 25 South African organisations are currently using the HydroNET Water Control Room to monitor the current situation of water systems and to respond to expected water usage and quality. The Partners for Water award 2017 was handed to Leanne Reichard (right on top photo) and Bas Boterman (second left) of Hydrologic during the Waterproof event in Maarssen, the Netherlands, on 13 April. Partners for Water is a programme by the Dutch government to stimulate the use of Dutch innovative water-related solutions in foreign urban deltas and their water supply systems. Over 80 projects funded by this programme competed for the prestigious ‘best project’ award. Managing scarce water resources South Africa suffers from water stress. Fresh-water demand is expected to exceed water availability by 2025. To efficiently manage the available water resources and reduce the impacts, water managers need access to historic, current and forecasted water and weather information. The online HydroNET Water Control Room translates terabytes of data from radars, satellites, and other monitoring sources into easy to understand online decision-support dashboards. These dashboards empower water managers to make well-informed and transparent decisions for the sustainable management of their water systems. The jury explained: “This consortium provided a measurable contribution to solving world-water problems”. In her reaction to receiving the award Leanne Reichard, leader of the consortium and business director at Hydrologic, mentioned the importance of an online control room in general: “It provides water authorities with the right data at the right time so they can take well informed decisions”. Page 14
  • 15. Remember when TVs were operated using analogue? Remember the vast difference it made when your television went over to digital – reception details like the picture quality, number of channels and less programme interruptions? In the same way the movement from analogue to digital in the world of television has delivered immense benefits, industrial instrumentation has had its fair share of the same. Ease of communication and set up are just two. Others include familiar graphical displays which make it easier for users to operate their devices. Previous to the digital era, operators would simply get a fault light or a reading but no explanation of what was causing it. Today it is possible to get much more information on what particular function is experiencing an issue. Digital instruments automatically self-check the validity of their data, helping operators to pinpoint and report any difficulties encountered. Digital communications vs Traditional communications Digital communications have overcome the traditional issues caused with analogue transmission signals regarding scaling. An electronic signal would have been, as a matter of fact, an electrical signal which represented a particular measurement range, such as 0 – 500 ml/s in a flow metering application for example. The problem was that often there was a mismatch between the transmitting range of an instrument and the input scaling range of the receiving instrument. This would create incorrect readings and could cause operators to waste their time being confused because there were apparently lost measurements unaccounted for. Digital values eliminate this problem. By sending zeroes and ones from A to B, the displayed value will always be a faithful representation of what’s happening in the process being measured. Another advantage of digital protocols is that you can combine multiple different values into the signal - with traditional analogue only one signal could be sent at one time. Through digital, additional measurements can be sent along with the primary measurement such as density, temperature or pressure for example. Data is king Digital communications also enable operators to access rich diagnostics data which indicates whether an instrument needs servicing or not. An example is ABB’s AquaMaster 3 with WITS DNP3, which enables remote access to diagnostics and configuration changes. So like a speedy doctor that writes a fast prescription, if there are any problems with power management, or a sensor coil or sensor cable is broken, then the time the issue occurred and the exact location of the affected device is sent to an engineer. In this way, engineers are only deployed as and when necessary, saving both time and money and reducing the effort needed to track down and rectify a fault. Have HART, you’re halfway there Most instruments make a measurement, amplify it, convert it and then transmit it. In the past, there were possibilities of errors being introduced at each stage. Digital technology means that the measurement is converted into a digital signal as quickly as possible so that the possibility of errors creeping in is reduced. Unable to completely upgrade your system to digital? Fear not. It may be that your instruments include HART. HART stands for Highway Addressable Remote Transducer and represents an ideal halfway house solution for organisations that would like to get more from their instruments without having to completely upgrade to a digital system. Essentially it works through a digital signal being superimposed onto an analogue signal which still relies on an analogue measurement. Getting on the bus Everyone has benefitted from the transition from electronic to microelectronic. In terms of bus-based systems most top end industries have used or are using bus systems in some way. The problem with bus-based protocols is their complexity. In traditional systems it was easy to test the signal. However, bus-based systems rely on being correctly set up from the start. Making just one mistake anywhere when setting up a digital system could mean it won’t work. Tracing the root of the problem can incur a lot of extra cost and time as operators will need to check everything. This may not be a problem for big companies which have the resources in place to deal with such issues but it can present a major hurdle for smaller users where the right skills aren’t readily available. A solution to this problem comes in the form of communication. Some engineers may be familiar with writing programs for PLCs but they won’t be familiar with instrumentation. Likewise a lot of people who work with instruments are not familiar with PLCs. If these two distinct skill-sets can communicate about their requirements then companies can further explore the possibilities that digital technology can offer. Article: How digitisation has opened up new possibilities for industrial measurement Page 15
  • 16. Living the future today Future systems will differ. In fact if you’re wondering what future industrial technology will look like just have a look at the technology we use in our everyday private lives. It is likely that industrial technology will go the same way, subject to careful analysis of the security implications. In ABB’s own range of products, such developments are already apparent with features such as GSM technology which allows users to dial in to their flowmeter remotely to obtain data and make configuration changes. This has been incorporated into ABB’s AquaMaster 3 flowmeter. The use of smart portable devices for instrument configuration makes setting up hard devices in the field faster, simpler and less costly. Take the DHH805 handheld configurator for example, which has 2GB memory and a rechargeable battery with over 80 hours of battery life between charges. The inclusion of simplified Human-Machine Interface based around mobile phone controls improves usability, making training and maintenance much quicker. Whether you’re a process engineer, contractor or an instrumentation engineer, all ABB equipment will operate in the same way. Watch the video below to find out more. The inclusion of Windows interface technology on instruments also makes it easy to scroll through menus, make and change settings and navigate between different data views. The SM500F has this format making it easy to master setting up and configuration. Summary Ultimately, digital technology is steadily helping to make life easier, giving us insights into what is being measured but a whole host of other operating parameters and we can communicate with instrumentation with increasing simplicity. This in turn allows industry to make more intelligent decisions based upon the digitisation of industry as a whole. ABB and IBM partner in industrial artificial intelligence solutions ABB and IBM have recently announced a strategic collaboration that brings together ABB’s industry leading digital offering, ABB Ability, with IBM Watson Internet of Things cognitive capabilities to unlock new value for customers in utilities, industry and transport & infrastructure. Customers will benefit from ABB’s deep domain knowledge and extensive portfolio of digital solutions combined with IBM’s expertise in artificial intelligence and machine learning as well as different industry verticals. The first two joint industry solutions powered by ABB Ability and Watson will bring real-time cognitive insights to the factory floor and smart grids. “This powerful combination marks truly the next level of industrial technology, moving beyond current connected systems that simply gather data, to industrial operations and machines that use data to sense, analyze, optimize and take actions that drive greater uptime, speed and yield for industrial customers,” said ABB CEO Ulrich Spiesshofer. “With an installed base of 70 million connected devices, 70,000 digital control systems and 6,000 enterprise software solutions, ABB is a trusted leader in the industrial space, and has a four decade long history of creating digital solutions for customers. IBM is a leader in artificial intelligence and cognitive computing. Together, IBM and ABB will create powerful solutions for customers to benefit from the Fourth Industrial Revolution.” New suite of breakthrough solutions The new suite of breakthrough solutions developed by ABB and IBM will help companies address in a completely new way some of their biggest industrial challenges, such as improving quality control, reducing downtime and increasing speed and yield of industrial processes. These solutions will move beyond current connected systems that simply gather data, to cognitive industrial machines that use data to understand, sense, reason and take actions supporting industrial workers to help eliminate inefficient processes and redundant tasks. “This important collaboration with ABB will take Watson even deeper into industrial applications – from manufacturing, to utilities, to transportation and more,” said Ginni Rometty, IBM Chairman, president and CEO. “The data generated from industrial companies’ products, facilities and systems holds the promise of exponential advances in innovation, efficiency and safety. Only with Watson’s broad cognitive capabilities and our platform’s unique support for industries can this vast new resource be turned into value, with trust. We are eager to work in partnership with ABB on this new industrial era.” Bringing real-time cognitive insights to the factory floor For example, ABB and IBM will leverage Watson’s artificial intelligence to help find defects via real-time production images that are captured through an ABB system, and then analyzed using IBM Watson IoT for Manufacturing. Previously, these inspections were done manually, which was often a slow and error-prone process. By bringing the power of Watson’s real time cognitive insights directly to the shop floor in combination with ABB’s industrial automation technology, companies will be better equipped to increase the volume flowing through their production lines while improving accuracy and consistency. As parts flow through the manufacturing process, the solution will alert the manufacturer to critical faults – not visible to the human eye – in the quality of assembly. This enables fast intervention from quality control experts. Easier identification of defects impacts all goods on the production line, and helps improve a company’s competitiveness while helping avoid costly recalls and reputational damage. Bringing real-time cognitive insights to smart grids In another example, ABB and IBM will apply Watson’s capabilities to predict supply patterns in electricity generation and demand from historical and weather data, to help utilities optimize the operation and maintenance of today’s smart grids, which are facing the increased complexity created by the new balance of conventional as well as renewable power sources. Forecasts of temperature, sunshine and wind speed will be used to predict consumption demand, which will help utilities determine optimal load management as well as real-time pricing. Page 16
  • 17. Case Study: Anglian Water uses mapping tool for retrofit SuDS As part of its plans to shape and develop its surface water management strategy, Anglian Water has been working with a specialist team at engineering and design consultancy, Atkins, to look at the opportunities for installing Sustainable Drainage Systems (SuDS) within existing communities to manage surface water. As part of its plans to shape and develop its surface water management strategy, Anglian Water has been working with a specialist team at engineering and design consultancy, Atkins, to look at the opportunities for installing Sustainable Drainage Systems (SuDS) within existing communities to manage surface water. SuDS are increasingly being explored as a chosen option for managing surface water by water companies due to the range of wider benefits that they can provide including the energy savings from the reduced pumping costs; the increase in green space improving local amenity; carbon reduction; and creating headroom in the water infrastructure to allow for growth. The Atkins team used its SuDS Studio toolkit to analyse 1,900km2 of catchments in the Anglian Water region to identify locations where SuDS could help manage surface water. The SuDS Studio toolkit is a unique geospatial tool that identifies feasible SuDS and then selects the most cost-beneficial feasible solution. It does this by inputting a range of GIS data that defines the geospatial relationship between sources and runoff and locations that SuDS could be installed. The approach also includes datasets on constraints (such as flood zones, listed buildings, topography etc.) to ensure the assessment is robust. It is different to other mapping tools as it eliminates solutions using engineering criteria. As a rapid assessment tool, it is a much more cost effective than the traditional approach, whereby areas previously had to be assessed individually by hand / boots on the ground. The tool also prioritises the opportunities for SuDS, which is extremely helpful to those using the tool, and provides information on constraints associated with each site. Using SuDS Studio at Anglian In the case of Anglian Water, 16 different types of SuDS solutions were included as part of the assessment, along with the unit costs for each type of solution. This ensured that Anglian Water was shown the most cost-effective solution for each site as the preferred option. To ensure the SuDS options would be future-proofed from climate change and unpredictable weather, a number of climate change scenarios (including a 100 year plus climate change scenario) were run through the model. Representatives from Anglian Water were consulted throughout the course of project. The dataset, highlighting the options for SuDS retrofit opportunities, is now available for staff at Anglian Water to use to help match the best solutions to the need, and shape its overall surface water strategy. Not only can the tool be run quickly, saving time and money, it can also be re-run very easily. The key benefit for Anglian Water was that it was able to see all the opportunities for SuDS across its entire operating area, enhancing its ability to make decisions about the best opportunities for the implementation of SuDS and prioritising investment. The scope of the SuDS Studio was demonstrated by providing the opportunity for Anglian Water to see not only where surface water could be removed but also how to maximise the benefits of SuDS at the same time, such as how to improve the water or air quality, reduce noise or heat island effects and improve biodiversity and amenity. Whilst these are tertiary requirements for SuDS, they are important aspects that add value to Anglian Water’s overall surface water strategy. The SuDS Studio project produced the following results for the water company: • 13.5 million feasible SuDS solutions were identified and mapped; • Over 5.5 million cost effective SuDS solutions were short-listed; • Analysis was undertaken of SuDS opportunities across different catchment types across Anglian Water’s entire operating region; • As the model can rapidly scan large areas it has meant that SuDS solutions could be fast tracked for engineering and modelling; and • The tool ensured the solutions identified would be resilient to climate change. Next steps The SuDS Studio outputs have given Anglian Water a much better understanding of the surface water removal potential for its entire region. This will support it with its long-term strategy planning, and look at the opportunities for mitigating the future demands of growth, climate change and catchment creep together with reducing flood risk, energy usage and improving water quality. The data from the SuDS Studio project is now being incorporated and utilised by their scheme delivery teams to look for surface water removal opportunities for a number of new projects. Anglian Water sees that an essential and hugely important part of its plans is to work closely with their other flood risk partners, including lead local flood authorities and district councils. Consequently Anglian Water will be sharing the opportunities highlighted by SuDS Studio with these partners to enable the delivery of partnership funded opportunities. A key part of its future plans is also the involvement of its customers. Implementing SuDS will be a sea-change from more traditional engineering solutions, and it is a journey that they want their customers to understand and be involved with. Page 17
  • 18. Article: The measurement of turbidity & solids in wastewater The measurement of turbidity is one of the most common parameters in the wastewater industry from its measurement as a surrogate parameter for suspended solids in final effluent to its measurement as a surrogate for mixed liquor in activated sludge plant it forms the fundamental basis of the majority of the operational solids measurement in the wastewater industry. Why is Water turbid - a brief introduction We say that a particular water sample is turbid when the sample is hazy or cloudy. The main effect of the haziness is that we cannot see clearly through the sample after a certain distance, as the distance over which it is possible to see clearly decreases as the turbidity increases. Turbidity is caused by material suspended in the water, which can scatter or absorb light travelling through the water. Scattering is the process by which light travelling in one direction is deflected by particles in suspension into a different direction of travel. Absorption is the reduction in the intensity of light as it travels through the sample. In general the effect of turbidity is to increase the amount of light seen at an angle with respect to the propagation of the illumination, and a reduction in the amount of light seen through the sample, as shown in Fig. 1. In general, light is scattered by particles in suspension, such as sand, organic particles, or microorganisms, whereas absorption is due to dissolved materials. The presence of dissolved materials that absorb light is generally indicated by colour in the sample. The presence of absorbing material affects the light equally in all directions, and has the effect of reducing the light intensity measured in any given direction for the particular wavelengths at which the material absorbs, while other wavelengths are unaffected. This selective absorption leads to the brownish colour of water that contains a significant amount of dissolved organic matter, because the dissolved organic matter absorbs the light in the blue end of the spectrum, leaving the red unaffected. Scattering, on the other hand, is a somewhat more complicated phenomenon. When we illuminate a sample that contains particles in suspension (scatterers) with a beam of light, some of the light will be deviated and re-emitted in different directions, leading to a distribution of light intensity that depends on the angle at which we measure the light with respect to the direction of illumination. This is shown in Fig. 2. The actual intensity of the scattered light, that is, how much of the incident light is scattered away from the direction of illumination, depends on the refractive index difference between the particles and the water, and how many particles there are. We would expect that if we put the same number of silicon dioxide particles and titanium dioxide particles in water, we would get a lot more scattered light from the titanium dioxide suspension than the silicon dioxide suspension, because the refractive index of titanium dioxide is 2.5, while the refractive index of silicon dioxide is 1.45, and the refractive index of water is 1.33. Another factor that influences the total amount of scattered light is the wavelength of the light used to illuminate the sample; shorter wavelengths are scattered more effectively, and will produce a larger signal than longer wavelengths for the same sample. Another feature of interest is the angular distribution of the scattered intensity, that is, how much light would we expect to see at a given scattering angle. The main factor affecting the angular distribution of the scattered light is the relative size of the particles to the wavelength of the light used to illuminate the particles. Fig. 3 shows the expected light distribution with angle when we illuminate a sample with a wavelength of 850 nm, the refractive index of the particles is 1.45 and the refractive index of the medium (water) is 1.33. The x axis is the scattering angle measured as in Fig. 2, where 0° corresponds to light that travels straight through the sample, and 180° corresponds to light that is scattered back towards the source. The y axis represents the relative intensity of light at each angle. Figure 1: Transmission, absorption and scattering of light by a turbid sample Figure 2: Geomerty of Light Scattering Page 18
  • 19. Particles larger than the wavelength of the light (a 10 μm particle is used for this example), produce an intensity pattern that varies quite rapidly with the scattering angle, with high peaks and deep troughs, but on the whole, most of the light is scattered in the forward direction. As the particle size changes, the position of the peaks and troughs varies and the intensity of the forward-scattered light increases. For particles of about the same size as the wavelength of light, the variation of the scattered intensity with angle is much slower (1 μm particle), and for particles much smaller than the wavelength (100 nm particle), there is no angular dependency for the scattered light. In a real sample, we would have a mixture of materials with different refractive indices and particle size distributions, as well as dissolved absorbing materials. The total turbidity in such a system could be defined as the amount of light measured at a given angle. Defined in this way, the turbidity would be a result of the amount of light scattered in that direction by each of the particles according to their size and refractive index, minus the light absorbed by the dissolved materials. Measuring Turbidity in Practice In the previous section, we described how the turbidity of a water sample could be determined by illuminating the sample, and measuring the amount of light scattered at a given angle. The problem, then, is to define a unit of turbidity that can be used to compare measurements from different devices and to design devices that produce results that are directly comparable. As we have seen the amount of light scattered in a given direction will depend on the refractive index of the particles in suspension, the distribution of sizes of the particles, the wavelength of the light and the presence of material that absorbs the light used to illuminate the system. To be able to compare the measurements from two instruments, we need to ensure that the same sample produces the same amount of light on the detector of both instruments. There are these factors to consider: • Sensitivity: both instruments must produce the same output when illuminated with the same amount of light • Angular response: both instruments must be designed to collect light over the same angular aperture • Illumination: both instruments must use a light source with the same wavelength distribution, so that they produce the same angular distribution of scattered light, and are affected equally by absorption of light by the sample Originally, instruments such as the Jackson turbidimeter aimed to produce a system that was repeatable in terms of sensitivity, by referring to a certain standard sample, first the Jackson silica standard, and then the Formazin standard. However, with the advent of photoelectric detectors, the actual optical design of the instrument became an important factor in the standardization of the measurement of turbidity. Two standards aimed at helping the production of turbidimeters that are comparable to each other are currently available specifically, the EPA 180.11 method and the ISO7027 standard. The purpose of these standards is to ensure that results obtained with a turbidimeter that has been designed to meet the standard guidelines are comparable to the results of any other turbidimeter that meets the same guidelines. Both standards use a scattering angle of 90°, which is called nephelometric arrangement, but each of them use a different wavelength and different prescriptions on the geometry of the illumination and detection. Using detection at 90° reduces the effect of stray light and absorption. The EPA standard was designed to harmonize the design of turbidimeters that used incandescent light sources, with illumination wavelengths peaking in the green region of the spectrum. These devices work well at low turbidity values, owing to the shorter wavelength. However, they suffer some limitations when significant amounts of dissolved organic matter are present, as shorter wavelengths are absorbed quite effectively by the dissolved organics. The ISO standard, on the other hand, stipulates the use of light in the near infrared region. Using a longer wavelength reduces the effect of absorption by organic contaminants on the measurement significantly. Another advantage of the ISO design is that the spectral distribution of the illumination source is more Figure 3: Angular distribution of light scattered by particles of different sizes. Page 19
  • 20. tightly defined, as well as the optical layout, reducing the possibility of differences in reading between instruments designed to this standard. Using turbidity to measure suspended solids We have described how the turbidity of a sample is measured as the intensity of light scattered by the material suspended in the sample, and how the scattered light intensity is proportional to the number of suspended particles, the suspended solids. Based on this, we should be able to use the turbidity of a sample to infer the mass of particles in suspension that produce that level of turbidity. For a given sample, all that is needed is to produce a calibration curve that relates the mass of suspended solids to the turbidity. This relation will be linear, as shown in Fig. 4. In a general case, the slope of the linear relation will be sample dependent, as shown in Fig. 4 and that slope would be very difficult to calculate theoretically, so it is normally determined by calibration. Traditionally, the laboratory-based gravimetric procedure has been used for obtaining the data needed for calibration in accordance with ASTM method D5907-103. In this procedure, the solids are filtered out from the water before being dried and then weighed to produce a value in mg/l for total suspended solids. This measurement is then correlated with the turbidity measurement, with the resulting data being used to produce the calibration curve. The problem of achieving a reliable calibration Whilst the gravimetric procedure can be useful when trying to establish a relationship between total suspended solids and turbidity, a single sample based on the technique will not, by itself, provide a complete or reliable picture of overall conditions. First and foremost, as a ‘one-off’ measurement, it will only ever be representative of a certain set of conditions at a certain moment in time. A measurement obtained using the technique will therefore only be effective as a general guide to an ideal set of conditions, which may not apply universally. It is important to remember also that suspended solids levels can vary independently of the turbidity measurement. Turbidity, which is measured in NTU, provides a measurement of the impact of suspended solids on the passage of light through water. Total suspended solids, which is measured in mg/l, is a quantitative measurement of the concentration of suspended particles in a given sample. As such there is no single way of recognising the differences in the size and/or composition of the suspended particles, or the impact that those particles may have on measuring turbidity. A quantity of coal dust, for example, would have a different impact on turbidity than an identical quantity of silt, as they will scatter and absorb light in different ways. For a given sample, it is possible to build a calibration curve to convert the turbidity value to a suspended solids value, as shown in Fig. 4. This has a particular impact on processes with changing conditions that could affect the composition of the sample. Such changes will have a direct bearing on the calculation of the coefficients in the calibration curve. If the composition or the particle size distribution of the sample changes, the slope will also change and a new calibration will be required. Calibration in practice In a typical installation, the user will take grab samples from the process water, record the turbidity reading at the time, and measure the suspended solids content of the grab sample using a laboratory method such as ASTM D5907-10. The turbidity reading taken at the time the grab sample was obtained and the suspended solids value from the laboratory method can then be used to calculate a conversion coefficient from turbidity to suspended solids as follows. C = TSS Turb Figure 4: Relationship between suspended solids and turbidity for Fullers earth and kaolin. Page 20
  • 21. In this equation, c is the conversion coefficient, TSS is the suspended solids content and Turb is the turbidity reading. Fig. 5 shows the values of laboratory measured TSS plotted against the turbidity values read when the sample was taken for a large set of samples over several months at a waste water treatment plant. Rather than sitting on a straight line, the points form a cloud around a line of best fit. Using any single point from the cloud to calculate the calibration coefficient would introduce a significant bias. The user might be tempted to recalculate the conversion factor every time a new grab sample is taken, in an effort to improve the accuracy of the suspended solids value inferred from the turbidity reading. In Fig. 6 (green triangles), we show the value of the c coefficient that would have been obtained after each of the individual measurements. We can clearly see from this figure that the conversion factor varies quite widely from measurement to measurement. The variation of the conversion factor is a result of a combination of several factors, such as sampling error when obtaining the grab sample, the repeatability error of the turbidity reading, the laboratory error on the suspended solids value and so on. If we were to recalculate the conversion factors after each measurement, there would be sudden jumps in the inferred values of TSS from turbidity when the change in coefficient is applied as shown in Fig. 7. A better approach to the calculation of a reliable conversion factor would be to keep a history of all pairs of turbidity/TSS readings, and recalculate the slope after each new point is obtained (the black line in Fig. 6). However, such a process requires a certain level of skill from the operator, and a process in place to update the calculation every time a grab sample is taken. The red line shows the application of an adaptive filter that follows the trend of the raw data. Obtaining a reliable TSS calibration for improved process control Innovations in measurement technology are helping to overcome the problems associated with obtaining a reliable calibration. The ‘Adaptive TSS calibration’ feature in ABB’s ATS430 turbidity sensor, for example, provides a means to approximate the quality of the coefficient obtained by progressively building up the calibration coefficient every time an in-process calibration is performed. Every time a new TSS value is input to the ATS430 sensor, a new coefficient is calculated as a weighted average of the current coefficient plus the new coefficient. Using the adaptive calibration has the advantage that the calibration coefficient follows changes in the process, but smooths out sudden jumps in the coefficient that are more likely to be due to normal variations in the process, or errors in the determination Fig. 7 shows the effect of using the different approaches to calculating the conversion factor on the value of TSS reported by the sensor. The orange line is the TSS value that would be obtained if the factor was calculated only using the point measurement as taken; the black line shows the TSS value that would be obtained if the coefficient was built from a progressive linear fit of the data, and the dark green line shows the TSS value obtained using the adaptive fitting. From the results shown in Fig. 7, it is easy to see that the adaptive fitting provides a smoother time response of the process variable, while at the same time following long term changes in the process. Figure 5: Suspended solids content versus turbidity in an aeration lane at a municipal waste water treatment plant. Figure 6: Different strategies to calculate the suspended solids cali- bration using the data from Fig. 5. Figure 7: Effect of the change of calibration coefficient in the reported suspended solids value. Page 21
  • 22. May/ June 2017 Specification & Installation of Sensors 3rd May 2017 Principality Stadium, Cardiff, Wales Hosted by the Sensors for Water Interest Group SWAN Conference 2017 9th -10th May 2017 Tower Hotel, London UK Hosted by the SWAN Forum Leakage 24rd May 2017 NEL, Glasgow, Scotland Hosted by the Sensors for Water Interest Group 12th Specialized Conference in ICA 11th -14th June 2017 Quebec City, Canada Hosted by the International Water Association The Journey towards a Smart Water Network 22nd June 2017 Etihad Stadium, Manchester Hosted by ATi July 2017 Low Cost Sensors 5rd July 2017 University of Southampton, UK Hosted by the Sensors for Water Interest Group September 2017 Sensing in Water 2017 27th -28th September 2017 Nottingham Belfry, Nottingham, UK Hosted by the Sensors for Water Interest Group WEFTEC 30th September - 4th October 2017 McCormick Place, Chicago USA Hosted by the Water Environment Federation October 2017 Wetsus Congress 9th - 10th October 2017 Leeuwarden, Holland Hosted by Wetsus Page 22 Conferences, Events, Seminars & Studies Conferences, Seminars & Events Specification & Installation of Sensors: Giving the sensor the best chance Where: Principality Stadium, Cardiff When: 3rd May 2017 Getting reliable data from sensors and instruments relies on three key steps – getting the right instrument for the job, installing it correctly and performing appropriate on-going maintenance and calibration. This event focuses on the first two steps. To get the right instrument needs a good specification and understanding of the application. We will look at the role of Standards, from MCERTS to ISOs, from the viewpoints of users and suppliers, exploring whether they can be a barrier or an aide in improving quality and innovation. We will also look at the role that robust technical evaluation can play in procurement of instrumentation against a user specification for a particular application. Good installation practice is also key to good performance. Some of the latest findings related to installation of flowmeters and other instruments will be presented. Leakage Where: NEL Glasgow When: 24rd May 2017 Leakage of water from the distribution network continues to challenge the water industry. Water companies are focussed on managing leakage to levels that are acceptable to customers and justifiable on economic grounds. The industry is also concerned about the long term resilience of water supply, and see the need for lower levels of leakage to improve resilience. At the same time, many water companies have incentivised targets to reduce leakage further. Therefore, there is a need for reliable and accurate measurement of leakage in the distribution system; from the point of abstraction, through the treat- ment process, and up to the customers’ stop tap. Improved measurements are needed in terms of quantifying leakage in different areas, accurately pinpoint- ing leakage in the network, and prioritising leakage repairs. Sensors, measurement systems and data analytics play an important part in managing and reducing leakage. This workshop will bring together water companies, researchers and the supply chain to explore how new technologies and systems can help to reduce leakage and save water.
  • 23. Don’t miss the upcoming SWAN 7th Annual Conference to be held 9th -10th May, 2017 at the Tower Hotel in London. This year’s conference will focus on creating smart, resilient water and wastewater systems, encompassing four key pillars: • Safe water quality • Reliable service • Secure systems • Efficient operations This two-day event will feature 20 leading, global water utilities, including speakers from Veolia, Suez, PUB, American Water, Unitywater, Essbio, AEGEA, FCC Aqualia, Vitens, City of Dakar, Taiwan Water Corporation, and the OECD. SWAN is pleased to offer conference attendees a special rate of £185 inc VAT (inc breakfast) at the Tower Hotel. Note, this rate will only be available until March 10th. View the agenda here Register here Proudly Sponsored by Page 23