SlideShare uma empresa Scribd logo
1 de 10
Baixar para ler offline
SMAC: Sales Marketing & Communication
This is an DW/BI System based upon imported SAP SI data combined with manually inserted Forecast
etc, imported internet market info etc.
We defined what we named the Blood Vein of companies in the production/sales business.
This consists of the following (generating $):
After creating a DW based upon these information types we created a BI Solution on top of this more or
less being able to visualize all sorts of valuable business information related to this Blood Vein.
This enables the business to take full advantage of all the valuable business information already available
in your ERP system, on Internet etc.
From this the business is able to take full control of this very important information value chain and
thereby refine the business accordingly, do the necessary organisational changes, educate the workforce
to work more effective and professional, all focusing on the common and clearly defined goals etc.
Some of the functionality related to this BI Solution is shown below in this document:
Order
data
Delivery
data
Invoice
data
Accounting
data
Payment
data
Stock
data
Production
data
Market
prices
Forecast, Budget &
Planning data
Quantity Deviation
-30
-20
-10
0
10
20
30
jan
2005
feb
2005
mar
2005
apr
2005
mai
2005
jun
2005
jul
2005
aug
2005
sep
2005
okt
2005
nov
2005
des
2005
jan
2006
feb
2006
mar
2006
apr
2006
mai
2006
jun
2006
jul
2006
aug
2006
sep
2006
okt
2006
nov
2006
des
2006
jan
2007
feb
2007
mar
2007
apr
2007
mai
2007
jun
2007
jul
2007
aug
2007
sep
2007
okt
2007
nov
2007
Deviation(%)
10 000
20 000
30 000
40 000
50 000
60 000
70 000
Quantity(MT)
Actual
Quantity
(MT)
Last
Year
Dev (%)
Forecast
Dev (%)
Forecast
Backup
Dev (%)
Budget
Dev (%)
YTD September-2007 Quantity Deviation
-120
-100
-80
-60
-40
-20
0
20
40
60
West Europe
exNordic
Nordic East Europe Middle East Far East Oceania Africa South America North America Div. Countries
Deviation(%)
50 000
100 000
150 000
200 000
250 000
300 000
350 000
400 000
Quantity(MT)
Actual
Quantity
(MT)
Last
Year
Dev (%)
Forecast
Dev (%)
Forecast
Backup
Dev (%)
Budget
Dev (%)
Planning
Dev (%)
Quarterly Q3-2007 Quantity Deviation
-150
-100
-50
0
50
100
150
West Europe
exNordic
Nordic East Europe Middle East Far East Oceania Africa South America North America Div. Countries
Deviation(%)
20 000
40 000
60 000
80 000
100 000
120 000
140 000
Quantity(MT)Actual
Quantity
(MT)
Last
Year
Dev (%)
Last
Quarter
Dev (%)
Forecast
Dev (%)
Forecast
Backup
Dev (%)
Budget
Dev (%)
Planning
Dev (%)
Early & late days Averages, (EUR), 200601 - 200712
For Strat. Unit=Suspension
-9
-6
-15
-10 -11 -10
-16 -15
-11 -12
-7
-9
-15
-7
-16
-12 -13
-10
-14 -13 -12
-17
-14
2 2 2 2 2 2 3 2 2 2 2 2 2 2 2 2 2 2 2 1 2 1 2
6 6 5 6 6 6 6 7 6 6 6 6 6 5 5 6 5 5 6 6 7 7 6
31
26 26
18
30
23
18
29
21
18
21
24
21
22
45
26
17
35
20
42
19
22
15
-20
-10
0
10
20
30
40
50
jan
2006
mar
2006
mai
2006
jul
2006
sep
2006
nov
2006
jan
2007
mar
2007
mai
2007
jul
2007
sep
2007
nov
2007
AverageDays
Average early days Average 1-3 days late
Average 4-10 days late Average >10 days late
Early & late days Distribution, (EUR), 200601 - 200712
For Strat. Unit=Suspension
0
10
20
30
40
50
60
70
80
90
100
jan
2006
mar
2006
mai
2006
jul
2006
sep
2006
nov
2006
jan
2007
mar
2007
mai
2007
jul
2007
sep
2007
nov
2007
%
% early % of on time % 1-3 days late % 4-10 days late % >10 days late
Days given v.s days taken, (EUR), 200601 - 200712
For Strat. Unit=Suspension
0
10
20
30
40
50
60
70
jan
2006
mar
2006
mai
2006
jul
2006
sep
2006
nov
2006
jan
2007
mar
2007
mai
2007
jul
2007
sep
2007
nov
2007
AverageDays
Average days given Average days taken
Average Days, (EUR), 200601 - 200712
For Strat. Unit=Suspension
0
10
20
30
40
50
60
70
jan
2006
mar
2006
mai
2006
jul
2006
sep
2006
nov
2006
jan
2007
mar
2007
mai
2007
jul
2007
sep
2007
nov
2007
AverageDays
Days
Given
Days
Early
Days
Late
Days
Taken
All Payments, (EUR), 200601 - 200712
For Strat. Unit=Suspension
0
100
200
300
400
500
600
700
800
jan
2006
mar
2006
mai
2006
jul
2006
sep
2006
nov
2006
jan
2007
mar
2007
mai
2007
jul
2007
sep
2007
nov
2007
0
100
200
300
400
500
600
700
800
AverageDays
WCC
Given
KEUR
WCC
Gain
KEUR
WCC
Loss
KEUR
Days
Given
WCC
Taken
KEUR
Late Payments, (EUR), 200601 - 200712
For Strat. Unit=Suspension
0
50
100
150
200
250
300
350
400
jan
2006
mar
2006
mai
2006
jul
2006
sep
2006
nov
2006
jan
2007
mar
2007
mai
2007
jul
2007
sep
2007
nov
2007
0
10
20
30
40
50
60
70
AverageDays
WCC
Given
KEUR
WCC
Loss
KEUR
Days
Given
Days
Delay

Mais conteúdo relacionado

Semelhante a SMAC Overview

Transforming big data into supply chain analytics
Transforming big data into supply chain analyticsTransforming big data into supply chain analytics
Transforming big data into supply chain analyticsTristan Wiggill
 
Monthly Sales Scorecard PowerPoint Presentation Slides
Monthly Sales Scorecard PowerPoint Presentation SlidesMonthly Sales Scorecard PowerPoint Presentation Slides
Monthly Sales Scorecard PowerPoint Presentation SlidesSlideTeam
 
Revenue Forecasting PowerPoint Presentation Slides
Revenue Forecasting PowerPoint Presentation SlidesRevenue Forecasting PowerPoint Presentation Slides
Revenue Forecasting PowerPoint Presentation SlidesSlideTeam
 
Synergy PowerPoint Presentation Slides
Synergy PowerPoint Presentation SlidesSynergy PowerPoint Presentation Slides
Synergy PowerPoint Presentation SlidesSlideTeam
 
Current Assessment PowerPoint Presentation Slides
Current Assessment PowerPoint Presentation Slides Current Assessment PowerPoint Presentation Slides
Current Assessment PowerPoint Presentation Slides SlideTeam
 
Executive S&OP Case Study presented at GPSEG
Executive S&OP Case Study presented at GPSEGExecutive S&OP Case Study presented at GPSEG
Executive S&OP Case Study presented at GPSEGguestdd5f19
 
Executive S&Op Case Study Gpseg
Executive S&Op Case Study GpsegExecutive S&Op Case Study Gpseg
Executive S&Op Case Study Gpsegguest268716d
 
Stock Pitch For Mailing Shipping Services PowerPoint Presentation PPT Slide T...
Stock Pitch For Mailing Shipping Services PowerPoint Presentation PPT Slide T...Stock Pitch For Mailing Shipping Services PowerPoint Presentation PPT Slide T...
Stock Pitch For Mailing Shipping Services PowerPoint Presentation PPT Slide T...SlideTeam
 
Startup Valuation - Hervé Lebret 2020
Startup Valuation - Hervé Lebret 2020Startup Valuation - Hervé Lebret 2020
Startup Valuation - Hervé Lebret 2020Hervé Lebret
 

Semelhante a SMAC Overview (20)

Transforming big data into supply chain analytics
Transforming big data into supply chain analyticsTransforming big data into supply chain analytics
Transforming big data into supply chain analytics
 
green cross corp 006280 Algorithm Investment Report
green cross corp 006280 Algorithm Investment Reportgreen cross corp 006280 Algorithm Investment Report
green cross corp 006280 Algorithm Investment Report
 
Monthly Sales Scorecard PowerPoint Presentation Slides
Monthly Sales Scorecard PowerPoint Presentation SlidesMonthly Sales Scorecard PowerPoint Presentation Slides
Monthly Sales Scorecard PowerPoint Presentation Slides
 
genie music 043610 Algorithm Investment Report
genie music 043610 Algorithm Investment Reportgenie music 043610 Algorithm Investment Report
genie music 043610 Algorithm Investment Report
 
Revenue Forecasting PowerPoint Presentation Slides
Revenue Forecasting PowerPoint Presentation SlidesRevenue Forecasting PowerPoint Presentation Slides
Revenue Forecasting PowerPoint Presentation Slides
 
datasolution 263800 Algorithm Investment Report
datasolution 263800 Algorithm Investment Reportdatasolution 263800 Algorithm Investment Report
datasolution 263800 Algorithm Investment Report
 
Synergy PowerPoint Presentation Slides
Synergy PowerPoint Presentation SlidesSynergy PowerPoint Presentation Slides
Synergy PowerPoint Presentation Slides
 
danal 064260 Algorihm Investment Report
danal 064260 Algorihm Investment Reportdanal 064260 Algorihm Investment Report
danal 064260 Algorihm Investment Report
 
Current Assessment PowerPoint Presentation Slides
Current Assessment PowerPoint Presentation Slides Current Assessment PowerPoint Presentation Slides
Current Assessment PowerPoint Presentation Slides
 
gs retail 007070 Algorithm Investment Report
gs retail 007070 Algorithm Investment Reportgs retail 007070 Algorithm Investment Report
gs retail 007070 Algorithm Investment Report
 
jeilpharm 271980 Algorithm Investment Report
jeilpharm 271980 Algorithm Investment Reportjeilpharm 271980 Algorithm Investment Report
jeilpharm 271980 Algorithm Investment Report
 
rorze systems 071280 Algorithm Investment Report
rorze systems 071280 Algorithm Investment Reportrorze systems 071280 Algorithm Investment Report
rorze systems 071280 Algorithm Investment Report
 
Executive S&OP Case Study presented at GPSEG
Executive S&OP Case Study presented at GPSEGExecutive S&OP Case Study presented at GPSEG
Executive S&OP Case Study presented at GPSEG
 
Executive S&OP Case Study presented at GPSEG
Executive S&OP Case Study presented at GPSEGExecutive S&OP Case Study presented at GPSEG
Executive S&OP Case Study presented at GPSEG
 
Executive S&Op Case Study Gpseg
Executive S&Op Case Study GpsegExecutive S&Op Case Study Gpseg
Executive S&Op Case Study Gpseg
 
nibec 138610 Algorithm Investment Report
nibec 138610 Algorithm Investment Reportnibec 138610 Algorithm Investment Report
nibec 138610 Algorithm Investment Report
 
woori-net 115440 Algorithm Investment Report
woori-net 115440 Algorithm Investment Reportwoori-net 115440 Algorithm Investment Report
woori-net 115440 Algorithm Investment Report
 
cj 001040 Algorithm Investment Report
cj 001040 Algorithm Investment Reportcj 001040 Algorithm Investment Report
cj 001040 Algorithm Investment Report
 
Stock Pitch For Mailing Shipping Services PowerPoint Presentation PPT Slide T...
Stock Pitch For Mailing Shipping Services PowerPoint Presentation PPT Slide T...Stock Pitch For Mailing Shipping Services PowerPoint Presentation PPT Slide T...
Stock Pitch For Mailing Shipping Services PowerPoint Presentation PPT Slide T...
 
Startup Valuation - Hervé Lebret 2020
Startup Valuation - Hervé Lebret 2020Startup Valuation - Hervé Lebret 2020
Startup Valuation - Hervé Lebret 2020
 

SMAC Overview

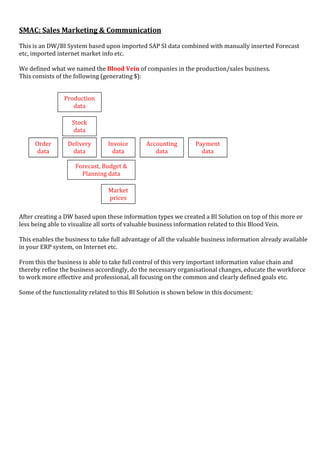
  • 1. SMAC: Sales Marketing & Communication This is an DW/BI System based upon imported SAP SI data combined with manually inserted Forecast etc, imported internet market info etc. We defined what we named the Blood Vein of companies in the production/sales business. This consists of the following (generating $): After creating a DW based upon these information types we created a BI Solution on top of this more or less being able to visualize all sorts of valuable business information related to this Blood Vein. This enables the business to take full advantage of all the valuable business information already available in your ERP system, on Internet etc. From this the business is able to take full control of this very important information value chain and thereby refine the business accordingly, do the necessary organisational changes, educate the workforce to work more effective and professional, all focusing on the common and clearly defined goals etc. Some of the functionality related to this BI Solution is shown below in this document: Order data Delivery data Invoice data Accounting data Payment data Stock data Production data Market prices Forecast, Budget & Planning data
  • 2.
  • 3.
  • 4.
  • 5.
  • 7. YTD September-2007 Quantity Deviation -120 -100 -80 -60 -40 -20 0 20 40 60 West Europe exNordic Nordic East Europe Middle East Far East Oceania Africa South America North America Div. Countries Deviation(%) 50 000 100 000 150 000 200 000 250 000 300 000 350 000 400 000 Quantity(MT) Actual Quantity (MT) Last Year Dev (%) Forecast Dev (%) Forecast Backup Dev (%) Budget Dev (%) Planning Dev (%) Quarterly Q3-2007 Quantity Deviation -150 -100 -50 0 50 100 150 West Europe exNordic Nordic East Europe Middle East Far East Oceania Africa South America North America Div. Countries Deviation(%) 20 000 40 000 60 000 80 000 100 000 120 000 140 000 Quantity(MT)Actual Quantity (MT) Last Year Dev (%) Last Quarter Dev (%) Forecast Dev (%) Forecast Backup Dev (%) Budget Dev (%) Planning Dev (%)
  • 8.
  • 9.
  • 10. Early & late days Averages, (EUR), 200601 - 200712 For Strat. Unit=Suspension -9 -6 -15 -10 -11 -10 -16 -15 -11 -12 -7 -9 -15 -7 -16 -12 -13 -10 -14 -13 -12 -17 -14 2 2 2 2 2 2 3 2 2 2 2 2 2 2 2 2 2 2 2 1 2 1 2 6 6 5 6 6 6 6 7 6 6 6 6 6 5 5 6 5 5 6 6 7 7 6 31 26 26 18 30 23 18 29 21 18 21 24 21 22 45 26 17 35 20 42 19 22 15 -20 -10 0 10 20 30 40 50 jan 2006 mar 2006 mai 2006 jul 2006 sep 2006 nov 2006 jan 2007 mar 2007 mai 2007 jul 2007 sep 2007 nov 2007 AverageDays Average early days Average 1-3 days late Average 4-10 days late Average >10 days late Early & late days Distribution, (EUR), 200601 - 200712 For Strat. Unit=Suspension 0 10 20 30 40 50 60 70 80 90 100 jan 2006 mar 2006 mai 2006 jul 2006 sep 2006 nov 2006 jan 2007 mar 2007 mai 2007 jul 2007 sep 2007 nov 2007 % % early % of on time % 1-3 days late % 4-10 days late % >10 days late Days given v.s days taken, (EUR), 200601 - 200712 For Strat. Unit=Suspension 0 10 20 30 40 50 60 70 jan 2006 mar 2006 mai 2006 jul 2006 sep 2006 nov 2006 jan 2007 mar 2007 mai 2007 jul 2007 sep 2007 nov 2007 AverageDays Average days given Average days taken Average Days, (EUR), 200601 - 200712 For Strat. Unit=Suspension 0 10 20 30 40 50 60 70 jan 2006 mar 2006 mai 2006 jul 2006 sep 2006 nov 2006 jan 2007 mar 2007 mai 2007 jul 2007 sep 2007 nov 2007 AverageDays Days Given Days Early Days Late Days Taken All Payments, (EUR), 200601 - 200712 For Strat. Unit=Suspension 0 100 200 300 400 500 600 700 800 jan 2006 mar 2006 mai 2006 jul 2006 sep 2006 nov 2006 jan 2007 mar 2007 mai 2007 jul 2007 sep 2007 nov 2007 0 100 200 300 400 500 600 700 800 AverageDays WCC Given KEUR WCC Gain KEUR WCC Loss KEUR Days Given WCC Taken KEUR Late Payments, (EUR), 200601 - 200712 For Strat. Unit=Suspension 0 50 100 150 200 250 300 350 400 jan 2006 mar 2006 mai 2006 jul 2006 sep 2006 nov 2006 jan 2007 mar 2007 mai 2007 jul 2007 sep 2007 nov 2007 0 10 20 30 40 50 60 70 AverageDays WCC Given KEUR WCC Loss KEUR Days Given Days Delay